Reports
- Global Locations -
Headquarters
Future Market Insights, Inc.
Christiana Corporate, 200
Continental Drive, Suite 401,
Newark, Delaware - 19713,
United States
Americas
Future Market Insights, Inc.
616 Corporate Way, Suite 2-9018,
Valley Cottage, NY 10989, United States
MEA
Future Market Insights
1602-6 Jumeirah Bay X2 Tower, Plot No: JLT-PH2-X2A,
Jumeirah Lakes Towers, Dubai,
United Arab Emirates
Europe
Future Market Insights
3rd Floor, 207 Regent Street,
W1B 3HH London
United Kingdom
Asia Pacific
Future Market Insights
Office No. 401-A, 4th Floor,
VANTAGE 9, S.No. 36/1/1,
Baner, Pune 411045, India
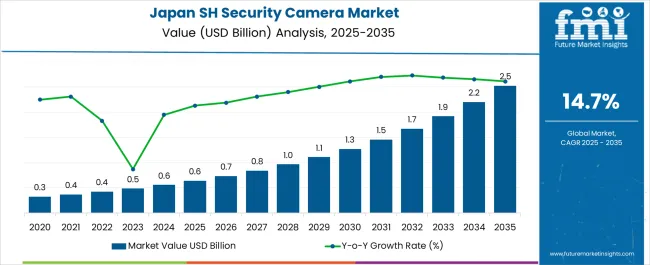
The demand for smart home security camera in Japan is expected to reach US$ 554.5 million in 2024, compared to US$ 484.6 million in 2023. The sales of smart home security camera are projected to continue at a phenomenal rate from 2024 to 2034, with a CAGR of 15.4%. By 2034, the sales of smart home security camera in Japan are forecasted to reach US$ 2,328.9 million.
Attributes | Details |
---|---|
Industry Size for Japan in 2024 | US$ 554.5 million |
Expected Industry Size for Japan by 2034 | US$ 2,328.9 million |
Forecasted CAGR between 2024 to 2034 | 15.4% |
Don't pay for what you don't need
Customize your report by selecting specific countries or regions and save 30%!
Two regions other than Japan are studied for smart home security camera. Trends and challenges in the sale of smart home security camera are provided for all three regions. The regions by name are Korea and Western Europe.
Demand for Smart Home Security Camera in Japan:
Attributes | Demand for Smart Home Security Camera in Japan |
---|---|
CAGR (2024 to 2034) | 15.4% |
Valuation (2024) | US$ 554.5 million |
Key Trend | Growing smart home adoption trend surges in Japan |
Key Challenge | Cybersecurity risks pose threats from potential hackers |
Demand for Smart Home Security Camera in Korea:
Attributes | Demand for Smart Home Security Camera in Korea |
---|---|
CAGR (2024 to 2034) | 17.2% |
Valuation (2024) | US$ 259.7 million |
Key Trend | Positive outlook toward technological advancements like AI in security camera |
Key Challenge | Prices too steep for certain sections of population |
Demand for Smart Home Security Camera in Western Europe:
Attributes | Demand for Smart Home Security Camera in Western Europe |
---|---|
CAGR (2024 to 2034) | 9.1% |
Valuation (2024) | US$ 1,627.9 million |
Key Trend | Surge in burglaries grips Western Europe's security concerns |
Key Challenge | Averse weather makes smart home security camera prone to damage |
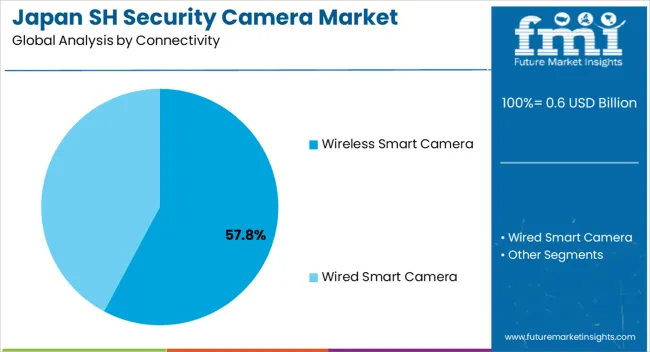
Wired smart camera have the edge over wireless smart camera in Japan. For 2024, the industry share by connectivity of wired smart camera is tipped to be 70.4% in Japan.
Wired smart camera have earned the trust of consumers in Japan. Although technologically advanced, wireless smart camera are also prone to hacking. Thus, wired smart camera are being relied upon by consumers in Japan.
Demand for Smart Home Security Camera in Japan Based on Connectivity | Wired Smart Camera |
---|---|
Industry Share in 2024 | 70.4% |
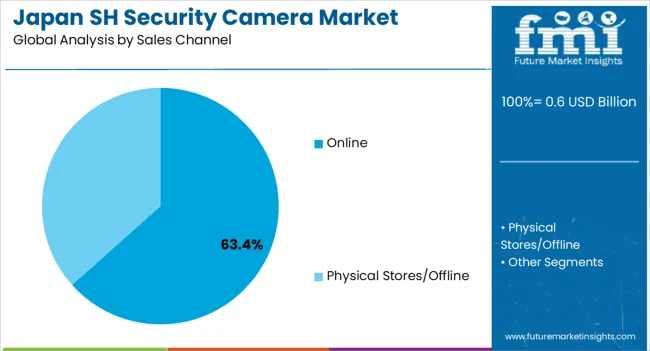
People in Japan flock to physical stores to get hold of smart home security camera. For 2024, the industry share of physical stores/offline is predicted to be 70.9%.
While the eCommerce sector is growing, consumers in Japan still prefer the offline mode to buy smart home security camera. Physical stores allow for a closer inspection of the product before it is purchased. Thus, more confidence is placed in the offline mode by consumers in Japan.
Demand for Smart Home Security Camera in Japan Based on Sales Channel | Physical Stores/Offline |
---|---|
Industry Share in 2024 | 70.9% |
Get the data you need at a Fraction of the cost
Personalize your report by choosing insights you need
and save 40%!
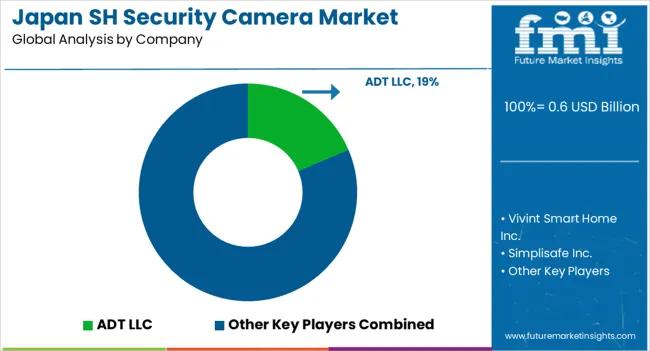
The landscape of smart home security camera in Japan is saturated with several local companies. Furthermore, multinational foreign giants have also made an impact in Japan, establishing a foothold in the country. Advancements in technology are considered a must by industry players to maintain strong positions. Japan-based industry players also focus on exports out of Japan.
Recent Developments Observed in Smart Home Security Camera in Japan
Attribute | Details |
---|---|
Estimated Industry Size in 2024 | US$ 554.5 million |
Projected Industry Size by 2034 | US$ 2,328.9 million |
Anticipated CAGR between 2024 to 2034 | 15.4% CAGR |
Historical Analysis of Demand for Smart Home Security Camera in Japan | 2019 to 2023 |
Demand Forecast for Smart Home Security Camera in Japan | 2024 to 2034 |
Report Coverage | Industry Size, Industry Trends, Key Insights for Smart Home Security Camera in Japan, Insights on Global Players and Leading Industry Strategy in Japan, Ecosystem Analysis of Local and Regional Japan Providers |
Key Companies Profiled |
|
Key Cities Analyzed |
|
1. Executive Summary 1.1. Market Outlook 1.2. Demand-side Trends 1.3. Supply-side Trends 1.4. Technology Roadmap Analysis 1.5. Analysis and Recommendations 2. Market Overview 2.1. Market Coverage / Taxonomy 2.2. Market Definition / Scope / Limitations 3. Market Background 3.1. Market Dynamics 3.1.1. Drivers 3.1.2. Restraints 3.1.3. Opportunity 3.1.4. Trends 3.2. Scenario Forecast 3.2.1. Demand in Optimistic Scenario 3.2.2. Demand in Likely Scenario 3.2.3. Demand in Conservative Scenario 3.3. Opportunity Map Analysis 3.4. Product Life Cycle Analysis 3.5. Supply Chain Analysis 3.5.1. Supply Side Participants and their Roles 3.5.1.1. Producers 3.5.1.2. Mid-Level Participants (Traders/ Agents/ Brokers) 3.5.1.3. Wholesalers and Distributors 3.5.2. Value Added and Value Created at Node in the Supply Chain 3.5.3. List of Raw Material Suppliers 3.5.4. List of Existing and Potential Buyer’s 3.6. Investment Feasibility Matrix 3.7. Value Chain Analysis 3.7.1. Profit Margin Analysis 3.7.2. Wholesalers and Distributors 3.7.3. Retailers 3.8. PESTLE and Porter’s Analysis 3.9. Regulatory Landscape 3.9.1. By Key Regions 3.10. Regional Parent Market Outlook 3.11. Production and Consumption Statistics 3.12. Import and Export Statistics 4. Industry Analysis and Outlook 2018 to 2022 and Forecast, 2023 to 2033 4.1. Historical Market Size Value (US$ Million) & Volume (Units) Analysis, 2018 to 2022 4.2. Current and Future Market Size Value (US$ Million) & Volume (Units) Projections, 2023 to 2033 4.2.1. Y-o-Y Growth Trend Analysis 4.2.2. Absolute $ Opportunity Analysis 5. Industry Analysis and Outlook 2018 to 2022 and Forecast 2023 to 2033, By Camera Type 5.1. Introduction / Key Findings 5.2. Historical Market Size Value (US$ Million) & Volume (Units) Analysis By Camera Type, 2018 to 2022 5.3. Current and Future Market Size Value (US$ Million) & Volume (Units) Analysis and Forecast By Camera Type, 2023 to 2033 5.3.1. Smart Video Doorbell Camera 5.3.2. Smart Indoor Camera 5.3.3. Smart Outdoor Camera 5.4. Y-o-Y Growth Trend Analysis By Camera Type, 2018 to 2022 5.5. Absolute $ Opportunity Analysis By Camera Type, 2023 to 2033 6. Industry Analysis and Outlook 2018 to 2022 and Forecast 2023 to 2033, By Connectivity 6.1. Introduction / Key Findings 6.2. Historical Market Size Value (US$ Million) & Volume (Units) Analysis By Connectivity, 2018 to 2022 6.3. Current and Future Market Size Value (US$ Million) & Volume (Units) Analysis and Forecast By Connectivity, 2023 to 2033 6.3.1. Wired Smart Camera 6.3.2. Wireless Smart Camera 6.4. Y-o-Y Growth Trend Analysis By Connectivity, 2018 to 2022 6.5. Absolute $ Opportunity Analysis By Connectivity, 2023 to 2033 7. Industry Analysis and Outlook 2018 to 2022 and Forecast 2023 to 2033, By Sales Channel 7.1. Introduction / Key Findings 7.2. Historical Market Size Value (US$ Million) & Volume (Units) Analysis By Sales Channel, 2018 to 2022 7.3. Current and Future Market Size Value (US$ Million) & Volume (Units) Analysis and Forecast By Sales Channel, 2023 to 2033 7.3.1. ecommerce/Online 7.3.2. Physical Stores/Offline 7.4. Y-o-Y Growth Trend Analysis By Sales Channel, 2018 to 2022 7.5. Absolute $ Opportunity Analysis By Sales Channel, 2023 to 2033 8. Industry Analysis and Outlook 2018 to 2022 and Forecast 2023 to 2033, By Region 8.1. Introduction 8.2. Historical Market Size Value (US$ Million) & Volume (Units) Analysis By Region, 2018 to 2022 8.3. Current Market Size Value (US$ Million) & Volume (Units) Analysis and Forecast By Region, 2023 to 2033 8.3.1. Kanto 8.3.2. Chubu 8.3.3. Kinki 8.3.4. Kyushu & Okinawa 8.3.5. Tohoku 8.3.6. Rest of Japan 8.4. Market Attractiveness Analysis By Region 9. Kanto Industry Analysis and Outlook 2018 to 2022 and Forecast 2023 to 2033 9.1. Historical Market Size Value (US$ Million) & Volume (Units) Trend Analysis By Market Taxonomy, 2018 to 2022 9.2. Market Size Value (US$ Million) & Volume (Units) Forecast By Market Taxonomy, 2023 to 2033 9.2.1. By Camera Type 9.2.2. By Connectivity 9.2.3. By Sales Channel 9.3. Market Attractiveness Analysis 9.3.1. By Camera Type 9.3.2. By Connectivity 9.3.3. By Sales Channel 9.4. Key Takeaways 10. Chubu Industry Analysis and Outlook 2018 to 2022 and Forecast 2023 to 2033 10.1. Historical Market Size Value (US$ Million) & Volume (Units) Trend Analysis By Market Taxonomy, 2018 to 2022 10.2. Market Size Value (US$ Million) & Volume (Units) Forecast By Market Taxonomy, 2023 to 2033 10.2.1. By Camera Type 10.2.2. By Connectivity 10.2.3. By Sales Channel 10.3. Market Attractiveness Analysis 10.3.1. By Camera Type 10.3.2. By Connectivity 10.3.3. By Sales Channel 10.4. Key Takeaways 11. Kinki Industry Analysis and Outlook 2018 to 2022 and Forecast 2023 to 2033 11.1. Historical Market Size Value (US$ Million) & Volume (Units) Trend Analysis By Market Taxonomy, 2018 to 2022 11.2. Market Size Value (US$ Million) & Volume (Units) Forecast By Market Taxonomy, 2023 to 2033 11.2.1. By Camera Type 11.2.2. By Connectivity 11.2.3. By Sales Channel 11.3. Market Attractiveness Analysis 11.3.1. By Camera Type 11.3.2. By Connectivity 11.3.3. By Sales Channel 11.4. Key Takeaways 12. Kyushu & Okinawa Industry Analysis and Outlook 2018 to 2022 and Forecast 2023 to 2033 12.1. Historical Market Size Value (US$ Million) & Volume (Units) Trend Analysis By Market Taxonomy, 2018 to 2022 12.2. Market Size Value (US$ Million) & Volume (Units) Forecast By Market Taxonomy, 2023 to 2033 12.2.1. By Camera Type 12.2.2. By Connectivity 12.2.3. By Sales Channel 12.3. Market Attractiveness Analysis 12.3.1. By Camera Type 12.3.2. By Connectivity 12.3.3. By Sales Channel 12.4. Key Takeaways 13. Tohoku Industry Analysis and Outlook 2018 to 2022 and Forecast 2023 to 2033 13.1. Historical Market Size Value (US$ Million) & Volume (Units) Trend Analysis By Market Taxonomy, 2018 to 2022 13.2. Market Size Value (US$ Million) & Volume (Units) Forecast By Market Taxonomy, 2023 to 2033 13.2.1. By Camera Type 13.2.2. By Connectivity 13.2.3. By Sales Channel 13.3. Market Attractiveness Analysis 13.3.1. By Camera Type 13.3.2. By Connectivity 13.3.3. By Sales Channel 13.4. Key Takeaways 14. Rest of Industry Analysis and Outlook 2018 to 2022 and Forecast 2023 to 2033 14.1. Historical Market Size Value (US$ Million) & Volume (Units) Trend Analysis By Market Taxonomy, 2018 to 2022 14.2. Market Size Value (US$ Million) & Volume (Units) Forecast By Market Taxonomy, 2023 to 2033 14.2.1. By Camera Type 14.2.2. By Connectivity 14.2.3. By Sales Channel 14.3. Market Attractiveness Analysis 14.3.1. By Camera Type 14.3.2. By Connectivity 14.3.3. By Sales Channel 14.4. Key Takeaways 15. Market Structure Analysis 15.1. Competition Dashboard 15.2. Competition Benchmarking 15.3. Market Share Analysis of Top Players 15.3.1. By Regional 15.3.2. By Camera Type 15.3.3. By Connectivity 15.3.4. By Sales Channel 16. Competition Analysis 16.1. Competition Deep Dive 16.1.1. Vivint Smart Home Inc. 16.1.1.1. Overview 16.1.1.2. Product Portfolio 16.1.1.3. Profitability by Market Segments 16.1.1.4. Sales Footprint 16.1.1.5. Strategy Overview 16.1.1.5.1. Marketing Strategy 16.1.1.5.2. Product Strategy 16.1.1.5.3. Channel Strategy 16.1.2. ADT LLC 16.1.2.1. Overview 16.1.2.2. Product Portfolio 16.1.2.3. Profitability by Market Segments 16.1.2.4. Sales Footprint 16.1.2.5. Strategy Overview 16.1.2.5.1. Marketing Strategy 16.1.2.5.2. Product Strategy 16.1.2.5.3. Channel Strategy 16.1.3. Simplisafe Inc. 16.1.3.1. Overview 16.1.3.2. Product Portfolio 16.1.3.3. Profitability by Market Segments 16.1.3.4. Sales Footprint 16.1.3.5. Strategy Overview 16.1.3.5.1. Marketing Strategy 16.1.3.5.2. Product Strategy 16.1.3.5.3. Channel Strategy 16.1.4. Brinks Home Security 16.1.4.1. Overview 16.1.4.2. Product Portfolio 16.1.4.3. Profitability by Market Segments 16.1.4.4. Sales Footprint 16.1.4.5. Strategy Overview 16.1.4.5.1. Marketing Strategy 16.1.4.5.2. Product Strategy 16.1.4.5.3. Channel Strategy 16.1.5. Skylinkhome 16.1.5.1. Overview 16.1.5.2. Product Portfolio 16.1.5.3. Profitability by Market Segments 16.1.5.4. Sales Footprint 16.1.5.5. Strategy Overview 16.1.5.5.1. Marketing Strategy 16.1.5.5.2. Product Strategy 16.1.5.5.3. Channel Strategy 16.1.6. Samsung Electronics Co. Ltd. 16.1.6.1. Overview 16.1.6.2. Product Portfolio 16.1.6.3. Profitability by Market Segments 16.1.6.4. Sales Footprint 16.1.6.5. Strategy Overview 16.1.6.5.1. Marketing Strategy 16.1.6.5.2. Product Strategy 16.1.6.5.3. Channel Strategy 16.1.7. Frontpoint Security Solutions LLC 16.1.7.1. Overview 16.1.7.2. Product Portfolio 16.1.7.3. Profitability by Market Segments 16.1.7.4. Sales Footprint 16.1.7.5. Strategy Overview 16.1.7.5.1. Marketing Strategy 16.1.7.5.2. Product Strategy 16.1.7.5.3. Channel Strategy 16.1.8. Arlo Technologies Inc. 16.1.8.1. Overview 16.1.8.2. Product Portfolio 16.1.8.3. Profitability by Market Segments 16.1.8.4. Sales Footprint 16.1.8.5. Strategy Overview 16.1.8.5.1. Marketing Strategy 16.1.8.5.2. Product Strategy 16.1.8.5.3. Channel Strategy 16.1.9. Wyze Labs Inc. 16.1.9.1. Overview 16.1.9.2. Product Portfolio 16.1.9.3. Profitability by Market Segments 16.1.9.4. Sales Footprint 16.1.9.5. Strategy Overview 16.1.9.5.1. Marketing Strategy 16.1.9.5.2. Product Strategy 16.1.9.5.3. Channel Strategy 16.1.10. Blink 16.1.10.1. Overview 16.1.10.2. Product Portfolio 16.1.10.3. Profitability by Market Segments 16.1.10.4. Sales Footprint 16.1.10.5. Strategy Overview 16.1.10.5.1. Marketing Strategy 16.1.10.5.2. Product Strategy 16.1.10.5.3. Channel Strategy 16.1.11. Ring LLC 16.1.11.1. Overview 16.1.11.2. Product Portfolio 16.1.11.3. Profitability by Market Segments 16.1.11.4. Sales Footprint 16.1.11.5. Strategy Overview 16.1.11.5.1. Marketing Strategy 16.1.11.5.2. Product Strategy 16.1.11.5.3. Channel Strategy 17. Assumptions & Acronyms Used 18. Research Methodology
Don't pay for what you don't need
Customize your report by selecting specific countries or regions and save 30%!
Table 1: Industry Analysis and Outlook Value (US$ Million) Forecast by Region, 2018 to 2033 Table 2: Industry Analysis and Outlook Volume (Units) Forecast by Region, 2018 to 2033 Table 3: Industry Analysis and Outlook Value (US$ Million) Forecast by Camera Type, 2018 to 2033 Table 4: Industry Analysis and Outlook Volume (Units) Forecast by Camera Type, 2018 to 2033 Table 5: Industry Analysis and Outlook Value (US$ Million) Forecast by Connectivity, 2018 to 2033 Table 6: Industry Analysis and Outlook Volume (Units) Forecast by Connectivity, 2018 to 2033 Table 7: Industry Analysis and Outlook Value (US$ Million) Forecast by Sales Channel, 2018 to 2033 Table 8: Industry Analysis and Outlook Volume (Units) Forecast by Sales Channel, 2018 to 2033 Table 9: Kanto Industry Analysis and Outlook Value (US$ Million) Forecast by Camera Type, 2018 to 2033 Table 10: Kanto Industry Analysis and Outlook Volume (Units) Forecast by Camera Type, 2018 to 2033 Table 11: Kanto Industry Analysis and Outlook Value (US$ Million) Forecast by Connectivity, 2018 to 2033 Table 12: Kanto Industry Analysis and Outlook Volume (Units) Forecast by Connectivity, 2018 to 2033 Table 13: Kanto Industry Analysis and Outlook Value (US$ Million) Forecast by Sales Channel, 2018 to 2033 Table 14: Kanto Industry Analysis and Outlook Volume (Units) Forecast by Sales Channel, 2018 to 2033 Table 15: Chubu Industry Analysis and Outlook Value (US$ Million) Forecast by Camera Type, 2018 to 2033 Table 16: Chubu Industry Analysis and Outlook Volume (Units) Forecast by Camera Type, 2018 to 2033 Table 17: Chubu Industry Analysis and Outlook Value (US$ Million) Forecast by Connectivity, 2018 to 2033 Table 18: Chubu Industry Analysis and Outlook Volume (Units) Forecast by Connectivity, 2018 to 2033 Table 19: Chubu Industry Analysis and Outlook Value (US$ Million) Forecast by Sales Channel, 2018 to 2033 Table 20: Chubu Industry Analysis and Outlook Volume (Units) Forecast by Sales Channel, 2018 to 2033 Table 21: Kinki Industry Analysis and Outlook Value (US$ Million) Forecast by Camera Type, 2018 to 2033 Table 22: Kinki Industry Analysis and Outlook Volume (Units) Forecast by Camera Type, 2018 to 2033 Table 23: Kinki Industry Analysis and Outlook Value (US$ Million) Forecast by Connectivity, 2018 to 2033 Table 24: Kinki Industry Analysis and Outlook Volume (Units) Forecast by Connectivity, 2018 to 2033 Table 25: Kinki Industry Analysis and Outlook Value (US$ Million) Forecast by Sales Channel, 2018 to 2033 Table 26: Kinki Industry Analysis and Outlook Volume (Units) Forecast by Sales Channel, 2018 to 2033 Table 27: Kyushu & Okinawa Industry Analysis and Outlook Value (US$ Million) Forecast by Camera Type, 2018 to 2033 Table 28: Kyushu & Okinawa Industry Analysis and Outlook Volume (Units) Forecast by Camera Type, 2018 to 2033 Table 29: Kyushu & Okinawa Industry Analysis and Outlook Value (US$ Million) Forecast by Connectivity, 2018 to 2033 Table 30: Kyushu & Okinawa Industry Analysis and Outlook Volume (Units) Forecast by Connectivity, 2018 to 2033 Table 31: Kyushu & Okinawa Industry Analysis and Outlook Value (US$ Million) Forecast by Sales Channel, 2018 to 2033 Table 32: Kyushu & Okinawa Industry Analysis and Outlook Volume (Units) Forecast by Sales Channel, 2018 to 2033 Table 33: Tohoku Industry Analysis and Outlook Value (US$ Million) Forecast by Camera Type, 2018 to 2033 Table 34: Tohoku Industry Analysis and Outlook Volume (Units) Forecast by Camera Type, 2018 to 2033 Table 35: Tohoku Industry Analysis and Outlook Value (US$ Million) Forecast by Connectivity, 2018 to 2033 Table 36: Tohoku Industry Analysis and Outlook Volume (Units) Forecast by Connectivity, 2018 to 2033 Table 37: Tohoku Industry Analysis and Outlook Value (US$ Million) Forecast by Sales Channel, 2018 to 2033 Table 38: Tohoku Industry Analysis and Outlook Volume (Units) Forecast by Sales Channel, 2018 to 2033 Table 39: Rest of Industry Analysis and Outlook Value (US$ Million) Forecast by Camera Type, 2018 to 2033 Table 40: Rest of Industry Analysis and Outlook Volume (Units) Forecast by Camera Type, 2018 to 2033 Table 41: Rest of Industry Analysis and Outlook Value (US$ Million) Forecast by Connectivity, 2018 to 2033 Table 42: Rest of Industry Analysis and Outlook Volume (Units) Forecast by Connectivity, 2018 to 2033 Table 43: Rest of Industry Analysis and Outlook Value (US$ Million) Forecast by Sales Channel, 2018 to 2033 Table 44: Rest of Industry Analysis and Outlook Volume (Units) Forecast by Sales Channel, 2018 to 2033
Figure 1: Industry Analysis and Outlook Value (US$ Million) by Camera Type, 2023 to 2033 Figure 2: Industry Analysis and Outlook Value (US$ Million) by Connectivity, 2023 to 2033 Figure 3: Industry Analysis and Outlook Value (US$ Million) by Sales Channel, 2023 to 2033 Figure 4: Industry Analysis and Outlook Value (US$ Million) by Region, 2023 to 2033 Figure 5: Industry Analysis and Outlook Value (US$ Million) Analysis by Region, 2018 to 2033 Figure 6: Industry Analysis and Outlook Volume (Units) Analysis by Region, 2018 to 2033 Figure 7: Industry Analysis and Outlook Value Share (%) and BPS Analysis by Region, 2023 to 2033 Figure 8: Industry Analysis and Outlook Y-o-Y Growth (%) Projections by Region, 2023 to 2033 Figure 9: Industry Analysis and Outlook Value (US$ Million) Analysis by Camera Type, 2018 to 2033 Figure 10: Industry Analysis and Outlook Volume (Units) Analysis by Camera Type, 2018 to 2033 Figure 11: Industry Analysis and Outlook Value Share (%) and BPS Analysis by Camera Type, 2023 to 2033 Figure 12: Industry Analysis and Outlook Y-o-Y Growth (%) Projections by Camera Type, 2023 to 2033 Figure 13: Industry Analysis and Outlook Value (US$ Million) Analysis by Connectivity, 2018 to 2033 Figure 14: Industry Analysis and Outlook Volume (Units) Analysis by Connectivity, 2018 to 2033 Figure 15: Industry Analysis and Outlook Value Share (%) and BPS Analysis by Connectivity, 2023 to 2033 Figure 16: Industry Analysis and Outlook Y-o-Y Growth (%) Projections by Connectivity, 2023 to 2033 Figure 17: Industry Analysis and Outlook Value (US$ Million) Analysis by Sales Channel, 2018 to 2033 Figure 18: Industry Analysis and Outlook Volume (Units) Analysis by Sales Channel, 2018 to 2033 Figure 19: Industry Analysis and Outlook Value Share (%) and BPS Analysis by Sales Channel, 2023 to 2033 Figure 20: Industry Analysis and Outlook Y-o-Y Growth (%) Projections by Sales Channel, 2023 to 2033 Figure 21: Industry Analysis and Outlook Attractiveness by Camera Type, 2023 to 2033 Figure 22: Industry Analysis and Outlook Attractiveness by Connectivity, 2023 to 2033 Figure 23: Industry Analysis and Outlook Attractiveness by Sales Channel, 2023 to 2033 Figure 24: Industry Analysis and Outlook Attractiveness by Region, 2023 to 2033 Figure 25: Kanto Industry Analysis and Outlook Value (US$ Million) by Camera Type, 2023 to 2033 Figure 26: Kanto Industry Analysis and Outlook Value (US$ Million) by Connectivity, 2023 to 2033 Figure 27: Kanto Industry Analysis and Outlook Value (US$ Million) by Sales Channel, 2023 to 2033 Figure 28: Kanto Industry Analysis and Outlook Value (US$ Million) Analysis by Camera Type, 2018 to 2033 Figure 29: Kanto Industry Analysis and Outlook Volume (Units) Analysis by Camera Type, 2018 to 2033 Figure 30: Kanto Industry Analysis and Outlook Value Share (%) and BPS Analysis by Camera Type, 2023 to 2033 Figure 31: Kanto Industry Analysis and Outlook Y-o-Y Growth (%) Projections by Camera Type, 2023 to 2033 Figure 32: Kanto Industry Analysis and Outlook Value (US$ Million) Analysis by Connectivity, 2018 to 2033 Figure 33: Kanto Industry Analysis and Outlook Volume (Units) Analysis by Connectivity, 2018 to 2033 Figure 34: Kanto Industry Analysis and Outlook Value Share (%) and BPS Analysis by Connectivity, 2023 to 2033 Figure 35: Kanto Industry Analysis and Outlook Y-o-Y Growth (%) Projections by Connectivity, 2023 to 2033 Figure 36: Kanto Industry Analysis and Outlook Value (US$ Million) Analysis by Sales Channel, 2018 to 2033 Figure 37: Kanto Industry Analysis and Outlook Volume (Units) Analysis by Sales Channel, 2018 to 2033 Figure 38: Kanto Industry Analysis and Outlook Value Share (%) and BPS Analysis by Sales Channel, 2023 to 2033 Figure 39: Kanto Industry Analysis and Outlook Y-o-Y Growth (%) Projections by Sales Channel, 2023 to 2033 Figure 40: Kanto Industry Analysis and Outlook Attractiveness by Camera Type, 2023 to 2033 Figure 41: Kanto Industry Analysis and Outlook Attractiveness by Connectivity, 2023 to 2033 Figure 42: Kanto Industry Analysis and Outlook Attractiveness by Sales Channel, 2023 to 2033 Figure 43: Chubu Industry Analysis and Outlook Value (US$ Million) by Camera Type, 2023 to 2033 Figure 44: Chubu Industry Analysis and Outlook Value (US$ Million) by Connectivity, 2023 to 2033 Figure 45: Chubu Industry Analysis and Outlook Value (US$ Million) by Sales Channel, 2023 to 2033 Figure 46: Chubu Industry Analysis and Outlook Value (US$ Million) Analysis by Camera Type, 2018 to 2033 Figure 47: Chubu Industry Analysis and Outlook Volume (Units) Analysis by Camera Type, 2018 to 2033 Figure 48: Chubu Industry Analysis and Outlook Value Share (%) and BPS Analysis by Camera Type, 2023 to 2033 Figure 49: Chubu Industry Analysis and Outlook Y-o-Y Growth (%) Projections by Camera Type, 2023 to 2033 Figure 50: Chubu Industry Analysis and Outlook Value (US$ Million) Analysis by Connectivity, 2018 to 2033 Figure 51: Chubu Industry Analysis and Outlook Volume (Units) Analysis by Connectivity, 2018 to 2033 Figure 52: Chubu Industry Analysis and Outlook Value Share (%) and BPS Analysis by Connectivity, 2023 to 2033 Figure 53: Chubu Industry Analysis and Outlook Y-o-Y Growth (%) Projections by Connectivity, 2023 to 2033 Figure 54: Chubu Industry Analysis and Outlook Value (US$ Million) Analysis by Sales Channel, 2018 to 2033 Figure 55: Chubu Industry Analysis and Outlook Volume (Units) Analysis by Sales Channel, 2018 to 2033 Figure 56: Chubu Industry Analysis and Outlook Value Share (%) and BPS Analysis by Sales Channel, 2023 to 2033 Figure 57: Chubu Industry Analysis and Outlook Y-o-Y Growth (%) Projections by Sales Channel, 2023 to 2033 Figure 58: Chubu Industry Analysis and Outlook Attractiveness by Camera Type, 2023 to 2033 Figure 59: Chubu Industry Analysis and Outlook Attractiveness by Connectivity, 2023 to 2033 Figure 60: Chubu Industry Analysis and Outlook Attractiveness by Sales Channel, 2023 to 2033 Figure 61: Kinki Industry Analysis and Outlook Value (US$ Million) by Camera Type, 2023 to 2033 Figure 62: Kinki Industry Analysis and Outlook Value (US$ Million) by Connectivity, 2023 to 2033 Figure 63: Kinki Industry Analysis and Outlook Value (US$ Million) by Sales Channel, 2023 to 2033 Figure 64: Kinki Industry Analysis and Outlook Value (US$ Million) Analysis by Camera Type, 2018 to 2033 Figure 65: Kinki Industry Analysis and Outlook Volume (Units) Analysis by Camera Type, 2018 to 2033 Figure 66: Kinki Industry Analysis and Outlook Value Share (%) and BPS Analysis by Camera Type, 2023 to 2033 Figure 67: Kinki Industry Analysis and Outlook Y-o-Y Growth (%) Projections by Camera Type, 2023 to 2033 Figure 68: Kinki Industry Analysis and Outlook Value (US$ Million) Analysis by Connectivity, 2018 to 2033 Figure 69: Kinki Industry Analysis and Outlook Volume (Units) Analysis by Connectivity, 2018 to 2033 Figure 70: Kinki Industry Analysis and Outlook Value Share (%) and BPS Analysis by Connectivity, 2023 to 2033 Figure 71: Kinki Industry Analysis and Outlook Y-o-Y Growth (%) Projections by Connectivity, 2023 to 2033 Figure 72: Kinki Industry Analysis and Outlook Value (US$ Million) Analysis by Sales Channel, 2018 to 2033 Figure 73: Kinki Industry Analysis and Outlook Volume (Units) Analysis by Sales Channel, 2018 to 2033 Figure 74: Kinki Industry Analysis and Outlook Value Share (%) and BPS Analysis by Sales Channel, 2023 to 2033 Figure 75: Kinki Industry Analysis and Outlook Y-o-Y Growth (%) Projections by Sales Channel, 2023 to 2033 Figure 76: Kinki Industry Analysis and Outlook Attractiveness by Camera Type, 2023 to 2033 Figure 77: Kinki Industry Analysis and Outlook Attractiveness by Connectivity, 2023 to 2033 Figure 78: Kinki Industry Analysis and Outlook Attractiveness by Sales Channel, 2023 to 2033 Figure 79: Kyushu & Okinawa Industry Analysis and Outlook Value (US$ Million) by Camera Type, 2023 to 2033 Figure 80: Kyushu & Okinawa Industry Analysis and Outlook Value (US$ Million) by Connectivity, 2023 to 2033 Figure 81: Kyushu & Okinawa Industry Analysis and Outlook Value (US$ Million) by Sales Channel, 2023 to 2033 Figure 82: Kyushu & Okinawa Industry Analysis and Outlook Value (US$ Million) Analysis by Camera Type, 2018 to 2033 Figure 83: Kyushu & Okinawa Industry Analysis and Outlook Volume (Units) Analysis by Camera Type, 2018 to 2033 Figure 84: Kyushu & Okinawa Industry Analysis and Outlook Value Share (%) and BPS Analysis by Camera Type, 2023 to 2033 Figure 85: Kyushu & Okinawa Industry Analysis and Outlook Y-o-Y Growth (%) Projections by Camera Type, 2023 to 2033 Figure 86: Kyushu & Okinawa Industry Analysis and Outlook Value (US$ Million) Analysis by Connectivity, 2018 to 2033 Figure 87: Kyushu & Okinawa Industry Analysis and Outlook Volume (Units) Analysis by Connectivity, 2018 to 2033 Figure 88: Kyushu & Okinawa Industry Analysis and Outlook Value Share (%) and BPS Analysis by Connectivity, 2023 to 2033 Figure 89: Kyushu & Okinawa Industry Analysis and Outlook Y-o-Y Growth (%) Projections by Connectivity, 2023 to 2033 Figure 90: Kyushu & Okinawa Industry Analysis and Outlook Value (US$ Million) Analysis by Sales Channel, 2018 to 2033 Figure 91: Kyushu & Okinawa Industry Analysis and Outlook Volume (Units) Analysis by Sales Channel, 2018 to 2033 Figure 92: Kyushu & Okinawa Industry Analysis and Outlook Value Share (%) and BPS Analysis by Sales Channel, 2023 to 2033 Figure 93: Kyushu & Okinawa Industry Analysis and Outlook Y-o-Y Growth (%) Projections by Sales Channel, 2023 to 2033 Figure 94: Kyushu & Okinawa Industry Analysis and Outlook Attractiveness by Camera Type, 2023 to 2033 Figure 95: Kyushu & Okinawa Industry Analysis and Outlook Attractiveness by Connectivity, 2023 to 2033 Figure 96: Kyushu & Okinawa Industry Analysis and Outlook Attractiveness by Sales Channel, 2023 to 2033 Figure 97: Tohoku Industry Analysis and Outlook Value (US$ Million) by Camera Type, 2023 to 2033 Figure 98: Tohoku Industry Analysis and Outlook Value (US$ Million) by Connectivity, 2023 to 2033 Figure 99: Tohoku Industry Analysis and Outlook Value (US$ Million) by Sales Channel, 2023 to 2033 Figure 100: Tohoku Industry Analysis and Outlook Value (US$ Million) Analysis by Camera Type, 2018 to 2033 Figure 101: Tohoku Industry Analysis and Outlook Volume (Units) Analysis by Camera Type, 2018 to 2033 Figure 102: Tohoku Industry Analysis and Outlook Value Share (%) and BPS Analysis by Camera Type, 2023 to 2033 Figure 103: Tohoku Industry Analysis and Outlook Y-o-Y Growth (%) Projections by Camera Type, 2023 to 2033 Figure 104: Tohoku Industry Analysis and Outlook Value (US$ Million) Analysis by Connectivity, 2018 to 2033 Figure 105: Tohoku Industry Analysis and Outlook Volume (Units) Analysis by Connectivity, 2018 to 2033 Figure 106: Tohoku Industry Analysis and Outlook Value Share (%) and BPS Analysis by Connectivity, 2023 to 2033 Figure 107: Tohoku Industry Analysis and Outlook Y-o-Y Growth (%) Projections by Connectivity, 2023 to 2033 Figure 108: Tohoku Industry Analysis and Outlook Value (US$ Million) Analysis by Sales Channel, 2018 to 2033 Figure 109: Tohoku Industry Analysis and Outlook Volume (Units) Analysis by Sales Channel, 2018 to 2033 Figure 110: Tohoku Industry Analysis and Outlook Value Share (%) and BPS Analysis by Sales Channel, 2023 to 2033 Figure 111: Tohoku Industry Analysis and Outlook Y-o-Y Growth (%) Projections by Sales Channel, 2023 to 2033 Figure 112: Tohoku Industry Analysis and Outlook Attractiveness by Camera Type, 2023 to 2033 Figure 113: Tohoku Industry Analysis and Outlook Attractiveness by Connectivity, 2023 to 2033 Figure 114: Tohoku Industry Analysis and Outlook Attractiveness by Sales Channel, 2023 to 2033 Figure 115: Rest of Industry Analysis and Outlook Value (US$ Million) by Camera Type, 2023 to 2033 Figure 116: Rest of Industry Analysis and Outlook Value (US$ Million) by Connectivity, 2023 to 2033 Figure 117: Rest of Industry Analysis and Outlook Value (US$ Million) by Sales Channel, 2023 to 2033 Figure 118: Rest of Industry Analysis and Outlook Value (US$ Million) Analysis by Camera Type, 2018 to 2033 Figure 119: Rest of Industry Analysis and Outlook Volume (Units) Analysis by Camera Type, 2018 to 2033 Figure 120: Rest of Industry Analysis and Outlook Value Share (%) and BPS Analysis by Camera Type, 2023 to 2033 Figure 121: Rest of Industry Analysis and Outlook Y-o-Y Growth (%) Projections by Camera Type, 2023 to 2033 Figure 122: Rest of Industry Analysis and Outlook Value (US$ Million) Analysis by Connectivity, 2018 to 2033 Figure 123: Rest of Industry Analysis and Outlook Volume (Units) Analysis by Connectivity, 2018 to 2033 Figure 124: Rest of Industry Analysis and Outlook Value Share (%) and BPS Analysis by Connectivity, 2023 to 2033 Figure 125: Rest of Industry Analysis and Outlook Y-o-Y Growth (%) Projections by Connectivity, 2023 to 2033 Figure 126: Rest of Industry Analysis and Outlook Value (US$ Million) Analysis by Sales Channel, 2018 to 2033 Figure 127: Rest of Industry Analysis and Outlook Volume (Units) Analysis by Sales Channel, 2018 to 2033 Figure 128: Rest of Industry Analysis and Outlook Value Share (%) and BPS Analysis by Sales Channel, 2023 to 2033 Figure 129: Rest of Industry Analysis and Outlook Y-o-Y Growth (%) Projections by Sales Channel, 2023 to 2033 Figure 130: Rest of Industry Analysis and Outlook Attractiveness by Camera Type, 2023 to 2033 Figure 131: Rest of Industry Analysis and Outlook Attractiveness by Connectivity, 2023 to 2033 Figure 132: Rest of Industry Analysis and Outlook Attractiveness by Sales Channel, 2023 to 2033
Recommendations
Explore Technology Insights
View Reports