

- Market Size (2026)
- USD 420.7 Mn
- Forecast (2036)
- USD 1587.2 Mn
- CAGR (2026 to 2036)
- 14.2%
How big is the Elastane Separation Chemicals Market in 2026?
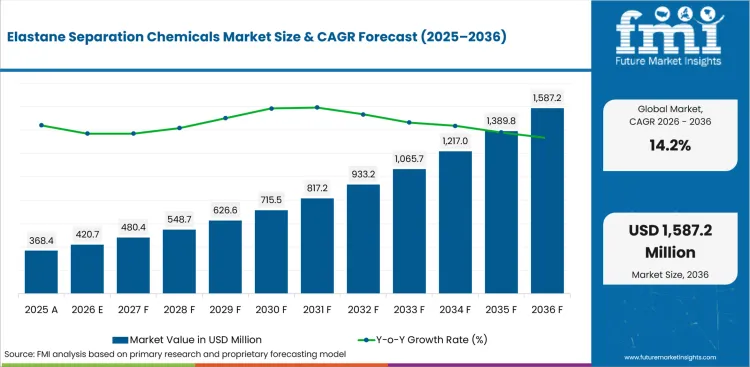
USD 420.7 million in 2026 and USD 1,587.2 million by 2036 at a 14.2% CAGR.
The elastane separation chemicals demand is moving from laboratory recipe work toward plant qualification. Textile recyclers use solvent-based separators and surfactant blends to remove stretch fibers before polyester or cotton recovery. Press Information Bureau reported India generates 70.73 lakh tonnes of textile waste each year, giving chemical recovery projects a clear feedstock base.
Recycling system design rewards chemistry able to handle dyes and variable stretch loadings. EU countries began separate textile collection from 2025, sending more mixed apparel into formal sorting streams. Solvent recovery and recovered polymer purity now guide supplier approval in commercial textile recovery programs.
Buyers compare elastane separation chemicals through yield and downstream fiber acceptance. WRAP reported reuse and recycling organizations handled 210,000 tonnes of used textiles in 2024. Commercial approvals rest on proof that elastane removal can protect recovered polyester or nylon across mixed garment lots.
| Metric | Value |
|---|---|
| 2025 Market Size | USD 368.4 million |
| 2026 Market Size | USD 420.7 million |
| 2036 Market Size | USD 1,587.2 million |
| Forecast CAGR (2026-2036) | 14.2% |
| Process Focus | Dissolution Separation |
| Dissolution Separation Share (2026) | 52.0% |
| Sales Model Focus | Process Bundle |
| Process Bundle Share (2026) | 47.0% |
| Feedstock Focus | Polyester-Elastane Blends |
| Polyester-Elastane Blends Share (2026) | 46.0% |
| Fastest-growing Country | India |
| India CAGR by 2036 | 15.8% |
Summary of the Elastane Separation Chemicals Market
| Market Signal | Commercial Impact |
|---|---|
| Demand and Growth Drivers | Elastane separation chemical demand is increasing as textile recyclers prepare stretch-rich apparel for cleaner fiber recovery.
|
| Product and Segment View | Segment demand is led by solvent-based chemistry and polyester-elastane feedstock requiring repeatable pre-treatment.
|
| Geography and Growth Outlook | Regional demand is led by countries with textile waste scale and active recovery programs.
|
| Competitive Landscape | Competition focuses on elastane removal performance and validation of recovered fibers for downstream textile use.
|
| Analyst Perspective | Elastane separation chemicals are developing into a process-qualification market linked to textile-to-textile recycling and mixed-garment recovery.
- Nikhil Kaitwade, Principal Consultant for Chemicals and Materials at Future Market Insights |
How is the elastane separation chemicals market segmented?
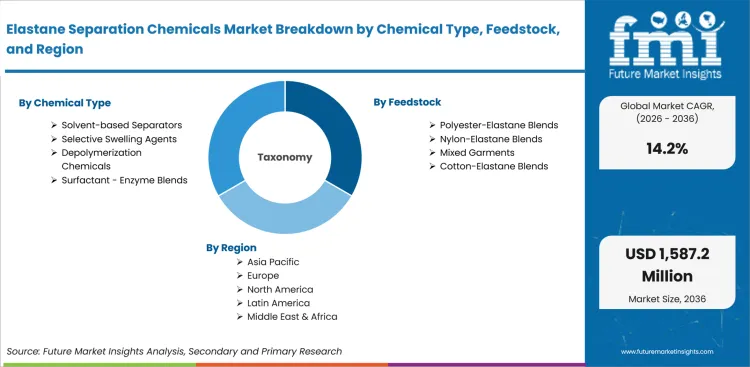
The elastane separation chemicals industry is segmented by chemical type, feedstock, process, end use, sales model and region.
The elastane separation chemicals market is segmented by chemical type, feedstock, process, end use, sales model and region. By chemical type, coverage includes Solvent-based Separators, Selective Swelling Agents, Depolymerization Chemicals and Surfactant / Enzyme Blends. By feedstock, coverage includes Cotton-Elastane Blends, Polyester-Elastane Blends, Nylon-Elastane Blends and Mixed Garments. By process, coverage includes Dissolution Separation, Chemical Cleavage, Mechanical-Chemical Hybrid and Pilot / R&D. By end use, coverage includes Textile Recyclers, Fiber Producers, Brand Take-back Programs and R&D Institutes. By sales model, coverage includes Chemical Supply, Process Bundle and Toll Treatment, with regional coverage across North America, Latin America, Western Europe, Eastern Europe, East Asia, South Asia and Pacific and Middle East and Africa.
Why do solvent-based separators lead within the chemical type segment?
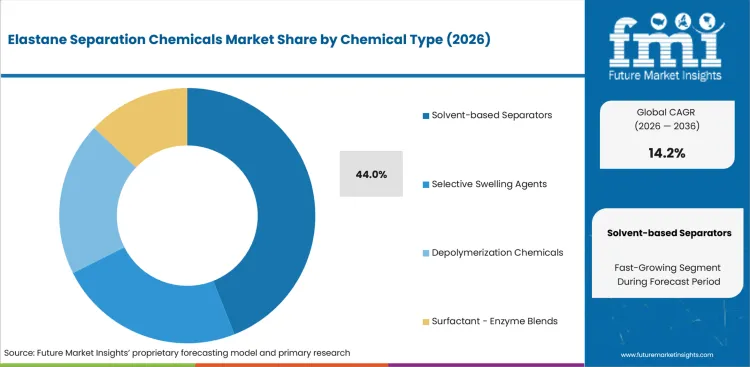
Solvent-based separators lead through controlled swelling and selective elastane removal. Recyclers use these products once polyester or nylon recovery value must be protected during blend processing. Institute of Materials, Minerals and Mining reported in February 2024 that researchers tested 6 organic solvents for elastane dissolution, with dimethyl sulfoxide selected as the preferred option. Formal textile recovery work therefore makes solvent choice central to supplier selection.
- Solvent-based separators are expected to account for 44.0% share in 2026, reflected by demand for controlled elastane removal in polyester-elastane and nylon-elastane streams. Buyers prefer products supporting output purity without raising solvent loss during repeated batches.
- Selective swelling agents remain useful for targeted separation work. Solvent-based systems gain selection attention once recyclers compare recovery yield and wastewater load during commercial trials.
What supports demand for polyester-elastane blend applications?
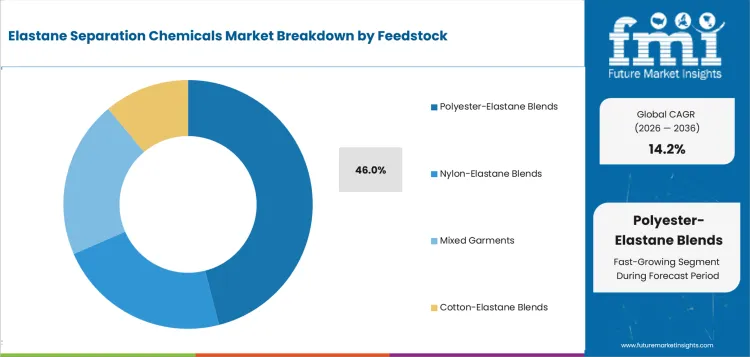
Polyester-elastane blends create the main feedstock pool for separation chemistry. Sportswear and stretch apparel contain synthetic fiber blends resisting simple mechanical recycling. Textile Exchange reported in September 2025, polyester fiber production reached around 78 million tonnes in 2024 and represented 59.0% of global fiber output. Brand take-back programs need chemistry able to prepare polyester-rich garments before regeneration.
- Polyester-elastane blends are anticipated to hold 46.0% share in 2026, led by apparel streams requiring elastane removal before polyester recovery. Suppliers gain approval once chemistry protects polymer value and handles dyes or finishing residues.
- Cotton-elastane blends support a separate demand route in apparel recovery. Polyester-elastane Blends receive more process attention as recycled polyester programs need cleaner synthetic outputs for yarn or fiber qualification.
How do buyers evaluate dissolution separation within process?
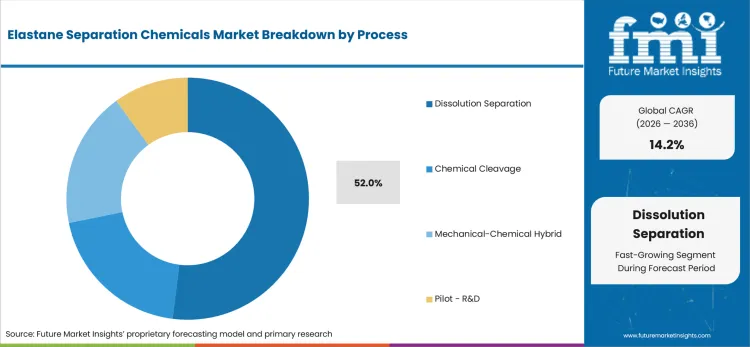
Dissolution separation demand reflects the need to isolate elastane without destroying target polymer chains. Plant teams assess solvent selectivity and output acceptance before selecting a route. A 2025 waste management study reported complete PET dissolution within 5 minutes using hydrophobic deep eutectic solvents for polyester-cotton blend recycling. Recycling operators favor methods supporting repeatable blend handling across mixed garment inputs.
- Dissolution separation is projected to represent 52.0% share in 2026, supported by buyers seeking selective polymer handling before deeper depolymerization. Recyclers use dissolution routes to protect polyester or nylon recovery value during plant validation.
- Chemical cleavage remains useful for deeper depolymerization needs. Dissolution separation gains earlier adoption once recyclers prioritize polymer preservation and lower residue burden in early commercial lines.
How do textile recyclers shape the end use segment?
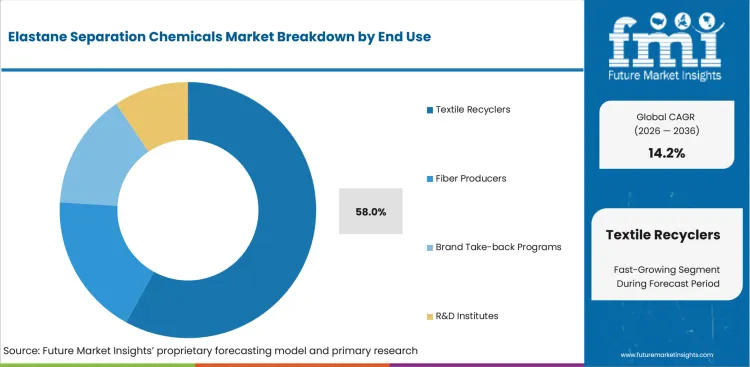
Textile recyclers form the main end-use demand pool since elastane removal occurs before fiber producers can accept recovered outputs. Plant operators manage sorting and downstream quality checks. VITO reported in June 2025 that Europe generates nearly 7.5 million tons of textile waste annually, while only 30-35% is collected and less than 1.0% is recycled into new products. Supplier selection often begins with recycler trials before brand or fiber producer approval follows.
- Textile recyclers are anticipated to represent 58.0% share in 2026, backed by pre-treatment decisions inside blend-processing facilities. Operators buy separation chemicals directly once feedstock variability affects yield and output acceptance.
- Fiber producers remain important downstream buyers of recovered materials. Textile recyclers hold early influence as chemical selection starts before recovered polymer enters compounding or fiber conversion.
How is process bundle positioned within the sales-model segment?
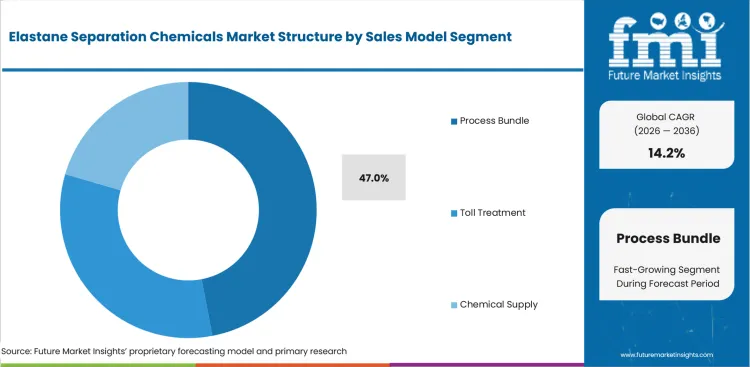
Process bundle sourcing is central to elastane separation chemical buying as buyers need chemicals with operating recipes and troubleshooting support. Commercial plants cannot treat elastane removal as a simple chemical purchase once solvents and wastewater influence plant economics. Reju reported in May 2025, its industrial regeneration hub targets the equivalent of 300 million articles annually and 50,000 tonnes of rBHET output each year. Process bundle suppliers gain value once recycling plants need chemistry support linked with operating performance.
- Process bundle is expected to capture 47.0% share in 2026, driven by buyer need for chemistry and recovery support together. Suppliers gain commercial value by helping plants adjust dosage and improve solvent reuse.
- Chemical supply remains suitable for experienced recyclers with internal process teams. Process Bundle gains preference among pilot and early commercial facilities requiring supplier support while handling variable garment inputs.
What are the drivers, restraints, and opportunities in the Elastane Separation Chemicals Market?
Near-term purchases are shaped by textile recovery rules and plant-scale chemistry needs outlined below.
- Driver: Textile-to-textile recycling programs need elastane-tolerant chemistry before polyester and nylon recovery can scale.
- Restraint: Feedstock variability raises treatment cost as dyes and elastane levels can reduce batch repeatability.
- Opportunity: Process bundles can expand as recyclers seek solvent recovery support and output qualification assistance.
Formal textile collection supports elastane removal as a compliance-linked processing step. European Parliament reported in September 2025 that the EU generates 12.6 million tonnes of textile waste each year, including 5.2 million tonnes from clothing and footwear. Separate collection rules from 2025 send more garments into formal sorting streams. Higher collection volume does not directly create usable feedstock, since stretch-rich garments still need chemistry separating elastane without damaging polyester or cotton recovery.
Plant economics remain constrained by solvent loss and inconsistent garment composition. Refashion reported 289,393 tonnes of used textiles and footwear collected in France in 2024. Separation chemical suppliers must prove that improved output quality justifies treatment costs for mixed apparel bales.
Process support creates a stronger supplier route as buyers move from pilots into commercial lines. Worn Again Technologies reported its 2026 Accelerator plant can recover more than 95% of solvents during textile recycling validation. Vendors can benefit once process bundles help turn sorted streams into fiber-ready recovered outputs.
Which country CAGRs are profiled in the Elastane Separation Chemicals Market?
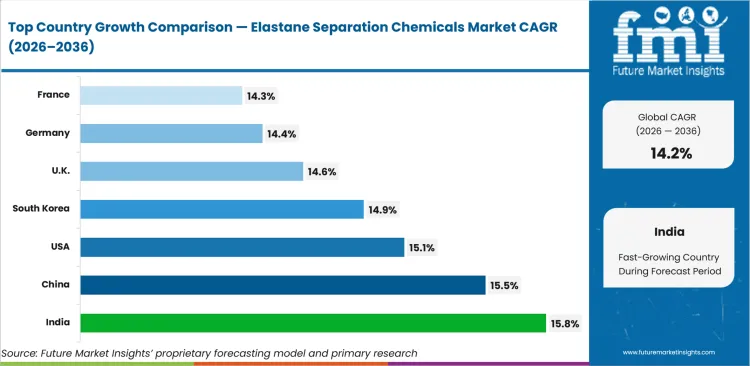
| Country | CAGR |
|---|---|
| India | 15.8% |
| China | 15.5% |
| United States | 15.1% |
| South Korea | 14.9% |
| United Kingdom | 14.6% |
| Germany | 14.4% |
| France | 14.3% |
| Japan | 13.8% |
Source: Future Market Insights analysis, 2026.
How do country-level CAGRs compare in the elastane separation chemicals market?
Country CAGR profiles in the elastane separation chemicals market reflect synthetic fiber depth and recycling system readiness. India and China show rapid adoption led by mapped waste streams and polyester-rich textile processing. The United States and South Korea are in a high-growth adoption band shaped by policy-linked recovery planning and textile recycling pilots. The United Kingdom, Germany and France show steadier collection-led demand through formal textile recovery systems. Japan reflects a careful resource-circulation cycle guided by disposal pressure and evidence-led material recovery programs.
- By 2036, India is projected to grow at 15.8% CAGR as textile waste mapping supports structured recovery routes. Press Information Bureau reported India generates 70.73 lakh tonnes of textile waste annually, with 42% from pre-consumer sources and 58% from post-consumer disposal. Separation chemistry is expected to support stretch-rich apparel processing before recovered polyester and cotton enter fiber trials. Process-bundle suppliers are likely to receive stronger interest from recyclers needing solvent reuse and residue control support.
- China’s demand outlook is anticipated to advance at 15.5% CAGR over the assessment period, supported by synthetic fiber scale and polyester-rich garment recovery needs. National Bureau of Statistics reported chemical fiber output reached 79.11 million tonnes in 2024, increasing 9.7% from the prior year. Textile recyclers are expected to prioritize solvent systems that prepare polyester-elastane streams before regeneration. Companies offering local process assistance are positioned to support plant qualification across synthetic blend recovery programs.
- The United States is forecast to rise at 15.1% CAGR over the forecast period, supported by textile disposal pressure and policy-linked recovery planning. CalRecycle reported Californians throw away 1.2 million tons of textiles each year, equal to 3% of landfill disposal. Apparel recovery programs are expected to need elastane removal before recovered polyester enters yarn or fabric qualification. Vendors with mixed-garment processing knowledge are likely to support recycling programs facing variable feedstock quality.
- South Korea is estimated to post 14.9% CAGR over the forecast period, supported by textile recycling pilots and synthetic blend recovery needs. Ministry of Environment reported in September 2025 that waste fabric scraps once incinerated or landfilled were being recycled through a business agreement involving 4 parties. Chemical preparation routes are expected to help recyclers manage synthetic blend residues before material reuse. Fiber-focused companies are likely to prioritize residue control and recovered material acceptance during program validation.
- The United Kingdom outlook is projected to record 14.6% CAGR over the assessment period, driven by used textile handling and circularity programs. WRAP reported reuse and recycling organizations handled 210,000 tonnes of used textiles in 2024. Chemical routes are expected to gain attention for garments unsuitable for direct resale. Technology providers can support polyester-focused recycling lines by reducing residue risk during elastane removal.
- Adoption in Germany is estimated to post 14.4% CAGR over the forecast period, supported by textile recovery depth and synthetic blend processing needs. Germany’s circular economy strategy reported nearly 19 kilograms of textiles are consumed per person each year, amounting to 1.56 million tonnes of textile consumption. Around 1 million tonnes are collected as waste textiles each year. Separation chemistry is expected to improve polymer recovery from polyester-elastane garments once sorting systems direct more material into recycling channels.
- France is projected to grow at 14.3% CAGR through 2036, reinforced by organized textile collection and EPR-linked recovery systems. Refashion reported 3.5 billion clothing and footwear items were placed on the French market in 2024. Large textile circulation is expected to create recovery pressure across collection and sorting systems. Suppliers combining elastane removal and output-quality support are likely to receive stronger consideration from recyclers.
- In Japan, elastane separation chemicals demand is predicted to advance at 13.8% CAGR over the forecast period, guided by resource-circulation planning and textile disposal pressure. Japan’s Environment Ministry estimated 820,000 tonnes of new clothing supply in 2024, while 560,000 tonnes of clothing were incinerated or sent to landfills. Chemical separation is expected to support blended garment recovery beyond resale and low-value disposal routes. Evidence-led suppliers can support recycled textile programs needing cleaner polyester and cotton recovery.
Who are the notable companies in the Elastane Separation Chemicals Market?
Worn Again Technologies, Circ, Ambercycle, Reju, Syre, Eastman, The LYCRA Company, CARBIOS, Selenis, Birla Cellulose, Hyosung TNC and Marubeni are the notable companies shaping elastane separation chemicals and textile-to-textile recovery pathways.
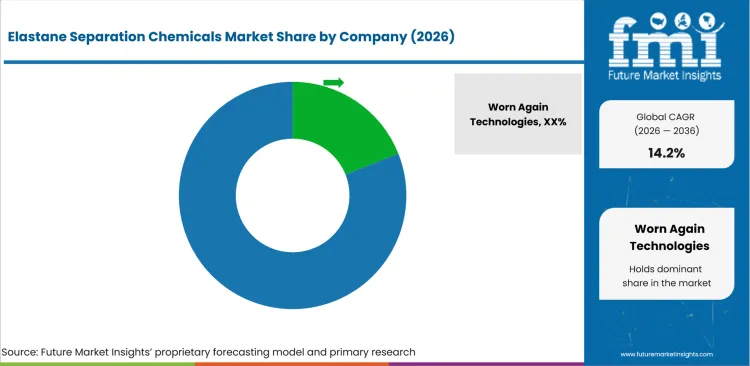
Competition in the elastane separation chemicals market is grouped by how recyclers want mixed-garment proof to work. Worn Again Technologies and Circ are stronger when textile recycling process evidence guides buyer confidence. Ambercycle, Reju and Syre are important for recycled polyester pathways and output qualification. Eastman, CARBIOS and Selenis add polymer renewal and regeneration chemistry depth. The LYCRA Company, Birla Cellulose, Hyosung TNC and Marubeni support fiber-chain validation and brand-linked material adoption.
- Worn Again Technologies has an advantage led by mixed-fiber textile recycling process depth. Recyclers can connect supplier technology with elastane handling and recovered fiber quality during plant qualification.
- Circ supports buyer review based on textile-to-textile recovery and blended-garment processing references. Its work helps recyclers assess how chemical routes can support cotton and polyester recovery.
- Ambercycle, Reju and Syre strengthen competition depending on recycled polyester pathways and offtake support. Apparel programs use such capabilities when output consistency and brand qualification affect adoption speed.
- Eastman, CARBIOS, Selenis and fiber-chain suppliers compete due to polymer recovery and material validation depth. Buyers compare these companies across fiber conversion support and textile program continuity.
Competitive Benchmarking: Elastane Separation Chemicals Market
| Company | Elastane Separation Depth | Solvent Recovery Capability | Textile-to-Fiber Validation | Geographic Reach |
|---|---|---|---|---|
| Worn Again Technologies | High | High | Strong | Europe and UK-linked markets |
| Circ | Medium | Strong | Strong | North America and Asia |
| Ambercycle | Medium | Strong | Strong | North America and Asia |
| Reju | Medium | High | Strong | Europe and North America |
| Syre | Medium | Medium | Strong | North America and planned international sites |
| Eastman | Medium | High | Medium | North America and Europe |
| The LYCRA Company | High | Medium | Medium | Global |
| CARBIOS | Low | High | Medium | Europe |
| Selenis | Low | Medium | Medium | North America and Europe |
| Birla Cellulose | Low | Medium | Strong | India and global markets |
Source: Future Market Insights competitive analysis, 2026.
Key Developments in the Elastane Separation Chemicals Market
- In March 2026, Worn Again Technologies unveiled its Accelerator plant in Switzerland. The platform handles complex materials including dyes and elastane while recovering more than 95% of solvents during textile recycling validation.
- In February 2026, Reju selected Lacq in France for an industrial textile regeneration hub. The project supports post-consumer textile conversion into recycled polyester and creates a European demand route for pre-treatment chemistry before polyester regeneration.
- In October 2025, Selenis and Syre formed a partnership to establish a textile-to-textile recycling plant in North Carolina. The plant blueprint targets up to 10,000 metric tonnes of circular polyester, strengthening demand for blend preparation and elastane control before output qualification.
Key Players in the Elastane Separation Chemicals Market
Process Technology Specialists
- Worn Again Technologies
- Circ
- Ambercycle
- Reju
- Syre
Polyester Regeneration Platforms
- Eastman
- CARBIOS
- Selenis
Fiber and Apparel Chain Partners
- The LYCRA Company
- Hyosung TNC
- Birla Cellulose
- Marubeni
Elastane Separation Chemicals Market - Report Scope
| Coverage field | Report scope |
|---|---|
| Market breakdown | Elastane Separation Chemicals Market Breakdown By Chemical Type, Feedstock, Process, End Use, Sales Model and Region |
| Market Definition | Chemicals used to separate elastane from textile blends before fiber recovery, polymer regeneration or recycled fiber production |
| Regions Covered | North America, Latin America, Western Europe, Eastern Europe, East Asia, South Asia and Pacific, Middle East and Africa |
| Countries Covered | United States, United Kingdom, Germany, France, Japan, China, South Korea, India and 30+ countries |
| Key Companies Profiled | Worn Again Technologies, Circ, Ambercycle, Reju, Syre, Eastman, The LYCRA Company, CARBIOS, Selenis, Birla Cellulose, Hyosung TNC, Marubeni |
| Forecast Period | 2026 to 2036 |
| Approach | Hybrid bottom-up and top-down methodology using chemical use rates, feedstock volumes, process adoption, textile collection indicators, recycling project pipelines and country-level recovery readiness |
Source: Future Market Insights analysis, 2026.
Elastane Separation Chemicals Market - Research Methodology
| Method | Approach |
|---|---|
| Primary Research | FMI analysts reviewed inputs from textile recyclers, fiber producers, brand take-back teams, chemical formulators, sorting operators, technology developers and technical consultants involved in mixed-fiber recycling. Discussions focused on feedstock acceptance, solvent recovery, residue control, elastane removal consistency and commercial qualification barriers. |
| Desk Research | Desk research covered textile waste rules, collection data, company announcements, recycling project disclosures, technical literature and fiber recovery pathways. Product coverage was checked against chemical type, feedstock, process route, end-use buyer and sales-model application. |
| Market Sizing and Forecasting | Model design combined chemical consumption per tonne of processed blend, pilot-to-commercial conversion rates, chemical pricing, textile waste collection signals, recycling project pipelines and country adoption patterns. Forecast assumptions were adjusted for textile recovery infrastructure, brand offtake plans and process bundle adoption. |
| Data Validation | Forecasts were checked against textile waste volumes, sorting-system activity, recycling project announcements, company developments and adjacent recycled polyester indicators. Internal validation focused on whether elastane removal is a gating step in commercial textile-to-textile recycling. |
Elastane Separation Chemicals Market by Segments
Elastane Separation Chemicals Market segmented by Chemical Type:
- Solvent-based Separators
- Selective Swelling Agents
- Depolymerization Chemicals
- Surfactant / Enzyme Blends
Elastane Separation Chemicals Market segmented by Feedstock:
- Cotton-Elastane Blends
- Polyester-Elastane Blends
- Nylon-Elastane Blends
- Mixed Garments
Elastane Separation Chemicals Market segmented by Process:
- Dissolution Separation
- Chemical Cleavage
- Mechanical-Chemical Hybrid
- Pilot / R&D
Elastane Separation Chemicals Market segmented by End Use:
- Textile Recyclers
- Fiber Producers
- Brand Take-back Programs
- R&D Institutes
Elastane Separation Chemicals Market segmented by Sales Model:
- Chemical Supply
- Process Bundle
- Toll Treatment
Elastane Separation Chemicals Market by Region:
- North America
- United States
- Canada
- Mexico
- Latin America
- Brazil
- Chile
- Rest of Latin America
- Western Europe
- Germany
- UK
- Italy
- Spain
- France
- Nordic
- BENELUX
- Rest of Western Europe
- Eastern Europe
- Russia
- Poland
- Hungary
- Balkan & Baltic
- Rest of Eastern Europe
- East Asia
- China
- Japan
- South Korea
- South Asia and Pacific
- India
- ASEAN
- Australia & New Zealand
- Rest of South Asia and Pacific
- Middle East & Africa
- Kingdom of Saudi Arabia
- Other GCC Countries
- Turkiye
- South Africa
- Other African Union
- Rest of Middle East & Africa
Research Sources and Bibliography
- California Department of Resources Recycling and Recovery. (2026). Textiles. California Department of Resources Recycling and Recovery.
- Eastman. (2024, April 17). Eastman collaborates with Debrand to recycle apparel waste from top brands. Eastman.
- European Environment Agency. (2024, May 21). Management of used and waste textiles in Europe’s circular economy. European Environment Agency.
- European Parliament. (2025, September 9). Parliament adopts new EU rules to reduce textile and food waste. European Parliament.
- Institute of Materials, Minerals and Mining. (2024, February 13). Elastane recycling in sight. Institute of Materials, Minerals and Mining.
- Ministry of Environment, Republic of Korea. (2025, September 9). Waste fabric scraps once incinerated or landfilled are now recycled. Ministry of Environment, Republic of Korea.
- Ministry of Textiles. (2026, March 10). India generates 70.73 lakh tonnes of textile waste annually. Press Information Bureau.
- National Bureau of Statistics of China. (2025, February 28). Statistical communiqué of the People’s Republic of China on the 2024 national economic and social development. National Bureau of Statistics of China.
- National Circular Economy Strategy. (2025). Clothing and textiles. Federal Ministry for the Environment, Nature Conservation, Nuclear Safety and Consumer Protection.
- Refashion. (2025, June 26). Refashion 2024 activity report. Refashion.
- Reju. (2025, May 20). Reju announces the selection of Regeneration Hub One, its first industrial-size textile-to-textile regeneration center, in the Netherlands. Reju.
- Reju. (2026, February 12). Reju announces site selection for French Regeneration Hub in Lacq advancing Europe’s circular textile infrastructure. Reju.
- Selenis. (2025, October). Selenis and Syre form a strategic partnership to establish a textile-to-textile recycling plant in North Carolina. Selenis.
- Textile Exchange. (2025, September 18). Materials market report 2025. Textile Exchange.
- VITO. (2025, June 24). Recyclex advances chemical textile recycling: Novel methods for elastane detection and removal. VITO.
- Worn Again Technologies. (2026, March 6). Worn Again Technologies unveils the Accelerator. Worn Again Technologies.
- WRAP. (2025, October 28). UK Textiles Pact annual progress update 2024-25. WRAP.
This bibliography is provided for reader reference and is not exhaustive. The full report contains the complete reference list and detailed citations.
This Report Answers
- What is the expected global value of the elastane separation chemicals market in 2026 and 2036?
- What CAGR is forecast for elastane separation chemicals during the 2026 to 2036 period?
- Which chemical type segment is used to assess solvent-based separators demand in 2026?
- Why do textile recyclers buy elastane separation chemicals with solvent recovery support?
- How do polyester-elastane blends and dissolution separation shape recycling choices?
- Which countries are compared in the elastane separation chemicals market forecast?
- Which companies compete across elastane separation chemistry and textile recovery pathways?
- What chemical systems and applications are included within the elastane separation chemicals market definition?
- How does FMI size and forecast elastane separation chemical demand across segments and countries?
- What implementation and supplier-selection factors should executives assess?
Frequently Asked Questions
What is driving growth in the elastane separation chemicals market?
Growth is driven by formal textile collection rules and the need to remove elastane before polyester or cotton recovery.
Why should executives track the elastane separation chemicals market?
Executives should track elastane separation chemical demand since elastane removal affects recycled fiber yield and commercial plant economics.
What business problem does the elastane separation chemicals market address?
Elastane separation chemicals help recyclers remove stretch fibers that can contaminate recovered nylon or cotton outputs.
What should sourcing leaders evaluate before selecting suppliers?
Sourcing leaders should compare solvent recovery and downstream fiber acceptance before supplier approval.
What can limit return on investment for buyers?
Return on investment can be delayed if chemicals perform well on clean samples but fail with dyed garments or variable elastane levels.
How can suppliers build executive confidence?
Suppliers build confidence through documented solvent recovery and engineering accountability during scale-up.
Preview the report firsthand - request a free sample
Get SampleGet the brochure for pricing and purchase details.
Get PDFTable of Content
- Key Takeaways
- Market Size and CAGR
- Top Growth Driver
- Fastest Growing Segment
- Leading Region
- Key Companies
- Emerging Opportunities
- Executive Summary
- Global Market Outlook
- Demand-side Trends
- Supply-side Trends
- Technology Roadmap Analysis
- Analysis and Recommendations
- Analyst Perspective (What is happening? Why now? What should investors know?)
- Key Questions Answered
- How large is the market?
- What is the CAGR?
- What are key trends?
- Which region dominates?
- Who are the leaders?
- Market Overview
- Market Coverage / Taxonomy
- Market Definition / Scope / Limitations
- Research Methodology
- Chapter Orientation
- Analytical Lens and Working Hypotheses
- Market Structure, Signals, and Trend Drivers
- Benchmarking and Cross-market Comparability
- Market Sizing, Forecasting, and Opportunity Mapping
- Research Design and Evidence Framework
- Desk Research Programme (Secondary Evidence)
- Expert Input and Fieldwork (Primary Evidence)
- Tooling, Models, and Reference Databases
- Data Engineering and Model Build
- Quality Assurance and Audit Trail
- Market Background
- Market Dynamics (Drivers, Restraints, Opportunity, Trends)
- Scenario Forecast (Optimistic, Likely, Conservative)
- Impact Analysis
- AI Impact
- Sustainability Impact
- Regulatory Impact
- Technology Impact
- Consumer / Buyer Analysis
- Purchase Drivers
- Adoption Barriers
- Buyer Journey
- Opportunity Map Analysis
- Product Life Cycle Analysis
- Supply Chain Analysis
- Investment Feasibility Matrix
- Value Chain Analysis
- PESTLE and Porter's Analysis
- Regulatory Landscape
- Regional Parent Market Outlook
- Production and Consumption Statistics
- Import and Export Statistics
- Global Market Analysis and Forecast, 2021 to 2036
- Historical Market Size Value (USD Million) & Volume (Unit) Analysis, 2021 to 2025
- Current and Future Market Size Value (USD Million) & Volume (Unit) Projections, 2026 to 2036
- Y-o-Y Growth Trend Analysis
- Absolute $ Opportunity Analysis
- Global Market Pricing Analysis, 2021 to 2036
- Global Market Analysis and Forecast, By Chemical Type, 2021 to 2036
- Introduction / Key Findings
- Historical Market Size Value (USD Million) & Volume (Unit) Analysis By Chemical Type, 2021 to 2025
- Current and Future Market Size Value (USD Million) & Volume (Unit) Analysis and Forecast By Chemical Type, 2026 to 2036
- Solvent-based Separators
- Selective Swelling Agents
- Depolymerization Chemicals
- Surfactant - Enzyme Blends
- Solvent-based Separators
- Y-o-Y Growth Trend Analysis By Chemical Type, 2021 to 2025
- Absolute $ Opportunity Analysis By Chemical Type, 2026 to 2036
- Global Market Analysis and Forecast, By Feedstock, 2021 to 2036
- Introduction / Key Findings
- Historical Market Size Value (USD Million) & Volume (Unit) Analysis By Feedstock, 2021 to 2025
- Current and Future Market Size Value (USD Million) & Volume (Unit) Analysis and Forecast By Feedstock, 2026 to 2036
- Polyester-Elastane Blends
- Nylon-Elastane Blends
- Mixed Garments
- Cotton-Elastane Blends
- Polyester-Elastane Blends
- Y-o-Y Growth Trend Analysis By Feedstock, 2021 to 2025
- Absolute $ Opportunity Analysis By Feedstock, 2026 to 2036
- Global Market Analysis and Forecast, By Process, 2021 to 2036
- Introduction / Key Findings
- Historical Market Size Value (USD Million) & Volume (Unit) Analysis By Process, 2021 to 2025
- Current and Future Market Size Value (USD Million) & Volume (Unit) Analysis and Forecast By Process, 2026 to 2036
- Dissolution Separation
- Chemical Cleavage
- Mechanical-Chemical Hybrid
- Pilot - R&D
- Dissolution Separation
- Y-o-Y Growth Trend Analysis By Process, 2021 to 2025
- Absolute $ Opportunity Analysis By Process, 2026 to 2036
- Global Market Analysis and Forecast, By End Use, 2021 to 2036
- Introduction / Key Findings
- Historical Market Size Value (USD Million) & Volume (Unit) Analysis By End Use, 2021 to 2025
- Current and Future Market Size Value (USD Million) & Volume (Unit) Analysis and Forecast By End Use, 2026 to 2036
- Textile Recyclers
- Fiber Producers
- Brand Take-back Programs
- R&D Institutes
- Textile Recyclers
- Y-o-Y Growth Trend Analysis By End Use, 2021 to 2025
- Absolute $ Opportunity Analysis By End Use, 2026 to 2036
- Global Market Analysis and Forecast, By Sales Model, 2021 to 2036
- Introduction / Key Findings
- Historical Market Size Value (USD Million) & Volume (Unit) Analysis By Sales Model, 2021 to 2025
- Current and Future Market Size Value (USD Million) & Volume (Unit) Analysis and Forecast By Sales Model, 2026 to 2036
- Process Bundle
- Toll Treatment
- Chemical Supply
- Process Bundle
- Y-o-Y Growth Trend Analysis By Sales Model, 2021 to 2025
- Absolute $ Opportunity Analysis By Sales Model, 2026 to 2036
- Global Market Analysis and Forecast, By Region, 2021 to 2036
- Introduction
- Historical Market Size Value (USD Million) & Volume (Unit) Analysis By Region, 2021 to 2025
- Current Market Size Value (USD Million) & Volume (Unit) Analysis and Forecast By Region, 2026 to 2036
- North America
- Latin America
- Western Europe
- Eastern Europe
- East Asia
- South Asia and Pacific
- Middle East & Africa
- Market Attractiveness Analysis By Region
- North America Market Analysis and Forecast, By Country, 2021 to 2036
- Historical Market Size Value (USD Million) & Volume (Unit) Trend Analysis By Market Taxonomy, 2021 to 2025
- Market Size Value (USD Million) & Volume (Unit) Forecast By Market Taxonomy, 2026 to 2036
- By Country
- USA
- Canada
- Mexico
- By Chemical Type
- By Feedstock
- By Process
- By End Use
- By Sales Model
- By Country
- Market Attractiveness Analysis
- By Country
- By Chemical Type
- By Feedstock
- By Process
- By End Use
- By Sales Model
- Key Takeaways
- Latin America Market Analysis and Forecast, By Country
- Historical Market Size Value (USD Million) & Volume (Unit) Trend Analysis By Market Taxonomy, 2021 to 2025
- Market Size Value (USD Million) & Volume (Unit) Forecast By Market Taxonomy, 2026 to 2036
- By Country
- Brazil
- Chile
- Rest of Latin America
- By Chemical Type
- By Feedstock
- By Process
- By End Use
- By Sales Model
- By Country
- Market Attractiveness Analysis
- By Country
- By Chemical Type
- By Feedstock
- By Process
- By End Use
- By Sales Model
- Key Takeaways
- Western Europe Market Analysis and Forecast, By Country
- Historical Market Size Value (USD Million) & Volume (Unit) Trend Analysis By Market Taxonomy, 2021 to 2025
- Market Size Value (USD Million) & Volume (Unit) Forecast By Market Taxonomy, 2026 to 2036
- By Country
- Germany
- UK
- Italy
- Spain
- France
- Nordic
- BENELUX
- Rest of Western Europe
- By Chemical Type
- By Feedstock
- By Process
- By End Use
- By Sales Model
- By Country
- Market Attractiveness Analysis
- By Country
- By Chemical Type
- By Feedstock
- By Process
- By End Use
- By Sales Model
- Key Takeaways
- Eastern Europe Market Analysis and Forecast, By Country
- Historical Market Size Value (USD Million) & Volume (Unit) Trend Analysis By Market Taxonomy, 2021 to 2025
- Market Size Value (USD Million) & Volume (Unit) Forecast By Market Taxonomy, 2026 to 2036
- By Country
- Russia
- Poland
- Hungary
- Balkan & Baltic
- Rest of Eastern Europe
- By Chemical Type
- By Feedstock
- By Process
- By End Use
- By Sales Model
- By Country
- Market Attractiveness Analysis
- By Country
- By Chemical Type
- By Feedstock
- By Process
- By End Use
- By Sales Model
- Key Takeaways
- East Asia Market Analysis and Forecast, By Country
- Historical Market Size Value (USD Million) & Volume (Unit) Trend Analysis By Market Taxonomy, 2021 to 2025
- Market Size Value (USD Million) & Volume (Unit) Forecast By Market Taxonomy, 2026 to 2036
- By Country
- China
- Japan
- South Korea
- By Chemical Type
- By Feedstock
- By Process
- By End Use
- By Sales Model
- By Country
- Market Attractiveness Analysis
- By Country
- By Chemical Type
- By Feedstock
- By Process
- By End Use
- By Sales Model
- Key Takeaways
- South Asia and Pacific Market Analysis and Forecast, By Country
- Historical Market Size Value (USD Million) & Volume (Unit) Trend Analysis By Market Taxonomy, 2021 to 2025
- Market Size Value (USD Million) & Volume (Unit) Forecast By Market Taxonomy, 2026 to 2036
- By Country
- India
- ASEAN
- Australia & New Zealand
- Rest of South Asia and Pacific
- By Chemical Type
- By Feedstock
- By Process
- By End Use
- By Sales Model
- By Country
- Market Attractiveness Analysis
- By Country
- By Chemical Type
- By Feedstock
- By Process
- By End Use
- By Sales Model
- Key Takeaways
- Middle East & Africa Market Analysis and Forecast, By Country
- Historical Market Size Value (USD Million) & Volume (Unit) Trend Analysis By Market Taxonomy, 2021 to 2025
- Market Size Value (USD Million) & Volume (Unit) Forecast By Market Taxonomy, 2026 to 2036
- By Country
- Kingdom of Saudi Arabia
- Other GCC Countries
- Türkiye
- South Africa
- Other African Union
- Rest of Middle East & Africa
- By Chemical Type
- By Feedstock
- By Process
- By End Use
- By Sales Model
- By Country
- Market Attractiveness Analysis
- By Country
- By Chemical Type
- By Feedstock
- By Process
- By End Use
- By Sales Model
- Key Takeaways
- Key Countries Market Analysis
- USA
- Pricing Analysis
- Market Share Analysis, 2025
- By Chemical Type
- By Feedstock
- By Process
- By End Use
- By Sales Model
- Canada
- Pricing Analysis
- Market Share Analysis, 2025
- By Chemical Type
- By Feedstock
- By Process
- By End Use
- By Sales Model
- Mexico
- Pricing Analysis
- Market Share Analysis, 2025
- By Chemical Type
- By Feedstock
- By Process
- By End Use
- By Sales Model
- Brazil
- Pricing Analysis
- Market Share Analysis, 2025
- By Chemical Type
- By Feedstock
- By Process
- By End Use
- By Sales Model
- Chile
- Pricing Analysis
- Market Share Analysis, 2025
- By Chemical Type
- By Feedstock
- By Process
- By End Use
- By Sales Model
- Germany
- Pricing Analysis
- Market Share Analysis, 2025
- By Chemical Type
- By Feedstock
- By Process
- By End Use
- By Sales Model
- UK
- Pricing Analysis
- Market Share Analysis, 2025
- By Chemical Type
- By Feedstock
- By Process
- By End Use
- By Sales Model
- Italy
- Pricing Analysis
- Market Share Analysis, 2025
- By Chemical Type
- By Feedstock
- By Process
- By End Use
- By Sales Model
- Spain
- Pricing Analysis
- Market Share Analysis, 2025
- By Chemical Type
- By Feedstock
- By Process
- By End Use
- By Sales Model
- France
- Pricing Analysis
- Market Share Analysis, 2025
- By Chemical Type
- By Feedstock
- By Process
- By End Use
- By Sales Model
- India
- Pricing Analysis
- Market Share Analysis, 2025
- By Chemical Type
- By Feedstock
- By Process
- By End Use
- By Sales Model
- ASEAN
- Pricing Analysis
- Market Share Analysis, 2025
- By Chemical Type
- By Feedstock
- By Process
- By End Use
- By Sales Model
- Australia & New Zealand
- Pricing Analysis
- Market Share Analysis, 2025
- By Chemical Type
- By Feedstock
- By Process
- By End Use
- By Sales Model
- China
- Pricing Analysis
- Market Share Analysis, 2025
- By Chemical Type
- By Feedstock
- By Process
- By End Use
- By Sales Model
- Japan
- Pricing Analysis
- Market Share Analysis, 2025
- By Chemical Type
- By Feedstock
- By Process
- By End Use
- By Sales Model
- South Korea
- Pricing Analysis
- Market Share Analysis, 2025
- By Chemical Type
- By Feedstock
- By Process
- By End Use
- By Sales Model
- Russia
- Pricing Analysis
- Market Share Analysis, 2025
- By Chemical Type
- By Feedstock
- By Process
- By End Use
- By Sales Model
- Poland
- Pricing Analysis
- Market Share Analysis, 2025
- By Chemical Type
- By Feedstock
- By Process
- By End Use
- By Sales Model
- Hungary
- Pricing Analysis
- Market Share Analysis, 2025
- By Chemical Type
- By Feedstock
- By Process
- By End Use
- By Sales Model
- Kingdom of Saudi Arabia
- Pricing Analysis
- Market Share Analysis, 2025
- By Chemical Type
- By Feedstock
- By Process
- By End Use
- By Sales Model
- Türkiye
- Pricing Analysis
- Market Share Analysis, 2025
- By Chemical Type
- By Feedstock
- By Process
- By End Use
- By Sales Model
- South Africa
- Pricing Analysis
- Market Share Analysis, 2025
- By Chemical Type
- By Feedstock
- By Process
- By End Use
- By Sales Model
- USA
- Market Structure Analysis
- Competition Dashboard
- Competition Benchmarking
- Market Share Analysis of Top Players
- By Regional
- By Chemical Type
- By Feedstock
- By Process
- By End Use
- By Sales Model
- Emerging Startups
- Innovation Benchmarking
- Competition Analysis
- Competition Deep Dive
- Worn Again Technologies
- Overview
- Product Portfolio
- Profitability by Market Segments (Product/Region/Sales Channel)
- Sales Footprint
- Strategy Overview
- Marketing Strategy
- Product Strategy
- Channel Strategy
- Circ
- Ambercycle
- Reju
- Syre
- Eastman
- CARBIOS
- Selenis
- Worn Again Technologies
- Case Studies
- Success Stories
- Recent Developments
- Competition Deep Dive
- Assumptions & Acronyms Used


