Reports

- Global Locations -

Headquarters

Future Market Insights, Inc.

Christiana Corporate, 200
Continental Drive, Suite 401,
Newark, Delaware - 19713,
United States

T: +1-845-579-5705

Americas

Future Market Insights, Inc.

616 Corporate Way, Suite 2-9018,
Valley Cottage, NY 10989, United States

T: +1-347-918-3531

MEA

Future Market Insights

1602-6 Jumeirah Bay X2 Tower, Plot No: JLT-PH2-X2A,
Jumeirah Lakes Towers, Dubai,
United Arab Emirates

Europe

Future Market Insights

3rd Floor, 207 Regent Street,
W1B 3HH London
United Kingdom

T: + 44 (0) 20 8123 9659
D: +44 (0) 20 3287 4268

Asia Pacific

Future Market Insights

IndiaLand Global Tech Park, Unit UG-1, Behind Grand HighStreet, Phase 1, Hinjawadi, MH, Pune – 411057, India

Electronic Musical Instruments Market Outlook (2022-2032)

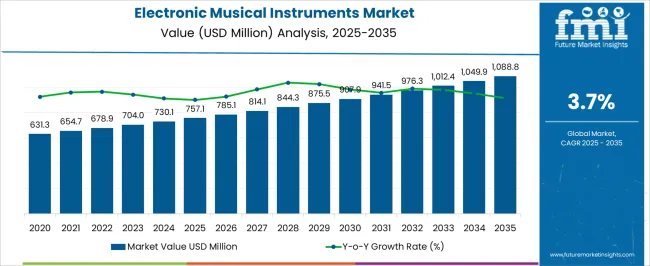
[333 Pages Report] The electronic musical instruments market is likely to reach a market value of US$ 678.9 Million in 2022. This market is expected to flourish at a CAGR of 3.7% to be valued at US$ 976.9 Million during the forecast period (2022 to 2032). A CAGR of 2.6% was recorded for the electronic musical instruments market from 2016 to 2021.

The progress and growth of the music industry have been facilitated by adopting new technologies in the electronic musical instruments market. Moreover, through the availability of high-quality, affordable instruments and computer software, electronic musical instruments played a crucial part in the democratization of experimental and traditional music composition.

Report Attribute Details
Electronic Musical Instruments Market Historical Growth Rate (2016-2021) 2.6%
Electronic Musical Instruments Market Value (2022) US$ 678.9 Million
Electronic Musical Instruments Market Forecast Value (2032) US$ 976.9 Million
Electronic Musical Instruments Market Projected Growth Rate (2022-2032) 3.7%

Don't pay for what you don't need

Customize your report by selecting specific countries or regions and save 30%!

Positive Factors Playing along the Electronic Musical Instruments Market Opportunities

The electronic musical instruments market players have lucrative potential over the projection period owing to new product innovations and technological advancements. The market is also influenced by the young generation's increased interest in music education and the usage of these instruments in the diversification of conventional and experimental music composition through the availability of high-quality instruments at affordable prices.

Additionally, urbanization and digitization, an increase in live music performances and concerts, and a growth in disposable income all benefit the electronic musical instruments market. Another critical reason propelling the growth of the electronic musical instruments market for electronic musical instruments is the expansion of the media and entertainment sector globally. Hence, the rising demand for music-related leisure activities is driving the growth of the electronic musical instruments market.

The electronic musical instruments market is also getting accelerated by the increased use of electronic musical instruments in genres of music like electronic and dance music. Another critical element driving the expansion of the electronic musical instruments market is the increased ability of consumers to spend a sizable amount on music concerts and live performances due to growing disposable income.

The demand for electrical musical instruments will be sustained by Western music's expanding acceptance and impact in emerging nations. The rise in the popularity of live music bands, music reality programs, and concerts is further anticipated to favor the electronic musical instruments market in the coming days.

Challenges that have turned down the Electronic Musical Instrument Market Opportunities

Lengthier replacement cycles and the high cost of these instruments are anticipated to restrain electronic musical instrument market expansion. The lack of consumer interest in purchasing the devices is also a significant issue limiting electronic musical instrument market trends.

Nowadays, several laptop and smartphone manufacturers also support well-known music-producing applications. Hence, during the forecast period, the electronic musical instruments market is likely to face significant challenges from the rising popularity of these virtual musical instruments and music creation software.

Sudip Saha
Sudip Saha

Principal Consultant

Talk to Analyst

Find your sweet spots for generating winning opportunities in this market.

Electronic Musical Instrument Market Key Trends & Opportunities

Customizing musical instruments like electronic guitars and pianos is one of the emerging trends in the electronic musical instruments market. Thus, personalization and customization of electronic guitars have considerably contributed to the expansion of the musical instruments market by providing several opportunities.

Additionally, leading electronic musical instruments market players might see an opportunity in online sales in the upcoming years. Additionally, e-commerce has become necessary for players to grow their global sales and clientele in addition to shops.
Electronic Musical Instrument Market Records an Emerging Trend in Europe

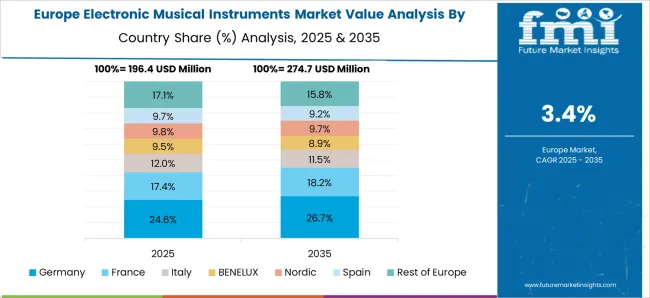
Owing to its relatively developed marketplaces and stable development rate over the projection period, Europe is expected to lead the worldwide electronic musical instruments market, holding a total share of 18%.

Most people in Europe spend a sizeable portion of their money on entertainment services, music festivals, and concerts. An increase in the number of significant players is supporting the expansion of the electronic musical instrument market. Additionally, this region imports the most musical instruments, which significantly boosts the market's earnings. Europe is expected to have a substantial growth rate in the electronic musical instrument market in the subsequent years due to rising leisure spending and increased disposable income.
Get the data you need at a Fraction of the cost

Personalize your report by choosing insights you need
and save 40%!

Status quo of Electronic Musical Instrument Market in North America

North America dominated the electronic musical instruments market, and this trend is anticipated to carry on during the forecast period due to the rapid technological development taking place in this region. Regarding market share, this region is expected to hold a 15.0% share.

The demand for electronic musical instruments will be sustained in the global market largely because of the expanding impact and popularity of music in emerging countries of North America. The primary market for electronic musical instruments in this region is the US.

Throughout the forecast period, North America's electronic musical instruments market will rise due to the introduction of novel items, rising demand for customized electronic musical instruments, and increased usage of online marketplaces for electronic musical instruments.

Fierce Competition in the Electronic Musical Instruments Market

The market is fiercely competitive due to the existence of a massive magnitude of players. While there are a number of major worldwide companies, like Gibson Brands, Inc., Fender Musical Instruments Corporation, and Kawai Musical Instruments Manufacturing Co., they only represent a modest portion of the market. Several regional-level firms are also active in key geographical areas.

How Start-ups are performing in the Electronic Musical Instrument Market

Aurzart, NIKKEI Asia, and Yamaha Make Waves are a few of the start-up businesses that are active in the electronic musical instruments market.

Example:

Aurzart is a renowned music retailer in India that offers a wide variety of musical equipment, including keyboard stands, digital pianos, and guitars.

Recent Developments

  • In April 2022, Yamaha Corporation revealed that the Super Surround Theatre in its corporate museum, Innovation Road, will soon include all-new programming called ViRealTM*1. It is Yamaha's ground-breaking 3D sound technology and is included in the 108.6-channel Super Surround Theatre.
  • In December 2021, Gibson Brands, Inc. released limited editions of Dave Mustaines' Flying V-shaped guitar model before launching it globally.
  • In July 2021, The PX family of digital pianos from Casio introduced two new models.

Key Players

  • Gibson Brands, Inc.
  • Fender Musical Instruments Corporation
  • Kawai Musical Instruments Manufacturing Co. Ltd.
  • inMusic, Inc.
  • Pioneer Corporation
  • Steinway Musical Instruments Inc.
  • Yamaha Corporation
  • Roland Corporation
  • Audiotonix Limited
  • Casio Computer Co. Ltd

Report Scope

Report Attribute Details
Growth Rate CAGR of 3.7% from 2022 to 2032
Base Year for Estimation 2021
Historical Data 2016-2021
Forecast Period 2022-2032
Quantitative Units Revenue in USD Billion and CAGR from 2022-2032
Report Coverage Revenue Forecast, Volume Forecast, Company Ranking, Competitive Landscape, Growth Factors, Trends and Pricing Analysis
Segments Covered
  • Product Type
  • Component
  • Region
Regions Covered
  • North America
  • Latin America
  • The Asia Pacific
  • Middle East and Africa
  • Europe
Key Countries Profiled
  • USA
  • Canada
  • Brazil
  • Argentina
  • Germany
  • UK
  • France
  • Spain
  • Italy
  • Nordics
  • BENELUX
  • Australia & New Zealand
  • China
  • India
  • ASEAN
  • GCC
  • South Africa
Key Companies Profiled
  • Gibson Brands, Inc.
  • Fender Musical Instruments Corporation
  • Kawai Musical Instruments Manufacturing Co. Ltd.
  • inMusic, Inc.
  • Pioneer Corporation
  • Steinway Musical Instruments Inc.
  • Yamaha Corporation
  • Roland Corporation
  • Audiotonix Limited
  • Casio Computer Co. Ltd
Customization Available Upon Request

Market Segments

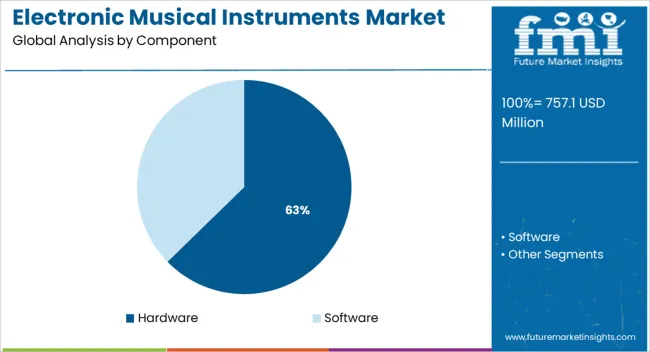
By Component:

  • Hardware
  • Software

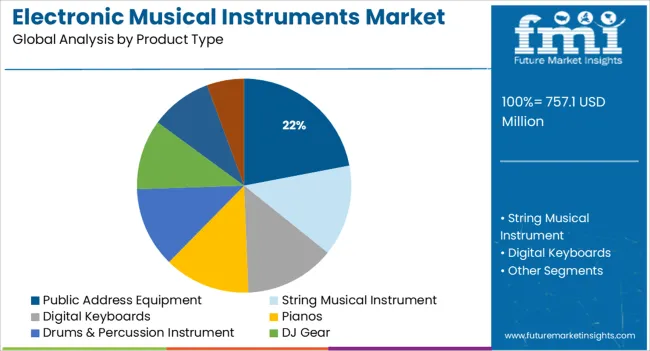
By Product Type:

  • Public Address Equipment
  • String Musical Instrument
  • Digital Keyboards
  • Pianos
  • Drums & Percussion Instrument
  • DJ Gear
  • Music Synthesizer
  • Others

By Region:

  • North America
  • Latin America
  • Asia Pacific
  • MEA
  • Europe

Frequently Asked Questions

What is the Growth Outlook for the Electronic Musical Instrument Market?

The global electronic musical instrument market at a rate of 3.7% (2022-2032).

Which Region is estimated to clinch the Maximum Share in the Global Electronic Musical Instrument Market?

Europe is expected to hold the highest share obtaining 18% market share.

What is the Future Prospect of the Electronic Musical Instrument Market?

Electronic musical instrument market is predicted to account for US$ 976.9 Million by 2032.

Table of Content

1. Executive Summary

    1.1. Global Market Outlook

    1.2. Demand-side Trends

    1.3. Supply-side Trends

    1.4. Technology Roadmap Analysis

    1.5. Analysis and Recommendations

2. Market Overview

    2.1. Market Coverage / Taxonomy

    2.2. Market Definition / Scope / Limitations

3. Market Background

    3.1. Market Dynamics

        3.1.1. Drivers

        3.1.2. Restraints

        3.1.3. Opportunity

        3.1.4. Trends

    3.2. Scenario Forecast

        3.2.1. Demand in Optimistic Scenario

        3.2.2. Demand in Likely Scenario

        3.2.3. Demand in Conservative Scenario

    3.3. Opportunity Map Analysis

    3.4. Investment Feasibility Matrix

    3.5. PESTLE and Porter’s Analysis

    3.6. Regulatory Landscape

        3.6.1. By Key Regions

        3.6.2. By Key Countries

    3.7. Regional Parent Market Outlook

4. Global Electronic Musical Instruments Market Analysis 2016-2021 and Forecast, 2022-2032

    4.1. Historical Market Size Value (US$ Mn) Analysis, 2016-2021

    4.2. Current and Future Market Size Value (US$ Mn) Projections, 2022-2032

        4.2.1. Y-o-Y Growth Trend Analysis

        4.2.2. Absolute $ Opportunity Analysis

5. Global Electronic Musical Instruments Market Analysis 2016-2021 and Forecast 2022-2032, By Product Type

    5.1. Introduction / Key Findings

    5.2. Historical Market Size Value (US$ Mn) Analysis By Product Type, 2016-2021

    5.3. Current and Future Market Size Value (US$ Mn) Analysis and Forecast By Product Type, 2022-2032

        5.3.1. Public Address Equipment

        5.3.2. String Instruments

        5.3.3. Digital Keyboards

        5.3.4. Electric Pianos

        5.3.5. Drums and Percussion Instruments

        5.3.6. DJ Gear

        5.3.7. Music Synthesizers

    5.4. Y-o-Y Growth Trend Analysis By Product Type, 2016-2021

    5.5. Absolute $ Opportunity Analysis By Product Type, 2022-2032

6. Global Electronic Musical Instruments Market Analysis 2016-2021 and Forecast 2022-2032, By Component

    6.1. Introduction / Key Findings

    6.2. Historical Market Size Value (US$ Mn) Analysis By Component, 2016-2021

    6.3. Current and Future Market Size Value (US$ Mn) Analysis and Forecast By Component, 2022-2032

        6.3.1. Hardware

        6.3.2. Software

    6.4. Y-o-Y Growth Trend Analysis By Component, 2016-2021

    6.5. Absolute $ Opportunity Analysis By Component, 2022-2032

7. Global Electronic Musical Instruments Market Analysis 2016-2021 and Forecast 2022-2032, By Region

    7.1. Introduction

    7.2. Historical Market Size Value (US$ Mn) Analysis By Region, 2016-2021

    7.3. Current Market Size Value (US$ Mn) Analysis and Forecast By Region, 2022-2032

        7.3.1. North America

        7.3.2. Latin America

        7.3.3. Europe

        7.3.4. Asia Pacific

        7.3.5. MEA

    7.4. Market Attractiveness Analysis By Region

8. North America Electronic Musical Instruments Market Analysis 2016-2021 and Forecast 2022-2032, By Country

    8.1. Historical Market Size Value (US$ Mn) Trend Analysis By Market Taxonomy, 2016-2021

    8.2. Market Size Value (US$ Mn) Forecast By Market Taxonomy, 2022-2032

        8.2.1. By Country

            8.2.1.1. U.S.

            8.2.1.2. Canada

        8.2.2. By Product Type

        8.2.3. By Component

    8.3. Market Attractiveness Analysis

        8.3.1. By Country

        8.3.2. By Product Type

        8.3.3. By Component

    8.4. Key Takeaways

9. Latin America Electronic Musical Instruments Market Analysis 2016-2021 and Forecast 2022-2032, By Country

    9.1. Historical Market Size Value (US$ Mn) Trend Analysis By Market Taxonomy, 2016-2021

    9.2. Market Size Value (US$ Mn) Forecast By Market Taxonomy, 2022-2032

        9.2.1. By Country

            9.2.1.1. Brazil

            9.2.1.2. Mexico

            9.2.1.3. Rest of Latin America

        9.2.2. By Product Type

        9.2.3. By Component

    9.3. Market Attractiveness Analysis

        9.3.1. By Country

        9.3.2. By Product Type

        9.3.3. By Component

    9.4. Key Takeaways

10. Europe Electronic Musical Instruments Market Analysis 2016-2021 and Forecast 2022-2032, By Country

    10.1. Historical Market Size Value (US$ Mn) Trend Analysis By Market Taxonomy, 2016-2021

    10.2. Market Size Value (US$ Mn) Forecast By Market Taxonomy, 2022-2032

        10.2.1. By Country

            10.2.1.1. Germany

            10.2.1.2. U.K.

            10.2.1.3. France

            10.2.1.4. Spain

            10.2.1.5. Italy

            10.2.1.6. Rest of Europe

        10.2.2. By Product Type

        10.2.3. By Component

    10.3. Market Attractiveness Analysis

        10.3.1. By Country

        10.3.2. By Product Type

        10.3.3. By Component

    10.4. Key Takeaways

11. Asia Pacific Electronic Musical Instruments Market Analysis 2016-2021 and Forecast 2022-2032, By Country

    11.1. Historical Market Size Value (US$ Mn) Trend Analysis By Market Taxonomy, 2016-2021

    11.2. Market Size Value (US$ Mn) Forecast By Market Taxonomy, 2022-2032

        11.2.1. By Country

            11.2.1.1. China

            11.2.1.2. Japan

            11.2.1.3. South Korea

            11.2.1.4. India

            11.2.1.5. Malaysia

            11.2.1.6. Singapore

            11.2.1.7. Australia

            11.2.1.8. New Zealand

            11.2.1.9. Rest of APAC

        11.2.2. By Product Type

        11.2.3. By Component

    11.3. Market Attractiveness Analysis

        11.3.1. By Country

        11.3.2. By Product Type

        11.3.3. By Component

    11.4. Key Takeaways

12. MEA Electronic Musical Instruments Market Analysis 2016-2021 and Forecast 2022-2032, By Country

    12.1. Historical Market Size Value (US$ Mn) Trend Analysis By Market Taxonomy, 2016-2021

    12.2. Market Size Value (US$ Mn) Forecast By Market Taxonomy, 2022-2032

        12.2.1. By Country

            12.2.1.1. GCC Countries

            12.2.1.2. South Africa

            12.2.1.3. Israel

            12.2.1.4. Rest of MEA

        12.2.2. By Product Type

        12.2.3. By Component

    12.3. Market Attractiveness Analysis

        12.3.1. By Country

        12.3.2. By Product Type

        12.3.3. By Component

    12.4. Key Takeaways

13. Key Countries Electronic Musical Instruments Market Analysis

    13.1. U.S.

        13.1.1. Pricing Analysis

        13.1.2. Market Share Analysis, 2021

            13.1.2.1. By Product Type

            13.1.2.2. By Component

    13.2. Canada

        13.2.1. Pricing Analysis

        13.2.2. Market Share Analysis, 2021

            13.2.2.1. By Product Type

            13.2.2.2. By Component

    13.3. Brazil

        13.3.1. Pricing Analysis

        13.3.2. Market Share Analysis, 2021

            13.3.2.1. By Product Type

            13.3.2.2. By Component

    13.4. Mexico

        13.4.1. Pricing Analysis

        13.4.2. Market Share Analysis, 2021

            13.4.2.1. By Product Type

            13.4.2.2. By Component

    13.5. Germany

        13.5.1. Pricing Analysis

        13.5.2. Market Share Analysis, 2021

            13.5.2.1. By Product Type

            13.5.2.2. By Component

    13.6. U.K.

        13.6.1. Pricing Analysis

        13.6.2. Market Share Analysis, 2021

            13.6.2.1. By Product Type

            13.6.2.2. By Component

    13.7. France

        13.7.1. Pricing Analysis

        13.7.2. Market Share Analysis, 2021

            13.7.2.1. By Product Type

            13.7.2.2. By Component

    13.8. Spain

        13.8.1. Pricing Analysis

        13.8.2. Market Share Analysis, 2021

            13.8.2.1. By Product Type

            13.8.2.2. By Component

    13.9. Italy

        13.9.1. Pricing Analysis

        13.9.2. Market Share Analysis, 2021

            13.9.2.1. By Product Type

            13.9.2.2. By Component

    13.10. China

        13.10.1. Pricing Analysis

        13.10.2. Market Share Analysis, 2021

            13.10.2.1. By Product Type

            13.10.2.2. By Component

    13.11. Japan

        13.11.1. Pricing Analysis

        13.11.2. Market Share Analysis, 2021

            13.11.2.1. By Product Type

            13.11.2.2. By Component

    13.12. South Korea

        13.12.1. Pricing Analysis

        13.12.2. Market Share Analysis, 2021

            13.12.2.1. By Product Type

            13.12.2.2. By Component

    13.13. Malaysia

        13.13.1. Pricing Analysis

        13.13.2. Market Share Analysis, 2021

            13.13.2.1. By Product Type

            13.13.2.2. By Component

    13.14. Singapore

        13.14.1. Pricing Analysis

        13.14.2. Market Share Analysis, 2021

            13.14.2.1. By Product Type

            13.14.2.2. By Component

    13.15. Australia

        13.15.1. Pricing Analysis

        13.15.2. Market Share Analysis, 2021

            13.15.2.1. By Product Type

            13.15.2.2. By Component

    13.16. New Zealand

        13.16.1. Pricing Analysis

        13.16.2. Market Share Analysis, 2021

            13.16.2.1. By Product Type

            13.16.2.2. By Component

    13.17. GCC Countries

        13.17.1. Pricing Analysis

        13.17.2. Market Share Analysis, 2021

            13.17.2.1. By Product Type

            13.17.2.2. By Component

    13.18. South Africa

        13.18.1. Pricing Analysis

        13.18.2. Market Share Analysis, 2021

            13.18.2.1. By Product Type

            13.18.2.2. By Component

    13.19. Israel

        13.19.1. Pricing Analysis

        13.19.2. Market Share Analysis, 2021

            13.19.2.1. By Product Type

            13.19.2.2. By Component

14. Market Structure Analysis

    14.1. Competition Dashboard

    14.2. Competition Benchmarking

    14.3. Market Share Analysis of Top Players

        14.3.1. By Regional

        14.3.2. By Product Type

        14.3.3. By Component

15. Competition Analysis

    15.1. Competition Deep Dive

        15.1.1. Gibson Brands, Inc.

            15.1.1.1. Overview

            15.1.1.2. Product Portfolio

            15.1.1.3. Profitability by Market Segments

            15.1.1.4. Sales Footprint

            15.1.1.5. Strategy Overview

                15.1.1.5.1. Marketing Strategy

        15.1.2. Fender Musical Instruments Corporation

            15.1.2.1. Overview

            15.1.2.2. Product Portfolio

            15.1.2.3. Profitability by Market Segments

            15.1.2.4. Sales Footprint

            15.1.2.5. Strategy Overview

                15.1.2.5.1. Marketing Strategy

        15.1.3. Kawai Musical Instruments Manufacturing Co., Ltd

            15.1.3.1. Overview

            15.1.3.2. Product Portfolio

            15.1.3.3. Profitability by Market Segments

            15.1.3.4. Sales Footprint

            15.1.3.5. Strategy Overview

                15.1.3.5.1. Marketing Strategy

        15.1.4. inMusic, Inc.

            15.1.4.1. Overview

            15.1.4.2. Product Portfolio

            15.1.4.3. Profitability by Market Segments

            15.1.4.4. Sales Footprint

            15.1.4.5. Strategy Overview

                15.1.4.5.1. Marketing Strategy

        15.1.5. Pioneer Corporation

            15.1.5.1. Overview

            15.1.5.2. Product Portfolio

            15.1.5.3. Profitability by Market Segments

            15.1.5.4. Sales Footprint

            15.1.5.5. Strategy Overview

                15.1.5.5.1. Marketing Strategy

        15.1.6. Steinway Musical Instruments, Inc.

            15.1.6.1. Overview

            15.1.6.2. Product Portfolio

            15.1.6.3. Profitability by Market Segments

            15.1.6.4. Sales Footprint

            15.1.6.5. Strategy Overview

                15.1.6.5.1. Marketing Strategy

        15.1.7. Yamaha Corporation

            15.1.7.1. Overview

            15.1.7.2. Product Portfolio

            15.1.7.3. Profitability by Market Segments

            15.1.7.4. Sales Footprint

            15.1.7.5. Strategy Overview

                15.1.7.5.1. Marketing Strategy

        15.1.8. Roland Corporation

            15.1.8.1. Overview

            15.1.8.2. Product Portfolio

            15.1.8.3. Profitability by Market Segments

            15.1.8.4. Sales Footprint

            15.1.8.5. Strategy Overview

                15.1.8.5.1. Marketing Strategy

        15.1.9. Audiotonix Limited

            15.1.9.1. Overview

            15.1.9.2. Product Portfolio

            15.1.9.3. Profitability by Market Segments

            15.1.9.4. Sales Footprint

            15.1.9.5. Strategy Overview

                15.1.9.5.1. Marketing Strategy

        15.1.10. Casio Computer Co., Ltd

            15.1.10.1. Overview

            15.1.10.2. Product Portfolio

            15.1.10.3. Profitability by Market Segments

            15.1.10.4. Sales Footprint

            15.1.10.5. Strategy Overview

                15.1.10.5.1. Marketing Strategy

16. Assumptions & Acronyms Used

17. Research Methodology

Don't pay for what you don't need

Customize your report by selecting specific countries or regions and save 30%!

List of Tables

Table 1: Global Electronic Musical Instruments Market Value (US$ Mn) Forecast by Region, 2016-2032

Table 2: Global Electronic Musical Instruments Market Value (US$ Mn) Forecast by Product Type, 2016-2032

Table 3: Global Electronic Musical Instruments Market Value (US$ Mn) Forecast by Component, 2016-2032

Table 4: North America Electronic Musical Instruments Market Value (US$ Mn) Forecast by Country, 2016-2032

Table 5: North America Electronic Musical Instruments Market Value (US$ Mn) Forecast by Product Type, 2016-2032

Table 6: North America Electronic Musical Instruments Market Value (US$ Mn) Forecast by Component, 2016-2032

Table 7: Latin America Electronic Musical Instruments Market Value (US$ Mn) Forecast by Country, 2016-2032

Table 8: Latin America Electronic Musical Instruments Market Value (US$ Mn) Forecast by Product Type, 2016-2032

Table 9: Latin America Electronic Musical Instruments Market Value (US$ Mn) Forecast by Component, 2016-2032

Table 10: Europe Electronic Musical Instruments Market Value (US$ Mn) Forecast by Country, 2016-2032

Table 11: Europe Electronic Musical Instruments Market Value (US$ Mn) Forecast by Product Type, 2016-2032

Table 12: Europe Electronic Musical Instruments Market Value (US$ Mn) Forecast by Component, 2016-2032

Table 13: Asia Pacific Electronic Musical Instruments Market Value (US$ Mn) Forecast by Country, 2016-2032

Table 14: Asia Pacific Electronic Musical Instruments Market Value (US$ Mn) Forecast by Product Type, 2016-2032

Table 15: Asia Pacific Electronic Musical Instruments Market Value (US$ Mn) Forecast by Component, 2016-2032

Table 16: MEA Electronic Musical Instruments Market Value (US$ Mn) Forecast by Country, 2016-2032

Table 17: MEA Electronic Musical Instruments Market Value (US$ Mn) Forecast by Product Type, 2016-2032

Table 18: MEA Electronic Musical Instruments Market Value (US$ Mn) Forecast by Component, 2016-2032
Sudip Saha
Sudip Saha

Principal Consultant

Talk to Analyst

Find your sweet spots for generating winning opportunities in this market.

List of Charts

Figure 1: Global Electronic Musical Instruments Market Value (US$ Mn) by Product Type, 2022-2032

Figure 2: Global Electronic Musical Instruments Market Value (US$ Mn) by Component, 2022-2032

Figure 3: Global Electronic Musical Instruments Market Value (US$ Mn) by Region, 2022-2032

Figure 4: Global Electronic Musical Instruments Market Value (US$ Mn) Analysis by Region, 2016-2032

Figure 5: Global Electronic Musical Instruments Market Value Share (%) and BPS Analysis by Region, 2022-2032

Figure 6: Global Electronic Musical Instruments Market Y-o-Y Growth (%) Projections by Region, 2022-2032

Figure 7: Global Electronic Musical Instruments Market Value (US$ Mn) Analysis by Product Type, 2016-2032

Figure 8: Global Electronic Musical Instruments Market Value Share (%) and BPS Analysis by Product Type, 2022-2032

Figure 9: Global Electronic Musical Instruments Market Y-o-Y Growth (%) Projections by Product Type, 2022-2032

Figure 10: Global Electronic Musical Instruments Market Value (US$ Mn) Analysis by Component, 2016-2032

Figure 11: Global Electronic Musical Instruments Market Value Share (%) and BPS Analysis by Component, 2022-2032

Figure 12: Global Electronic Musical Instruments Market Y-o-Y Growth (%) Projections by Component, 2022-2032

Figure 13: Global Electronic Musical Instruments Market Attractiveness by Product Type, 2022-2032

Figure 14: Global Electronic Musical Instruments Market Attractiveness by Component, 2022-2032

Figure 15: Global Electronic Musical Instruments Market Attractiveness by Region, 2022-2032

Figure 16: North America Electronic Musical Instruments Market Value (US$ Mn) by Product Type, 2022-2032

Figure 17: North America Electronic Musical Instruments Market Value (US$ Mn) by Component, 2022-2032

Figure 18: North America Electronic Musical Instruments Market Value (US$ Mn) by Country, 2022-2032

Figure 19: North America Electronic Musical Instruments Market Value (US$ Mn) Analysis by Country, 2016-2032

Figure 20: North America Electronic Musical Instruments Market Value Share (%) and BPS Analysis by Country, 2022-2032

Figure 21: North America Electronic Musical Instruments Market Y-o-Y Growth (%) Projections by Country, 2022-2032

Figure 22: North America Electronic Musical Instruments Market Value (US$ Mn) Analysis by Product Type, 2016-2032

Figure 23: North America Electronic Musical Instruments Market Value Share (%) and BPS Analysis by Product Type, 2022-2032

Figure 24: North America Electronic Musical Instruments Market Y-o-Y Growth (%) Projections by Product Type, 2022-2032

Figure 25: North America Electronic Musical Instruments Market Value (US$ Mn) Analysis by Component, 2016-2032

Figure 26: North America Electronic Musical Instruments Market Value Share (%) and BPS Analysis by Component, 2022-2032

Figure 27: North America Electronic Musical Instruments Market Y-o-Y Growth (%) Projections by Component, 2022-2032

Figure 28: North America Electronic Musical Instruments Market Attractiveness by Product Type, 2022-2032

Figure 29: North America Electronic Musical Instruments Market Attractiveness by Component, 2022-2032

Figure 30: North America Electronic Musical Instruments Market Attractiveness by Country, 2022-2032

Figure 31: Latin America Electronic Musical Instruments Market Value (US$ Mn) by Product Type, 2022-2032

Figure 32: Latin America Electronic Musical Instruments Market Value (US$ Mn) by Component, 2022-2032

Figure 33: Latin America Electronic Musical Instruments Market Value (US$ Mn) by Country, 2022-2032

Figure 34: Latin America Electronic Musical Instruments Market Value (US$ Mn) Analysis by Country, 2016-2032

Figure 35: Latin America Electronic Musical Instruments Market Value Share (%) and BPS Analysis by Country, 2022-2032

Figure 36: Latin America Electronic Musical Instruments Market Y-o-Y Growth (%) Projections by Country, 2022-2032

Figure 37: Latin America Electronic Musical Instruments Market Value (US$ Mn) Analysis by Product Type, 2016-2032

Figure 38: Latin America Electronic Musical Instruments Market Value Share (%) and BPS Analysis by Product Type, 2022-2032

Figure 39: Latin America Electronic Musical Instruments Market Y-o-Y Growth (%) Projections by Product Type, 2022-2032

Figure 40: Latin America Electronic Musical Instruments Market Value (US$ Mn) Analysis by Component, 2016-2032

Figure 41: Latin America Electronic Musical Instruments Market Value Share (%) and BPS Analysis by Component, 2022-2032

Figure 42: Latin America Electronic Musical Instruments Market Y-o-Y Growth (%) Projections by Component, 2022-2032

Figure 43: Latin America Electronic Musical Instruments Market Attractiveness by Product Type, 2022-2032

Figure 44: Latin America Electronic Musical Instruments Market Attractiveness by Component, 2022-2032

Figure 45: Latin America Electronic Musical Instruments Market Attractiveness by Country, 2022-2032

Figure 46: Europe Electronic Musical Instruments Market Value (US$ Mn) by Product Type, 2022-2032

Figure 47: Europe Electronic Musical Instruments Market Value (US$ Mn) by Component, 2022-2032

Figure 48: Europe Electronic Musical Instruments Market Value (US$ Mn) by Country, 2022-2032

Figure 49: Europe Electronic Musical Instruments Market Value (US$ Mn) Analysis by Country, 2016-2032

Figure 50: Europe Electronic Musical Instruments Market Value Share (%) and BPS Analysis by Country, 2022-2032

Figure 51: Europe Electronic Musical Instruments Market Y-o-Y Growth (%) Projections by Country, 2022-2032

Figure 52: Europe Electronic Musical Instruments Market Value (US$ Mn) Analysis by Product Type, 2016-2032

Figure 53: Europe Electronic Musical Instruments Market Value Share (%) and BPS Analysis by Product Type, 2022-2032

Figure 54: Europe Electronic Musical Instruments Market Y-o-Y Growth (%) Projections by Product Type, 2022-2032

Figure 55: Europe Electronic Musical Instruments Market Value (US$ Mn) Analysis by Component, 2016-2032

Figure 56: Europe Electronic Musical Instruments Market Value Share (%) and BPS Analysis by Component, 2022-2032

Figure 57: Europe Electronic Musical Instruments Market Y-o-Y Growth (%) Projections by Component, 2022-2032

Figure 58: Europe Electronic Musical Instruments Market Attractiveness by Product Type, 2022-2032

Figure 59: Europe Electronic Musical Instruments Market Attractiveness by Component, 2022-2032

Figure 60: Europe Electronic Musical Instruments Market Attractiveness by Country, 2022-2032

Figure 61: Asia Pacific Electronic Musical Instruments Market Value (US$ Mn) by Product Type, 2022-2032

Figure 62: Asia Pacific Electronic Musical Instruments Market Value (US$ Mn) by Component, 2022-2032

Figure 63: Asia Pacific Electronic Musical Instruments Market Value (US$ Mn) by Country, 2022-2032

Figure 64: Asia Pacific Electronic Musical Instruments Market Value (US$ Mn) Analysis by Country, 2016-2032

Figure 65: Asia Pacific Electronic Musical Instruments Market Value Share (%) and BPS Analysis by Country, 2022-2032

Figure 66: Asia Pacific Electronic Musical Instruments Market Y-o-Y Growth (%) Projections by Country, 2022-2032

Figure 67: Asia Pacific Electronic Musical Instruments Market Value (US$ Mn) Analysis by Product Type, 2016-2032

Figure 68: Asia Pacific Electronic Musical Instruments Market Value Share (%) and BPS Analysis by Product Type, 2022-2032

Figure 69: Asia Pacific Electronic Musical Instruments Market Y-o-Y Growth (%) Projections by Product Type, 2022-2032

Figure 70: Asia Pacific Electronic Musical Instruments Market Value (US$ Mn) Analysis by Component, 2016-2032

Figure 71: Asia Pacific Electronic Musical Instruments Market Value Share (%) and BPS Analysis by Component, 2022-2032

Figure 72: Asia Pacific Electronic Musical Instruments Market Y-o-Y Growth (%) Projections by Component, 2022-2032

Figure 73: Asia Pacific Electronic Musical Instruments Market Attractiveness by Product Type, 2022-2032

Figure 74: Asia Pacific Electronic Musical Instruments Market Attractiveness by Component, 2022-2032

Figure 75: Asia Pacific Electronic Musical Instruments Market Attractiveness by Country, 2022-2032

Figure 76: MEA Electronic Musical Instruments Market Value (US$ Mn) by Product Type, 2022-2032

Figure 77: MEA Electronic Musical Instruments Market Value (US$ Mn) by Component, 2022-2032

Figure 78: MEA Electronic Musical Instruments Market Value (US$ Mn) by Country, 2022-2032

Figure 79: MEA Electronic Musical Instruments Market Value (US$ Mn) Analysis by Country, 2016-2032

Figure 80: MEA Electronic Musical Instruments Market Value Share (%) and BPS Analysis by Country, 2022-2032

Figure 81: MEA Electronic Musical Instruments Market Y-o-Y Growth (%) Projections by Country, 2022-2032

Figure 82: MEA Electronic Musical Instruments Market Value (US$ Mn) Analysis by Product Type, 2016-2032

Figure 83: MEA Electronic Musical Instruments Market Value Share (%) and BPS Analysis by Product Type, 2022-2032

Figure 84: MEA Electronic Musical Instruments Market Y-o-Y Growth (%) Projections by Product Type, 2022-2032

Figure 85: MEA Electronic Musical Instruments Market Value (US$ Mn) Analysis by Component, 2016-2032

Figure 86: MEA Electronic Musical Instruments Market Value Share (%) and BPS Analysis by Component, 2022-2032

Figure 87: MEA Electronic Musical Instruments Market Y-o-Y Growth (%) Projections by Component, 2022-2032

Figure 88: MEA Electronic Musical Instruments Market Attractiveness by Product Type, 2022-2032

Figure 89: MEA Electronic Musical Instruments Market Attractiveness by Component, 2022-2032

Figure 90: MEA Electronic Musical Instruments Market Attractiveness by Country, 2022-2032

Recommendations

Consumer Product

Musical Instrument Market

Published : January 2024

Technology

Music and Streaming Services Market

Published : November 2022

Explore Technology Insights

View Reports

Electronic Musical Instruments Market