The end-of-line packaging market is projected to grow from USD 52.8 billion in 2025 to USD 89.3 billion by 2035, adding USD 36.6 billion in new revenue and advancing at a 5.4% CAGR. Growth is driven by accelerating automation across consumer goods, food & beverage, pharmaceuticals, and e-commerce fulfillment, where high-speed palletizing, case packing, and wrapping systems are essential for throughput, labor optimization, and uniform packaging quality. Palletizers, with 36.2% share, lead equipment adoption due to their central role in automated material handling and pallet formation, while case packers and stretch wrappers gain traction as manufacturers streamline downstream operations. Primary packaging completion, accounting for 28.5% share, remains the dominant application segment owing to stringent fill integrity, seal accuracy, and hygiene compliance in FMCG and pharma production. Between 2025–2030, expansion is supported by the shift toward robotic palletizing, servo-driven case packers, and automated wrapping lines, while the 2030–2035 phase accelerates with AI-driven inspection, collaborative robotics, and vision-integrated quality control systems.
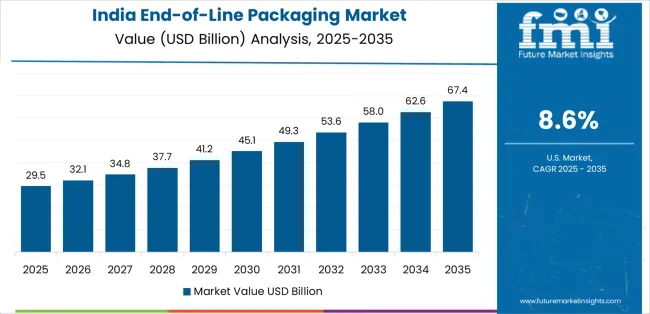
Regionally, India (8.6% CAGR) and China (7.3%) lead global growth, supported by rising industrial automation, expanding food processing hubs, and a surge in e-commerce logistics requiring fully integrated packaging lines. The USA (4.8%), Germany (4.5%), and Japan (3.9%) maintain steady demand led by precision manufacturing, serialization mandates in pharmaceuticals, and adoption of advanced robotic packaging systems. Brazil (6.2%) and Mexico (5.9%) advance through beverage production expansion and nearshoring-driven manufacturing growth. Competitive advantage is consolidating around integrated automation capabilities, enterprise connectivity, predictive maintenance, and robotics. Leading players such as Krones, Sidel, IMA, Barry-Wehmiller, Bosch Packaging Technology, and Wirtgen Group focus on intelligent motion control, flexible robotic grippers, IoT-enabled diagnostics, and line-integration expertise rather than standalone machinery, strengthening their role in high-throughput, multi-format packaging ecosystems.
A major dynamic shaping market expansion is the global push toward automation. Manufacturers increasingly adopt fully automated and semi-automated end-of-line systems to reduce labor dependency, improve accuracy, and manage rising production volumes. Automated case packing, robotic palletizing, and high-speed labeling systems help companies reduce errors, eliminate bottlenecks, and maintain consistent throughput. With labor shortages impacting industrial operations worldwide, automated equipment provides a reliable means of addressing staffing constraints while improving safety by reducing manual handling.
Technological innovation continues to reshape competitive dynamics. Manufacturers are developing modular, IoT-enabled systems with remote diagnostics, predictive maintenance capabilities, digital dashboards, and automated changeover features. Robotic palletizers with articulated arms, cobots, and advanced grippers help manage diverse payloads while improving line flexibility. Smart sensors, integrated vision systems, and AI-driven quality-control tools reduce downtime and enhance overall equipment effectiveness.
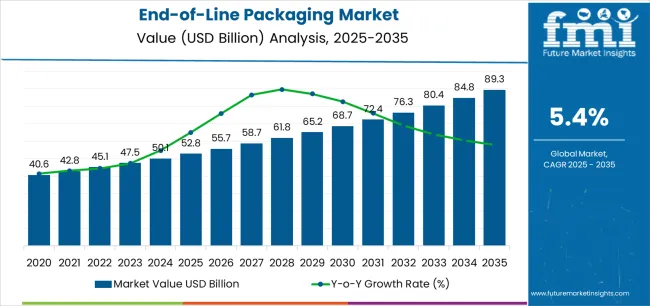
| Metric | Value |
|---|---|
| Estimated Value in (2025E) | USD 52.8 billion |
| Forecast Value in (2035F) | USD 89.3 billion |
| Forecast CAGR (2025 to 2035) | 5.4% |
Market expansion is being supported by the increasing global demand for manufacturing automation solutions and the corresponding need for packaging systems that can provide superior operational efficiency and labor cost reduction while enabling flexible production formats and quality assurance across various consumer goods and industrial distribution applications. Modern production facilities and logistics operations are increasingly focused on implementing packaging solutions that can maximize throughput rates, minimize equipment downtime, and provide consistent packaging performance throughout complex supply chain networks. End-of-line packaging equipment's proven ability to deliver exceptional production speed, enable workforce optimization through automation, and support operational excellence make them essential manufacturing components for contemporary consumer goods production and distribution center operations.
The growing emphasis on labor shortage mitigation and operational cost control is driving demand for end-of-line packaging systems that can support unmanned operation capabilities, improve production consistency, and enable advanced monitoring formats. Manufacturers' preference for equipment that combines effective packaging functionality with intelligent control systems and processing efficiency is creating opportunities for innovative end-of-line implementations. The rising influence of e-commerce fulfillment requirements and omnichannel distribution models is also contributing to increased demand for end-of-line packaging solutions that can provide format flexibility, damage prevention, and rapid changeover capabilities across diverse product categories.
The end-of-line packaging market is poised for rapid growth and transformation. As industries across food & beverage, pharmaceuticals, consumer goods, and e-commerce logistics seek equipment that delivers exceptional automation performance, operational reliability, and production efficiency, end-of-line packaging systems are gaining prominence not just as terminal packaging equipment but as strategic enablers of manufacturing excellence and supply chain optimization.
Rising automation adoption in emerging markets and expanding e-commerce infrastructure globally amplify demand, while manufacturers are leveraging innovations in robotic integration, artificial intelligence algorithms, and predictive maintenance technologies.
Pathways like collaborative robotics implementation, smart packaging line integration, and application-specific automation solutions promise strong margin uplift, especially in high-value segments. Geographic expansion and vertical integration will capture volume, particularly where local technical support capabilities and rapid service response are critical. Regulatory pressures around worker safety standards, production traceability requirements, product serialization mandates, and food safety specifications give structural support.
The market is segmented by equipment type, technology, automation level, application, end-use industry, production capacity, and region. By equipment type, the market is divided into palletizers, case packers, stretch wrappers, case sealers, labeling systems, and others. By technology, it covers robotic systems, conventional automated systems, and semi-automated systems. By automation level, it includes fully automated, semi-automated, and manual integration. By application, it covers primary packaging completion, secondary packaging, tertiary packaging, and distribution preparation. By end-use industry, it is categorized into food & beverage, pharmaceuticals & healthcare, personal care & cosmetics, chemicals & industrial products, and others. By production capacity, it covers low-speed (below 30 units/min), medium-speed (30-100 units/min), and high-speed (above 100 units/min). Regionally, the market is divided into North America, Europe, East Asia, South Asia & Pacific, Latin America, and the Middle East & Africa.
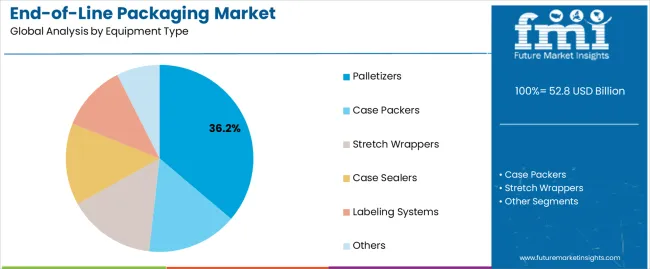
The palletizers segment is projected to account for 36.2% of the end-of-line packaging market in 2025, reaffirming its position as the leading equipment category. Manufacturing facilities and distribution centers increasingly utilize palletizing systems for their essential role in automated material handling, excellent load formation capabilities, and widespread adoption in consumer goods production and logistics operations. The palletizing technology's established industry acceptance and consistent performance characteristics directly address the industrial requirements for efficient pallet building in high-volume production environments.
This equipment segment forms the foundation of modern manufacturing and distribution operations, as it represents the packaging equipment type with the greatest installation base and established demand across multiple industrial categories and global markets. Manufacturer investments in robotic gripper technologies and advanced pattern optimization algorithms continue to strengthen adoption among production facilities and logistics centers. With companies prioritizing throughput maximization and labor efficiency, palletizing systems align with both operational requirements and return on investment objectives, making them the central component of comprehensive end-of-line automation strategies.
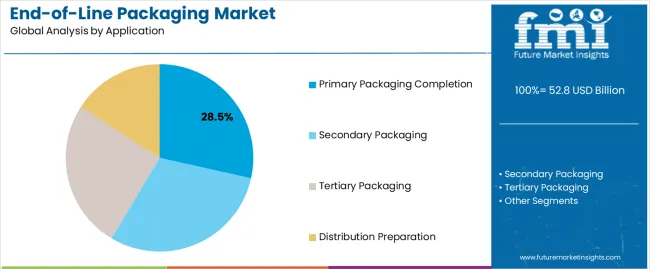
Primary packaging completion is projected to represent 28.5% of end-of-line packaging equipment demand in 2025, emphasizing its critical role in directly protecting and presenting individual products such as bottles, cartons, pouches, and blister packs. Manufacturers favor end-of-line equipment for primary packaging due to its ability to maintain product integrity, ensure accurate fill and seal operations, and comply with strict hygiene and safety standards. These systems support high-speed production while minimizing waste and ensuring consistent quality across diverse product formats.
The segment is reinforced by continuous innovation in precision filling, sealing, and labeling technologies, allowing manufacturers to enhance product protection and presentation. Additionally, flexible equipment capable of accommodating different container sizes and formats enables manufacturers to respond efficiently to market trends and consumer demands. As demand for safe, reliable, and attractively packaged products increases, primary packaging completion will continue to drive end-of-line equipment adoption and support operational efficiency initiatives.
The end-of-line packaging market is advancing rapidly due to increasing demand for manufacturing automation in consumer goods industries and growing adoption of integrated packaging solutions that provide superior operational efficiency and labor cost reduction while enabling production flexibility across diverse manufacturing and distribution applications. However, the market faces challenges, including high initial capital investment requirements, complexity of system integration with existing production infrastructure, and the need for skilled technical personnel for equipment maintenance. Innovation in collaborative robotics capabilities and artificial intelligence algorithms continues to influence product development and market expansion patterns.
The growing adoption of AI-driven quality control systems, predictive maintenance algorithms, and intelligent pattern optimization software is enabling manufacturers to deploy end-of-line packaging equipment with superior operational efficiency, enhanced defect detection capabilities, and proactive maintenance functionalities. Advanced artificial intelligence systems provide improved equipment reliability while allowing more efficient production planning and consistent quality across various manufacturing applications and product configurations. Manufacturers are increasingly recognizing the competitive advantages of intelligent automation capabilities for operational excellence and total cost of ownership reduction.
Modern end-of-line packaging equipment producers are incorporating collaborative robot technologies, adaptive gripping systems, and safe human-robot interaction capabilities to enhance production flexibility, enable rapid product changeovers, and deliver value-added automation solutions to small and medium-sized manufacturers. These technologies improve operational versatility while enabling new manufacturing capabilities, including mixed product handling, variable case configurations, and flexible pallet patterns. Advanced collaborative integration also allows manufacturers to implement automation solutions in space-constrained environments beyond traditional industrial robot applications.
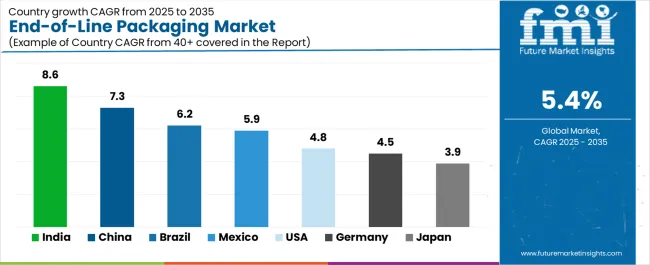
| Country | CAGR (2025-2035) |
|---|---|
| China | 7.3% |
| USA | 4.8% |
| India | 8.6% |
| Germany | 4.5% |
| Japan | 3.9% |
| Brazil | 6.2% |
| Mexico | 5.9% |
The end-of-line packaging market is experiencing strong growth globally, with India leading at an 8.6% CAGR through 2035, driven by the expanding manufacturing sector, growing consumer goods production, and significant investment in industrial automation infrastructure development. China follows at 7.3%, supported by rapid e-commerce growth, increasing food processing modernization, and growing export packaging demand. The USA shows growth at 4.8%, emphasizing advanced manufacturing technologies and pharmaceutical packaging automation development. Brazil records 6.2%, focusing on beverage production expansion and growing food processing automation. Germany demonstrates 4.5% growth, prioritizing precision engineering standards and advanced equipment production excellence. Japan exhibits 3.9% growth, emphasizing quality control and pharmaceutical manufacturing automation. Mexico shows 5.9% growth, supported by manufacturing expansion and nearshoring production trends.
The report covers an in-depth analysis of 40+ countries; seven top-performing countries are highlighted below.
Revenue from end-of-line packaging equipment in India is projected to exhibit exceptional growth with a CAGR of 8.6% through 2035, driven by expanding consumer goods manufacturing and rapidly growing food processing sector supported by government initiatives promoting domestic production development. The country's strong position in pharmaceutical manufacturing and increasing investment in industrial automation infrastructure are creating substantial demand for end-of-line packaging solutions. Major consumer goods producers and pharmaceutical manufacturers are establishing comprehensive automation capabilities to serve both domestic production demand and export manufacturing markets.
Revenue from end-of-line packaging equipment in China is expanding at a CAGR of 7.3%, supported by the country's massive e-commerce logistics network, expanding food and beverage production activities, and increasing adoption of intelligent manufacturing solutions. The country's government initiatives promoting automation standards and growing middle-class consumption patterns are driving requirements for sophisticated packaging capabilities. International equipment suppliers and domestic manufacturers are establishing extensive production and technical support capabilities to address the growing demand for end-of-line packaging products.
Revenue from end-of-line packaging equipment in the USA is expanding at a CAGR of 4.8%, supported by the country's advanced manufacturing capabilities, strong emphasis on pharmaceutical serialization compliance, and robust demand for high-performance automation systems in consumer packaged goods production applications. The nation's mature industrial sector and technology-focused operations are driving sophisticated end-of-line packaging systems throughout the supply chain. Leading equipment manufacturers and technology providers are investing extensively in robotic integration and artificial intelligence capabilities to serve both domestic and international markets.
Revenue from end-of-line packaging equipment in Brazil is growing at a CAGR of 6.2%, driven by the country's expanding beverage production sector, growing food processing modernization, and increasing investment in manufacturing automation facilities. Brazil's large domestic consumer market and commitment to industrial development are supporting demand for end-of-line packaging solutions across multiple production segments. Equipment suppliers are establishing comprehensive technical support capabilities to serve the growing domestic market and regional export opportunities.
Revenue from end-of-line packaging equipment in Germany is expanding at a CAGR of 4.5%, supported by the country's precision engineering leadership, advanced manufacturing capabilities, and strategic focus on high-quality automation equipment production. Germany's technical excellence and quality focus are driving demand for end-of-line packaging systems in pharmaceutical production, food processing, and automotive parts packaging applications. Manufacturers are investing in comprehensive Industry 4.0 integration capabilities to serve both domestic producers and international specialty markets.

Revenue from end-of-line packaging equipment in Japan is growing at a CAGR of 3.9%, driven by the country's expertise in precision automation, emphasis on quality assurance, and strong position in pharmaceutical manufacturing and electronics packaging. Japan's established automation technology capabilities and commitment to excellence are supporting investment in advanced production technologies throughout major manufacturing centers. Industry leaders are establishing comprehensive quality systems to serve domestic pharmaceutical producers and electronics manufacturers.
Revenue from end-of-line packaging equipment in Mexico is expanding at a CAGR of 5.9%, supported by the country's growing manufacturing base, nearshoring production trends, and strategic position in North American supply chains. Mexico's expanding automotive and consumer goods production capabilities and proximity to major markets are driving demand for high-quality end-of-line packaging systems in automotive component packaging, consumer goods production, and food processing applications. Leading manufacturers are investing in specialized capabilities to serve the requirements of multinational corporations and export-oriented production facilities.
The end-of-line packaging market in Europe is projected to grow from USD 14.2 billion in 2025 to USD 24.8 billion by 2035, registering a CAGR of 5.7% over the forecast period. Germany is expected to maintain its leadership position with a 31.5% market share in 2025, declining slightly to 31.0% by 2035, supported by its strong precision engineering base, advanced automation equipment manufacturing capabilities, and comprehensive pharmaceutical and food processing sector serving diverse end-of-line packaging applications across Europe.
France follows with a 18.5% share in 2025, projected to reach 19.0% by 2035, driven by robust demand for end-of-line packaging equipment in food processing operations, pharmaceutical manufacturing applications, and luxury goods production, combined with established automation infrastructure and export-oriented manufacturing expertise. The United Kingdom holds a 16.0% share in 2025, expected to reach 16.5% by 2035, supported by strong pharmaceutical production and growing e-commerce fulfillment automation. Italy commands a 13.5% share in 2025, projected to reach 14.0% by 2035, while Spain accounts for 9.5% in 2025, expected to reach 10.0% by 2035. Poland maintains a 5.5% share in 2025, growing to 6.0% by 2035. The Rest of Europe region, including Nordic countries, Eastern Europe, Belgium, Netherlands, and other nations, is anticipated to maintain momentum, with its collective share moving from 5.5% to 3.5% by 2035, attributed to increasing food processing automation in Eastern Europe and growing pharmaceutical manufacturing in Nordic countries implementing advanced packaging programs.
The end-of-line packaging market is characterized by competition among established automation equipment manufacturers, specialized packaging machinery producers, and integrated production line solution providers. Companies are investing in robotics technology research, artificial intelligence algorithm development, vision system optimization, and comprehensive equipment portfolios to deliver consistent, high-performance, and application-specific end-of-line packaging solutions. Innovation in collaborative robotics, predictive maintenance capabilities, and Industry 4.0 connectivity is central to strengthening market position and competitive advantage.
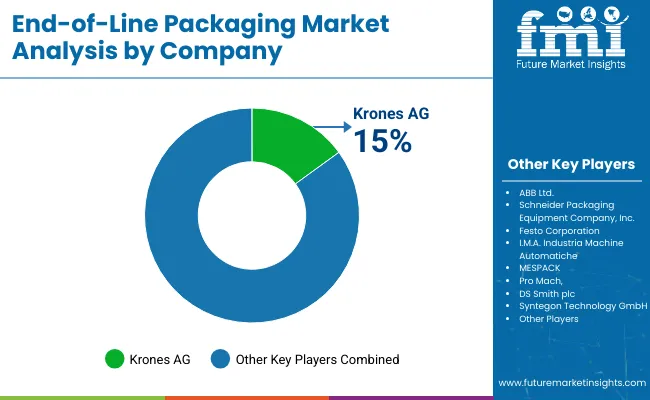
Krones AG leads the market with a strong market share, offering comprehensive end-of-line packaging solutions with a focus on beverage and food processing applications. Sidel Group provides specialized packaging equipment capabilities with an emphasis on liquid food packaging and integrated line solutions. IMA Group delivers innovative automation products with a focus on pharmaceutical packaging technologies and serialization integration. Barry-Wehmiller Companies specializes in packaging machinery and material handling systems for consumer goods applications. Bosch Packaging Technology focuses on pharmaceutical packaging equipment and high-speed automation solutions. Wirtgen Group offers specialized equipment for industrial packaging applications with emphasis on customized automation requirements.
| Items | Values |
|---|---|
| Quantitative Units (2025) | USD 52.8 billion |
| Equipment Type | Palletizers, Case Packers, Stretch Wrappers, Case Sealers, Labeling Systems, Others |
| Technology | Robotic Systems, Conventional Automated Systems, Semi-Automated Systems |
| Automation Level | Fully Automated, Semi-Automated, Manual Integration |
| Application | Primary Packaging Completion, Secondary Packaging, Tertiary Packaging, Distribution Preparation |
| End-Use Industry | Food & Beverage, Pharmaceuticals & Healthcare, Personal Care & Cosmetics, Chemicals & Industrial Products, Others |
| Production Capacity | Low-Speed (Below 30 units/min), Medium-Speed (30-100 units/min), High-Speed (Above 100 units/min) |
| Regions Covered | North America, Europe, East Asia, South Asia & Pacific, Latin America, Middle East & Africa |
| Countries Covered | United States, Canada, United Kingdom, Germany, France, China, Japan, South Korea, India, Brazil, Mexico, and 40+ countries |
| Key Companies Profiled | Krones AG, Sidel Group, IMA Group, Barry-Wehmiller Companies, Bosch Packaging Technology, and Wirtgen Group |
| Additional Attributes | Dollar sales by equipment type and application category, regional demand trends, competitive landscape, technological advancements in robotic systems, artificial intelligence integration, vision inspection development, and production line optimization |
The global end-of-line packaging market is estimated to be valued at USD 52.8 billion in 2025.
The market size for the end-of-line packaging market is projected to reach USD 89.3 billion by 2035.
The end-of-line packaging market is expected to grow at a 5.4% CAGR between 2025 and 2035.
The key product types in end-of-line packaging market are palletizers, case packers, stretch wrappers, case sealers, labeling systems and others.
In terms of application, primary packaging completion segment to command 28.5% share in the end-of-line packaging market in 2025.


Our Research Products

The "Full Research Suite" delivers actionable market intel, deep dives on markets or technologies, so clients act faster, cut risk, and unlock growth.

The Leaderboard benchmarks and ranks top vendors, classifying them as Established Leaders, Leading Challengers, or Disruptors & Challengers.

Locates where complements amplify value and substitutes erode it, forecasting net impact by horizon

We deliver granular, decision-grade intel: market sizing, 5-year forecasts, pricing, adoption, usage, revenue, and operational KPIs—plus competitor tracking, regulation, and value chains—across 60 countries broadly.

Spot the shifts before they hit your P&L. We track inflection points, adoption curves, pricing moves, and ecosystem plays to show where demand is heading, why it is changing, and what to do next across high-growth markets and disruptive tech

Real-time reads of user behavior. We track shifting priorities, perceptions of today’s and next-gen services, and provider experience, then pace how fast tech moves from trial to adoption, blending buyer, consumer, and channel inputs with social signals (#WhySwitch, #UX).

Partner with our analyst team to build a custom report designed around your business priorities. From analysing market trends to assessing competitors or crafting bespoke datasets, we tailor insights to your needs.
Supplier Intelligence
Discovery & Profiling
Capacity & Footprint
Performance & Risk
Compliance & Governance
Commercial Readiness
Who Supplies Whom
Scorecards & Shortlists
Playbooks & Docs
Category Intelligence
Definition & Scope
Demand & Use Cases
Cost Drivers
Market Structure
Supply Chain Map
Trade & Policy
Operating Norms
Deliverables
Buyer Intelligence
Account Basics
Spend & Scope
Procurement Model
Vendor Requirements
Terms & Policies
Entry Strategy
Pain Points & Triggers
Outputs
Pricing Analysis
Benchmarks
Trends
Should-Cost
Indexation
Landed Cost
Commercial Terms
Deliverables
Brand Analysis
Positioning & Value Prop
Share & Presence
Customer Evidence
Go-to-Market
Digital & Reputation
Compliance & Trust
KPIs & Gaps
Outputs
Full Research Suite comprises of:
Market outlook & trends analysis
Interviews & case studies
Strategic recommendations
Vendor profiles & capabilities analysis
5-year forecasts
8 regions and 60+ country-level data splits
Market segment data splits
12 months of continuous data updates
DELIVERED AS:
PDF EXCEL ONLINE
Packaging Supply Market Size and Share Forecast Outlook 2025 to 2035
Packaging Testing Services Market Size and Share Forecast Outlook 2025 to 2035
Packaging Tubes Market Size and Share Forecast Outlook 2025 to 2035
Packaging Jar Market Forecast and Outlook 2025 to 2035
Packaging Barrier Film Market Size and Share Forecast Outlook 2025 to 2035
Packaging Films Market Size and Share Forecast Outlook 2025 to 2035
Packaging Laminate Market Size and Share Forecast Outlook 2025 to 2035
Packaging Burst Strength Test Market Size and Share Forecast Outlook 2025 to 2035
Packaging Tapes Market Analysis - Size, Share, & Forecast Outlook 2025 to 2035
Packaging Materials Market Size and Share Forecast Outlook 2025 to 2035
Packaging Labels Market Size and Share Forecast Outlook 2025 to 2035
Packaging Equipment Market Size and Share Forecast Outlook 2025 to 2035
Packaging Resins Market Size and Share Forecast Outlook 2025 to 2035
Packaging Inspection Systems Market Size and Share Forecast Outlook 2025 to 2035
Packaging Design And Simulation Technology Market Size and Share Forecast Outlook 2025 to 2035
Packaging Suction Cups Market Size and Share Forecast Outlook 2025 to 2035
Packaging Straps and Buckles Market Size and Share Forecast Outlook 2025 to 2035
Packaging Coating Market Analysis - Size, Share, & Forecast Outlook 2025 to 2035
Packaging Testing Equipment Market Analysis & Growth 2025 to 2035
Packaging Bins Market Trends - Growth & Demand 2025 to 2035

Thank you!
You will receive an email from our Business Development Manager. Please be sure to check your SPAM/JUNK folder too.
Chat With
MaRIA