

- Market Size (2026)
- USD 640.7 Mn
- Forecast (2036)
- USD 1396.1 Mn
- CAGR (2026 to 2036)
- 8.1%
How big is the Excavator Safety Interlocks Market in 2026?
USD 640.7 million in 2026 and USD 1,396.1 million by 2036 at an 8.1% CAGR.
Demand for excavator safety interlocks is projected to expand at 8.1% CAGR between 2026 and 2036, increasing valuation from USD 640.7 million in 2026 to USD 1,396.1 million by 2036. Contractors are expected to add motion cutoffs and operator-presence controls because struck-by exposure remains tied to heavy equipment movement. CPWR identified struck-by incidents as the 2nd cause of construction worker deaths in its 2026 safety resources. That hazard profile is expected to keep safety interlock switches close to fleet safety reviews and excavator specifications.
India and China are projected to favor locally supported retrofit and factory-fit controls because excavator fleets are expanding across civil works. United States and European accounts are expected to stress documented control logic and fail-safe behavior during fleet approval. Engineering teams are anticipated to check hydraulic cut paths and permissible working envelopes before field release. Rental managers are estimated to compare override controls and technician response beside acquisition cost. ICEMA reported in May 2025 that 98% of equipment sold domestically in India was made locally. Local production depth is expected to shorten support routes for crawler excavator demand while raising expectations for serviceable interlock integration.
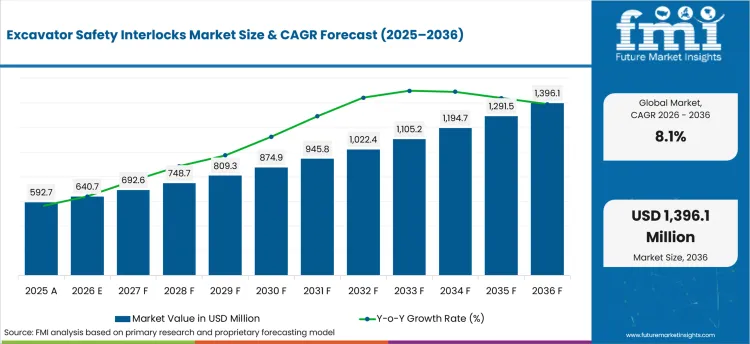
| Metric | Value |
|---|---|
| 2025 Market Size | USD 592.7 million |
| 2026 Market Size | USD 640.7 million |
| 2036 Market Size | USD 1,396.1 million |
| Forecast CAGR (2026-2036) | 8.1% |
| Interlock Type Focus | Hydraulic Lockout Interlocks |
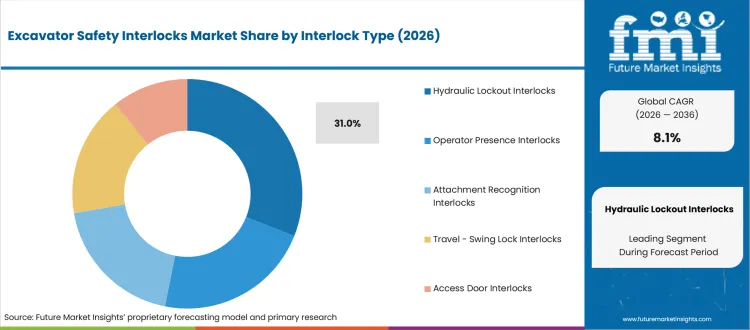
| Hydraulic Lockout Interlocks Share (2026) | 31.0% |
| Machine Type Focus | Crawler Excavators |
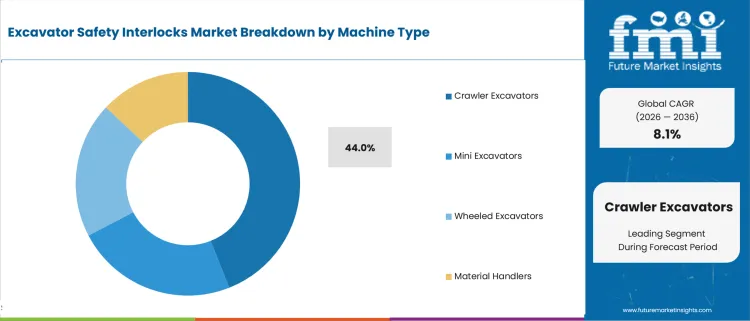
| Crawler Excavators Share (2026) | 44.0% |
| Integration Focus | Factory-installed |
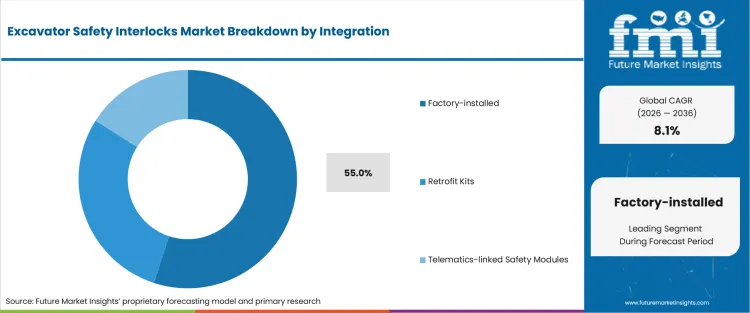
| Factory-installed Share (2026) | 55.0% |
Summary of the Excavator Safety Interlocks Market
| Market Signal | Commercial Impact |
|---|---|
| Demand and Growth Drivers | Worksite exposure and utility-strike risk are expected to keep safety controls inside machine approval decisions. Fleet managers are projected to value automatic intervention when operator warnings alone leave residual risk.
|
| Product and Segment View | Factory-installed controls are projected to benefit from OEM validation while retrofit systems are expected to remain relevant for mixed-age fleets. Hydraulic lockout functions are anticipated to stay central. They act directly on machine movement during enforced safety intervention.
|
| Geography and Growth Outlook | Country outlooks are expected to separate by fleet expansion pace and the depth of local service. India and China are projected to prioritize scalable installation support while established fleets place more weight on approval records.
|
| Competitive Landscape | Competition is expected to separate OEM-integrated controls from specialist retrofit systems. Engineering credibility is anticipated to depend on how clearly each supplier proves motion limits and supports installation across varied hydraulic layouts.
|
| Analyst Perspective | The decisive issue is not whether an alarm appears on a screen. Commercial value is expected to come from controls that stop unsafe motion without making operators fight the machine during routine work.
|
How is the excavator safety interlocks market segmented?
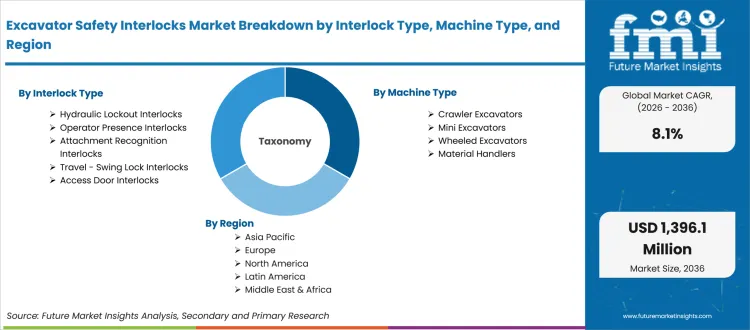
The excavator safety interlocks industry is segmented by interlock type, machine type, integration, application, sales channel, and region.
The excavator safety interlocks market is segmented by interlock type, machine type, integration, application, and sales channel. Interlock type covers hydraulic lockout interlocks, operator presence interlocks, attachment recognition interlocks, travel/swing lock interlocks, and access door interlocks. Machine type covers mini excavators, crawler excavators, wheeled excavators, and material handlers. Integration covers factory-installed controls, retrofit kits, and telematics-linked safety modules. Application covers construction, utilities, mining/quarrying, demolition, and rental fleet safety. Sales channels cover OEM fitment, dealer retrofit, and safety system integrators. Regional coverage follows North America, Latin America, Europe, East Asia, South Asia, Oceania, and Middle East and Africa alongside related machine safety systems demand.
What supports demand for hydraulic lockout interlocks within the interlock type category?
Excavator controls need to do more than warn an operator when a boom or bucket nears a restricted zone. Xwatch published an RCI Lite safety article in April 2026 that framed rated-capacity control around practical lifting limits. Hydraulic lockout interlocks are expected to draw attention where site rules require enforced movement limits instead of advisory alarms. Fleet engineers are anticipated to test restart behavior and override permissions before wider installation.
- Based on interlock type, hydraulic lockout interlocks are projected to account for 31.0% in 2026 due to direct control over unsafe machine movement. Xwatch announced a Topcon MC-X integration in March 2026 that connects machine control with on-machine safety. The link is expected to increase interest in controls that coordinate digital work boundaries with hydraulic intervention.
- Hydraulic lockout interlocks are expected to draw demand from utility and rail contractors due to work near buried services or fixed clearance limits. KOBELCO and Leica Geosystems announced a March 2025 collaboration with Xwatch around remote excavation and machine safety. Contractors are expected to value controls that keep movement limits available when operators work away from the cab or near fixed boundaries.
How do fleet managers evaluate crawler excavators within the machine type category?
Crawler excavators spend long shifts in trenching and grading tasks where blind spots change as the upper structure rotates. Volvo CE introduced the ECR255 in January 2026 with optional Smart View obstacle detection that separates people from objects around the machine. Fleet managers are expected to examine whether an interlock works across changing boom positions and attachment combinations. Service teams are anticipated to favor controls that retain calibration after transport and routine attachment changes.
- By machine type, crawler excavators are estimated to hold 44.0% in 2026 due to broad use in civil works and utility excavation. Hitachi Construction Machinery presented collision mitigation control on a ZX210LC-7 in March 2025. The system is expected to keep compact construction equipment safety controls visible during fleet reviews because it stops motion after detecting nearby hazards.
- Rental fleet managers are expected to purchase more crawler-focused safety controls led by frequent machine transfers between sites with different hazards. Liebherr expanded its Generation 8 crawler assistance systems in January 2026 and made Skyview 360 available for factory or retrofit installation. Rental companies are expected to value controls that technicians verify quickly before dispatch because unclear settings become costly after a machine reaches site.
What drives factory-installed safety controls within the integration category?
Factory installation lets an OEM validate sensors and control responses before the excavator reaches a contractor. Volvo CE updated the EC230 Electric in February 2025 with Smart View that classifies people and obstacles around the machine. OEM engineering teams are expected to use that type of integrated detection when safety functions share machine data. Contractors are anticipated to compare factory coverage against retrofit flexibility before deciding how to standardize a mixed fleet.
- In 2026, factory-installed integration is expected to lead with 55.0% share because validated control logic reduces installation uncertainty for new machines. Shantui and Leica Geosystems announced machine-control solutions for new excavator models in April 2025. Factory integration is projected to appeal to accounts that want one support route for control software and hydraulic response under connected construction fleets.
- Purchase activity for factory-installed controls is anticipated to rise because new-machine acceptance tests include them more easily. Hitachi Construction Machinery began a March 2024 verification test of an Operator Assist System for ultra-large hydraulic excavators. Contractors are expected to prefer integrated controls when the OEM explains automated functions and service responsibility before a machine enters a project fleet.
What are the drivers, restraints, and opportunities in the excavator safety interlocks market?
Near-term purchases are projected to reflect enforced work limits and retrofit calibration risk while utility-strike prevention routes open new account access.
- Driver: Civil contractors are expected to specify safety interlocks when machine movement near workers or fixed hazards needs an enforced stop instead of an operator warning.
- Restraint: Mixed fleet layouts are anticipated to lengthen approval because hydraulic interfaces and override rules differ across machine generations and attachment setups.
- Opportunity: Utility excavation is projected to open retrofit demand for controls that combine subsurface detection with automatic bucket stop functions.
Construction teams are expected to place more weight on controls that interrupt unsafe motion before a warning becomes an incident. OSHA updated its fiscal 2025 citation list in April 2026 and placed control of hazardous energy at the 4th position among frequently cited federal standards. The rule extends beyond excavator operation but its enforcement context keeps lockout behavior familiar to safety managers who review hydraulic energy controls during daily work.
Mixed fleets create a practical restraint because one interlock design does not fit every valve layout or machine duty. OSHA reported 30,273 inspections during fiscal 2025 in its current enforcement summary. The enforcement volume keeps documentation and safe work procedures visible during contractor reviews. Contractors are expected to resist poorly documented retrofit changes when machine controls introduce new failure questions. Specialist installers are anticipated to win approval by showing test steps and safe override behavior before fleet-wide conversion begins.
Utility work is expected to make safety integration an opportunity instead of treating machine control as a separate technology layer. Liebherr presented Generation 8 crawler assistance systems at Conexpo in March 2026 with Skyview 360 for obstacle detection. Utility contractors are anticipated to review such functions beside proximity sensing systems because visibility data is more useful when operators understand how it interacts with machine limits. The commercial opening is expected to favor installers who prove sensor logic during a live dig trial.
Which country CAGRs are profiled in the excavator safety interlocks market?
.webp "Top Country Growth Comparison Excavator Safety Interlocks Market Cagr (2026 2036)")
| Country | CAGR |
|---|---|
| United States | 7.0% |
| China | 9.4% |
| India | 10.2% |
| Germany | 6.6% |
| United Kingdom | 7.2% |
| Japan | 6.2% |
| South Korea | 7.8% |
Source: FMI's proprietary forecasting model and primary research
How do country-level CAGRs compare in the excavator safety interlocks market?
Country outlooks are expected to separate according to excavator fleet growth and the formality of site safety approval. India and China are projected to expand through equipment additions and local service depth. United States and European accounts are anticipated to spend more time on control records and retrofit responsibility. CECE reported in its 2026 economic review that European construction equipment sales increased 4.6% during 2025. The 2025 recovery is expected to support replacement decisions while keeping proof of safe machine integration central to contractor and rental fleet purchasing.
- Federal safety review keeps lockout behavior close to contractor discussions when hydraulic equipment works near people and buried services. The United States is projected to grow at 7.0% CAGR because rental fleets and civil contractors are expected to formalize machine-control checks. The Bureau of Labor Statistics reported 1,032 fatalities among construction and extraction workers in 2024. The toll is expected to keep machine movement controls visible during contractor and rental fleet safety reviews. Caterpillar and national rental channels provide local service depth for factory controls. Procurement is anticipated to compare excavator purchasing patterns with documented override access and technician response after a field fault.
- Large excavator volumes give local OEMs a broad base for embedding control limits at the factory and supporting field retrofit work. CCMA reported that excavator sales reached 235,257 units during 2025. Demand in China is forecast to rise at 9.4% CAGR led by fleet additions and local manufacturing scale. SANY and XCMG are expected to shape factory-fit expectations while local system integrators address older machines. Contractors are anticipated to compare installation speed against proof that hydraulic intervention does not disrupt cycle control. The open question is how quickly specialist safety functions become standard specifications across municipal utility and urban excavation contracts.
- Crawler excavator use is expected to expand beside road and utility work which gives safety installers a clear route through active fleet additions. India is estimated to post 10.2% CAGR due to infrastructure equipment demand and locally supported service. The Press Information Bureau reported 5,614 km of National Highway construction by NHAI during fiscal 2024-25. The construction program is expected to keep earthmoving fleets active across corridor projects. Tata Hitachi and HD Construction Equipment provide local machine and dealer networks that shape retrofit access. Fleet managers are anticipated to favor controls that local technicians calibrate without long machine downtime between projects.
- BG BAU continues to keep construction injury prevention visible for contractors that manage heavy equipment around changing work zones. Official BG BAU data placed reportable construction and related service accidents at 91,813 in 2024. Germany's sector is projected to record 6.6% CAGR during the assessment period due to formal safety review and equipment renewal. Liebherr gives local engineering teams direct access to OEM-integrated assistance systems and dealer support. Retrofit specialists are expected to face detailed questions about machine approval and override governance. Account wins are anticipated to depend on clear test records and named service responsibility after each installation and later recalibration.
- Utility excavation and rail work create a distinct route for height limits and slew control around fixed infrastructure. Xwatch and GKD Technologies give contractors local access to retrofit safety systems and field support. HSE recorded 24 fatalities involving workers struck by moving vehicles during 2025/26. In the United Kingdom, demand is anticipated to advance at 7.2% CAGR due to rental fleet accountability and infrastructure work. Contractors are projected to compare Network Rail acceptance where relevant and practical service response during fleet transfers. Retrofit formats are expected to hold an advantage where mixed-brand rental fleets need a common safety approach.
- Hydraulic excavator engineering is closely tied to domestic OEM design teams and export programs that demand repeatable machine behavior. Hitachi Construction Machinery and Komatsu anchor local development paths for integrated controls. Japan Construction Equipment Manufacturers Association reported that overseas hydraulic excavator shipments increased 10.1% in fiscal 2025. That export momentum is expected to keep safety features aligned with varied destination rules and dealer support models. Adoption of excavator safety interlocks is estimated to expand at 6.2% CAGR through 2036. Japanese accounts are anticipated to favor factory-tested functions backed by clear dealer service procedures and repeatable approval records across projects.
- Construction safety enforcement is expected to tighten around sites where heat and other work risks require closer on-site checks. HD Hyundai Construction Equipment provides a local OEM channel for equipment fleets and dealer service. The Ministry of Employment and Labor announced inspections covering about 4,000 workplaces from July through September 2025. Those checks included construction among the targeted sectors. In South Korea, demand is forecast to rise at 7.8% CAGR supported by concentrated equipment networks and formal safety review. Contractors are expected to value fast calibration support because project schedules leave little room for a machine held out of service.
Who are the notable companies in the excavator safety interlocks market?
Caterpillar, Komatsu, Volvo Construction Equipment, Liebherr, Hitachi Construction Machinery, Xwatch Safety Solutions, and GKD Technologies are the notable companies shaping this market.
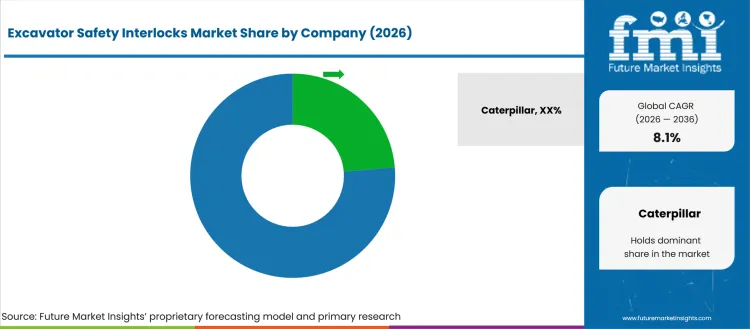
Competition is expected to split between OEM-integrated systems and specialist retrofit controls. OEMs are projected to use machine data and dealer service to validate limits before delivery. Retrofit specialists are anticipated to compete on hydraulic compatibility and rapid installation across mixed fleets. Develon and Leica Geosystems launched an integrated machine-guidance system for excavators in April 2025. The release shows how equipment makers and technology specialists combine their channels around machine controls. Procurement teams are expected to compare diagnostic access beside equipment telematics support when interlocks share machine data.
- Caterpillar and Komatsu compete from the factory side because both control machine architecture and dealer service. Their advantage is expected to come from integrating detection or boundary functions before delivery. Contractors are anticipated to value one support route beside safety relay architectures used in control reviews.
- Volvo Construction Equipment and Liebherr are expected to compete where customers want visibility systems beside enforced work limits. Their portfolios cover excavators used in civil and specialist applications. Engineering teams are anticipated to compare how detection links to operator alerts and how dealers document configurable limits during commissioning.
- Xwatch Safety Solutions and GKD Technologies compete on retrofit breadth for contractors that operate mixed-brand fleets. Both companies focus directly on excavator safety control functions. Rental groups are projected to compare installation time and calibration support because the same machine moves between sites with different boundaries.
- Hitachi Construction Machinery is expected to focus on excavator engineering and connected site workflows. Its value route is anticipated to center on coordination between machine operation and site information. Contractors are projected to review how safety data supports remote supervision across precision hydraulic excavators used on controlled sites.
Competitive Benchmarking: Excavator Safety Interlocks Market
| Company | Safety Control Scope | Factory Integration | Retrofit Fit | Detection Linkage | Service Reach |
|---|---|---|---|---|---|
| Caterpillar | High | High | Medium | High | Global |
| Komatsu | High | High | Medium | High | Global |
| Volvo Construction Equipment | High | High | Medium | High | Global |
| Liebherr | High | High | Medium | High | Global |
| Hitachi Construction Machinery | High | High | Medium | High | Global |
| Xwatch Safety Solutions | High | Medium | Strong | High | Global |
| GKD Technologies | High | Medium | Strong | Medium | Regional; Europe |
Source: Future Market Insights competitive analysis, 2026. Ratings reflect relative portfolio relevance and workflow fit. Service capability and geographic reach shape the remaining comparison.
Key Developments in the Excavator Safety Interlocks Market
- In March 2026, Caterpillar launched the Cat 319 hydraulic excavator with optional Cat Detect functions that alert operators to people around the machine. The product places detection inside a compact-radius excavator platform used on constrained jobsites.
- In December 2025, Volvo Construction Equipment unveiled the ECR355 short-swing excavator with Smart View and People and Obstacle Detection. The system uses 360-degree cameras with radar support to distinguish people from objects around the machine.
- In February 2025, Liebherr introduced the RE 25 M Litronic railroad excavator for Bauma 2025 with person detection and integrated 2D machine control. The machine targets rail construction where clearance limits and worker proximity receive close review.
- In May 2026, Hitachi Construction Machinery announced a joint remote-construction demonstration using a ZX200A-7 20t hydraulic excavator and a real-time digital twin platform. The test links terrain and machine information with worker and vehicle positions for wider site visibility.
Key Players in the Excavator Safety Interlocks Market
Integrated Excavator OEMs
- Caterpillar
- Komatsu
- Volvo Construction Equipment
- Liebherr
- Hitachi Construction Machinery
Retrofit Safety Control Specialists
- Xwatch Safety Solutions
- GKD Technologies
Excavator Safety Interlocks Market - Report Scope
| Coverage field | Report scope |
|---|---|
| Market breakdown | By interlock type, machine type, integration, application, sales channel, and region |
| Market Definition | Safety interlocks and control systems that restrict excavator movement after defined operator or work-zone conditions are breached. |
| Regions Covered | North America, Latin America, Europe, East Asia, South Asia, Oceania, and Middle East and Africa |
| Countries Covered | United States, China, India, Germany, United Kingdom, Japan, South Korea, and 20+ additional countries |
| Key Companies Profiled | Caterpillar, Komatsu, Volvo Construction Equipment, Liebherr, Hitachi Construction Machinery, Xwatch Safety Solutions, and GKD Technologies |
| Forecast Period | 2026 to 2036 |
| Approach | Hybrid methodology using bottom-up installed-base checks and top-down equipment demand reconciliation with primary interviews |
Source: Future Market Insights - analysis driven by proprietary forecasting models and primary research
Excavator Safety Interlocks Market - Research Methodology
| Method | Approach |
|---|---|
| Primary Research | FMI interviews OEM engineering teams and retrofit installers to test adoption assumptions. Rental fleet managers and civil contractors provide another view of service response and field behavior. Discussion guides examine hydraulic compatibility and override control beside technician access. Interview findings are coded by machine age and jobsite type so adoption differences are compared without mixing unlike operating conditions or fleet ownership models. |
| Desk Research | Desk research reviews official equipment statistics and safety guidance alongside technical product documentation. The process checks machine volumes and regional use cases before forecast inputs are accepted. Analysts compare product scope with hydraulic architecture and control function so adjacent machine-control tools are not counted as safety interlocks unless they enforce defined movement limits under stated operating conditions. |
| Market Sizing and Forecasting | The model starts with excavator fleet additions and replacement cycles before estimating the share of machines carrying factory or retrofit interlocks. Adoption curves are reconciled with channel interviews and country activity. Validation assumptions are tested against machine age and service-network coverage so the model does not treat every installed excavator as equally ready for retrofit adoption or factory-integrated safety control. |
| Data Validation | FMI compares interview findings against official equipment statistics and dated technical documentation before finalizing country or segment assumptions. Outliers are challenged against service reach and installed-fleet logic. Analysts review the same assumption from demand and supply perspectives so unusual adoption rates are corrected before forecasts are finalized and adjacent machine-control functions are excluded from the safety-interlock scope. |
Excavator Safety Interlocks Market by Segments
Excavator Safety Interlocks Market segmented by Interlock Type:
- Hydraulic Lockout Interlocks
- Operator Presence Interlocks
- Attachment Recognition Interlocks
- Travel/Swing Lock Interlocks
- Access Door Interlocks
Excavator Safety Interlocks Market segmented by Machine Type:
- Mini Excavators
- Crawler Excavators
- Wheeled Excavators
- Material Handlers
Excavator Safety Interlocks Market segmented by Integration:
- Factory-installed
- Retrofit Kits
- Telematics-linked Safety Modules
Excavator Safety Interlocks Market segmented by Application:
- Construction
- Utilities
- Mining or Quarrying
- Demolition
- Rental Fleet Safety
Excavator Safety Interlocks Market segmented by Sales Channel:
- OEM Fitment
- Dealer Retrofit
- Safety System Integrators
Excavator Safety Interlocks Market by Region:
- North America
- United States
- Canada
- Latin America
- Brazil
- Mexico
- Argentina
- Europe
- Germany
- United Kingdom
- France
- Italy
- Spain
- Nordics
- East Asia
- China
- Japan
- South Korea
- South Asia
- India
- ASEAN
- Oceania
- Australia
- New Zealand
- Middle East and Africa
- GCC Countries
- South Africa
- Türkiye
- Rest of Middle East and Africa
Research Sources and Bibliography
- Association of Equipment Manufacturers. (2025, September). Manufacturers champion SkillsUSA’s heavy equipment operation competition as a valuable industry resource. Association of Equipment Manufacturers.
- BG BAU. (2025, July). Pressemappe zu den Jahreszahlen 2024. Berufsgenossenschaft der Bauwirtschaft.
- Bureau of Labor Statistics. (2026, February). Census of Fatal Occupational Injuries Summary, 2024. USA Department of Labor.
- CPWR-The Center for Construction Research and Training. (2026, April). Struck-by hazards. CPWR.
- Construction Equipment Manufacturers Association. (2026, January). Shipment value statistics of construction equipment for FY2025 (full-year). CEMA.
- Health and Safety Executive. (2026, June). Work-related fatal injuries in Great Britain. Health and Safety Executive.
- Indian Construction Equipment Manufacturers Association. (2025, May). Indian construction equipment industry achieves 3% growth in FY25 driven by strong 10% export surge amid subdued domestic market. ICEMA.
- Ministry of Employment and Labor. (2025, July). Unannounced inspections of high-risk heat workplaces. Republic of Korea Ministry of Employment and Labor.
- Occupational Safety and Health Administration. (2026, April). Top 10 most frequently cited standards. USA Department of Labor.
- Occupational Safety and Health Administration. (2026). Current enforcement summary. USA Department of Labor.
- Occupational Safety and Health Administration. (2026, April). OSHA videos. USA Department of Labor.
- Press Information Bureau. (2025, April). NHAI achieves robust growth in National Highway construction during FY 2024-25. Ministry of Road Transport and Highways.
- CECE Committee for European Construction Equipment. (2026, March). Annual economic report 2026. CECE.
- Caterpillar. (2026, March). Caterpillar launches Cat® 319 to meet growing compact radius demand. Caterpillar.
- GKD Technologies. (2025, September). Series 2 - intelligent load, slew and height control. GKD Technologies.
- Hitachi Construction Machinery Europe. (2025, March). Presenting medium crawler excavators with a difference at Bauma. Hitachi Construction Machinery Europe.
- Hitachi Construction Machinery. (2025, October). Hitachi Construction Machinery releases EX5600-7P ultra-large hydraulic excavator. Hitachi Construction Machinery.
- Liebherr. (2026, January). Significant developments for the Liebherr generation 8 crawler excavators. Liebherr.
- Liebherr. (2026, March). Crawler excavators R 924 G8 and R 945 G8: New evolutions showcase at Conexpo 2026. Liebherr.
- Volvo Construction Equipment. (2025, February). Updated Volvo EC230 Electric boasts full day operation. Volvo Construction Equipment.
- Hitachi Construction Machinery. (2024, March). Hitachi Construction Machinery verification test of Operator Assist System for ultra-large hydraulic excavators at Australian mine site. Hitachi Construction Machinery.
- Leica Geosystems. (2025, March). KOBELCO, Leica Geosystems and Xwatch collaborate to shape the future of remote excavation with K-DIVE® in Europe. Leica Geosystems.
- Leica Geosystems. (2025, April). LiuGong and Leica Geosystems partner to release 3D machine control-ready kit for excavators. Leica Geosystems.
- Leica Geosystems. (2025, April). Shantui and Leica Geosystems announce easy-to-install machine control solutions for new excavator and dozer models. Leica Geosystems.
- Leica Geosystems. (2025, April). Develon and Leica Geosystems launch integrated 3D machine guidance system for excavators. Leica Geosystems.
- Leica Geosystems. (2025, October). Develon and Leica Geosystems expand 3D machine control availability to all 9 Series crawler excavators. Leica Geosystems.
- Hitachi Construction Machinery. (2026, May). Hitachi Construction Machinery begins joint demonstration test of remote construction utilizing a real-time digital twin platform. Hitachi Construction Machinery.
- Komatsu. (2025, September). Komatsu introduces new PC220LC-12 and PC220LCi-12 excavators. Komatsu.
- JCB India. (2025, January). JCB India launches CEV Stage 5 ready machines at the Bharat Construction Equipment Expo. JCB India.
- Tata Hitachi. (2025, December). Tata Hitachi showcases the power of Reliable Orange with next-gen machines and electric HEX at EXCON 2025. Tata Hitachi.
- Liebherr. (2025, February). Setting the course for the future: RE 25 M railroad excavator celebrates its premiere at Bauma 2025. Liebherr.
- Volvo Construction Equipment. (2025, December). Volvo CE unveils new ECR355 short-swing excavator with upgraded precision and efficiency. Volvo Construction Equipment.
- Volvo Construction Equipment. (2026, January). Volvo CE adds short swing model to new gen excavator lineup. Volvo Construction Equipment.
- Xwatch Safety Solutions. (2026, February). Xwatch Safety Solutions, part of Hexagon, and RodRadar unveil industry-first safety-grade system for utility strike prevention. Xwatch Safety Solutions.
- Xwatch Safety Solutions. (2026, March). Xwatch announces Topcon MC-X integration at ConExpo, connecting machine control and on-machine safety. Xwatch Safety Solutions.
- Xwatch Safety Solutions. (2026, April). Closing the gap in excavator lifting safety: where RCI Lite fits. Xwatch Safety Solutions.
This bibliography is provided for reader reference and uses primary government, standards-body, official trade body, and company sources.
This Report Answers
- What is the excavator safety interlocks market value in 2026 and what is the estimated value by 2036?
- What CAGR is the excavator safety interlocks market projected to record from 2026 to 2036?
- Which segments are expected to shape demand across the five parent categories and their subsegments?
- Which worksite pressures are projected to support adoption of enforced motion limits and operator-presence controls?
- How are country CAGRs expected to differ across the seven profiled national outlooks?
- Which companies compete across factory integration and retrofit compatibility while offering detection linkage and service reach?
- How does FMI validate forecasts through hybrid methodology and reconciliation between installed-base evidence and primary interviews?
- Which technical and service factors should fleet managers address before broader account expansion or retrofit commitment?
- How are safety review records and machine-control documentation expected to affect vendor selection during fleet approval?
Frequently Asked Questions
What is driving growth in the Excavator Safety Interlocks Market?
Demand is projected to rise through stricter work-zone controls and utility-strike prevention. Fleet standardization is expected to support factory and retrofit purchases.
Who are the key players in the Excavator Safety Interlocks Market?
Key players include Caterpillar and Komatsu alongside Volvo CE and Liebherr. Hitachi Construction Machinery and specialists Xwatch and GKD Technologies compete on integration and service.
What is a significant restraint in the Excavator Safety Interlocks Market?
A significant restraint is retrofit complexity across mixed machine generations. Adoption is anticipated to slow when calibration records and override rules remain unclear.
Why should fleet executives track the Excavator Safety Interlocks Market?
Fleet executives should track the category because interlock choices affect machine availability and operator accountability. Standardized limits are expected to simplify training across mixed fleets.
What worksite problem does the Excavator Safety Interlocks Market address?
The market addresses unsafe excavator movement near people and underground utilities. Interlocks turn defined hazards into automatic movement limits before operator reaction becomes the only safeguard.
What should fleet managers evaluate before selecting safety interlocks?
Fleet managers should evaluate hydraulic compatibility and override governance. Installation support and calibration records are expected to shape approval across mixed fleets.
What limits return on investment for fleet operators?
Return on investment is expected to weaken when installation causes long downtime or repeat calibration. Unclear override ownership and slow service response are expected to delay fleetwide rollout.
How do providers build long-term fleet confidence?
Providers build confidence by keeping motion limits predictable across attachments and machine starts. Clear training and service ownership support repeat purchases.
Preview the report firsthand - request a free sample
Get SampleGet the brochure for pricing and purchase details.
Get PDFTable of Content
- Key Takeaways
- Market Size and CAGR
- Top Growth Driver
- Fastest Growing Segment
- Leading Region
- Key Companies
- Emerging Opportunities
- Executive Summary
- Global Market Outlook
- Demand-side Trends
- Supply-side Trends
- Technology Roadmap Analysis
- Analysis and Recommendations
- Analyst Perspective (What is happening? Why now? What should investors know?)
- Key Questions Answered
- How large is the market?
- What is the CAGR?
- What are key trends?
- Which region dominates?
- Who are the leaders?
- Market Overview
- Market Coverage / Taxonomy
- Market Definition / Scope / Limitations
- Research Methodology
- Chapter Orientation
- Analytical Lens and Working Hypotheses
- Market Structure, Signals, and Trend Drivers
- Benchmarking and Cross-market Comparability
- Market Sizing, Forecasting, and Opportunity Mapping
- Research Design and Evidence Framework
- Desk Research Programme (Secondary Evidence)
- Expert Input and Fieldwork (Primary Evidence)
- Tooling, Models, and Reference Databases
- Data Engineering and Model Build
- Quality Assurance and Audit Trail
- Market Background
- Market Dynamics (Drivers, Restraints, Opportunity, Trends)
- Scenario Forecast (Optimistic, Likely, Conservative)
- Impact Analysis
- AI Impact
- Sustainability Impact
- Regulatory Impact
- Technology Impact
- Consumer / Buyer Analysis
- Purchase Drivers
- Adoption Barriers
- Buyer Journey
- Opportunity Map Analysis
- Product Life Cycle Analysis
- Supply Chain Analysis
- Investment Feasibility Matrix
- Value Chain Analysis
- PESTLE and Porter's Analysis
- Regulatory Landscape
- Regional Parent Market Outlook
- Production and Consumption Statistics
- Import and Export Statistics
- Global Market Analysis and Forecast, 2021 to 2036
- Historical Market Size Value (USD Million) & Volume (Unit) Analysis, 2021 to 2025
- Current and Future Market Size Value (USD Million) & Volume (Unit) Projections, 2026 to 2036
- Y-o-Y Growth Trend Analysis
- Absolute $ Opportunity Analysis
- Global Market Pricing Analysis, 2021 to 2036
- Global Market Analysis and Forecast, By Interlock Type, 2021 to 2036
- Introduction / Key Findings
- Historical Market Size Value (USD Million) & Volume (Unit) Analysis By Interlock Type, 2021 to 2025
- Current and Future Market Size Value (USD Million) & Volume (Unit) Analysis and Forecast By Interlock Type, 2026 to 2036
- Hydraulic Lockout Interlocks
- Operator Presence Interlocks
- Attachment Recognition Interlocks
- Travel - Swing Lock Interlocks
- Access Door Interlocks
- Hydraulic Lockout Interlocks
- Y-o-Y Growth Trend Analysis By Interlock Type, 2021 to 2025
- Absolute $ Opportunity Analysis By Interlock Type, 2026 to 2036
- Global Market Analysis and Forecast, By Machine Type, 2021 to 2036
- Introduction / Key Findings
- Historical Market Size Value (USD Million) & Volume (Unit) Analysis By Machine Type, 2021 to 2025
- Current and Future Market Size Value (USD Million) & Volume (Unit) Analysis and Forecast By Machine Type, 2026 to 2036
- Crawler Excavators
- Mini Excavators
- Wheeled Excavators
- Material Handlers
- Crawler Excavators
- Y-o-Y Growth Trend Analysis By Machine Type, 2021 to 2025
- Absolute $ Opportunity Analysis By Machine Type, 2026 to 2036
- Global Market Analysis and Forecast, By Integration, 2021 to 2036
- Introduction / Key Findings
- Historical Market Size Value (USD Million) & Volume (Unit) Analysis By Integration, 2021 to 2025
- Current and Future Market Size Value (USD Million) & Volume (Unit) Analysis and Forecast By Integration, 2026 to 2036
- Factory-installed
- Retrofit Kits
- Telematics-linked Safety Modules
- Factory-installed
- Y-o-Y Growth Trend Analysis By Integration, 2021 to 2025
- Absolute $ Opportunity Analysis By Integration, 2026 to 2036
- Global Market Analysis and Forecast, By Application, 2021 to 2036
- Introduction / Key Findings
- Historical Market Size Value (USD Million) & Volume (Unit) Analysis By Application, 2021 to 2025
- Current and Future Market Size Value (USD Million) & Volume (Unit) Analysis and Forecast By Application, 2026 to 2036
- Construction
- Utilities
- Mining - Quarrying
- Demolition
- Rental Fleet Safety
- Construction
- Y-o-Y Growth Trend Analysis By Application, 2021 to 2025
- Absolute $ Opportunity Analysis By Application, 2026 to 2036
- Global Market Analysis and Forecast, By Sales Channel, 2021 to 2036
- Introduction / Key Findings
- Historical Market Size Value (USD Million) & Volume (Unit) Analysis By Sales Channel, 2021 to 2025
- Current and Future Market Size Value (USD Million) & Volume (Unit) Analysis and Forecast By Sales Channel, 2026 to 2036
- OEM Fitment
- Dealer Retrofit
- Safety System Integrators
- OEM Fitment
- Y-o-Y Growth Trend Analysis By Sales Channel, 2021 to 2025
- Absolute $ Opportunity Analysis By Sales Channel, 2026 to 2036
- Global Market Analysis and Forecast, By Region, 2021 to 2036
- Introduction
- Historical Market Size Value (USD Million) & Volume (Unit) Analysis By Region, 2021 to 2025
- Current Market Size Value (USD Million) & Volume (Unit) Analysis and Forecast By Region, 2026 to 2036
- North America
- Latin America
- Europe
- East Asia
- South Asia
- Oceania
- Middle East and Africa
- Market Attractiveness Analysis By Region
- North America Market Analysis and Forecast, By Country, 2021 to 2036
- Historical Market Size Value (USD Million) & Volume (Unit) Trend Analysis By Market Taxonomy, 2021 to 2025
- Market Size Value (USD Million) & Volume (Unit) Forecast By Market Taxonomy, 2026 to 2036
- By Country
- United States
- Canada
- By Interlock Type
- By Machine Type
- By Integration
- By Application
- By Sales Channel
- By Country
- Market Attractiveness Analysis
- By Country
- By Interlock Type
- By Machine Type
- By Integration
- By Application
- By Sales Channel
- Key Takeaways
- Latin America Market Analysis and Forecast, By Country
- Historical Market Size Value (USD Million) & Volume (Unit) Trend Analysis By Market Taxonomy, 2021 to 2025
- Market Size Value (USD Million) & Volume (Unit) Forecast By Market Taxonomy, 2026 to 2036
- By Country
- Brazil
- Mexico
- Argentina
- By Interlock Type
- By Machine Type
- By Integration
- By Application
- By Sales Channel
- By Country
- Market Attractiveness Analysis
- By Country
- By Interlock Type
- By Machine Type
- By Integration
- By Application
- By Sales Channel
- Key Takeaways
- Europe Market Analysis and Forecast, By Country
- Historical Market Size Value (USD Million) & Volume (Unit) Trend Analysis By Market Taxonomy, 2021 to 2025
- Market Size Value (USD Million) & Volume (Unit) Forecast By Market Taxonomy, 2026 to 2036
- By Country
- Germany
- United Kingdom
- France
- Italy
- Spain
- Nordics
- By Interlock Type
- By Machine Type
- By Integration
- By Application
- By Sales Channel
- By Country
- Market Attractiveness Analysis
- By Country
- By Interlock Type
- By Machine Type
- By Integration
- By Application
- By Sales Channel
- Key Takeaways
- East Asia Market Analysis and Forecast, By Country
- Historical Market Size Value (USD Million) & Volume (Unit) Trend Analysis By Market Taxonomy, 2021 to 2025
- Market Size Value (USD Million) & Volume (Unit) Forecast By Market Taxonomy, 2026 to 2036
- By Country
- China
- Japan
- South Korea
- By Interlock Type
- By Machine Type
- By Integration
- By Application
- By Sales Channel
- By Country
- Market Attractiveness Analysis
- By Country
- By Interlock Type
- By Machine Type
- By Integration
- By Application
- By Sales Channel
- Key Takeaways
- South Asia Market Analysis and Forecast, By Country
- Historical Market Size Value (USD Million) & Volume (Unit) Trend Analysis By Market Taxonomy, 2021 to 2025
- Market Size Value (USD Million) & Volume (Unit) Forecast By Market Taxonomy, 2026 to 2036
- By Country
- India
- ASEAN
- By Interlock Type
- By Machine Type
- By Integration
- By Application
- By Sales Channel
- By Country
- Market Attractiveness Analysis
- By Country
- By Interlock Type
- By Machine Type
- By Integration
- By Application
- By Sales Channel
- Key Takeaways
- Oceania Market Analysis and Forecast, By Country
- Historical Market Size Value (USD Million) & Volume (Unit) Trend Analysis By Market Taxonomy, 2021 to 2025
- Market Size Value (USD Million) & Volume (Unit) Forecast By Market Taxonomy, 2026 to 2036
- By Country
- Australia
- New Zealand
- By Interlock Type
- By Machine Type
- By Integration
- By Application
- By Sales Channel
- By Country
- Market Attractiveness Analysis
- By Country
- By Interlock Type
- By Machine Type
- By Integration
- By Application
- By Sales Channel
- Key Takeaways
- Middle East and Africa Market Analysis and Forecast, By Country
- Historical Market Size Value (USD Million) & Volume (Unit) Trend Analysis By Market Taxonomy, 2021 to 2025
- Market Size Value (USD Million) & Volume (Unit) Forecast By Market Taxonomy, 2026 to 2036
- By Country
- GCC Countries
- South Africa
- Türkiye
- Rest of Middle East and Africa
- By Interlock Type
- By Machine Type
- By Integration
- By Application
- By Sales Channel
- By Country
- Market Attractiveness Analysis
- By Country
- By Interlock Type
- By Machine Type
- By Integration
- By Application
- By Sales Channel
- Key Takeaways
- Key Countries Market Analysis
- United States
- Pricing Analysis
- Market Share Analysis, 2025
- By Interlock Type
- By Machine Type
- By Integration
- By Application
- By Sales Channel
- China
- Pricing Analysis
- Market Share Analysis, 2025
- By Interlock Type
- By Machine Type
- By Integration
- By Application
- By Sales Channel
- India
- Pricing Analysis
- Market Share Analysis, 2025
- By Interlock Type
- By Machine Type
- By Integration
- By Application
- By Sales Channel
- Germany
- Pricing Analysis
- Market Share Analysis, 2025
- By Interlock Type
- By Machine Type
- By Integration
- By Application
- By Sales Channel
- United Kingdom
- Pricing Analysis
- Market Share Analysis, 2025
- By Interlock Type
- By Machine Type
- By Integration
- By Application
- By Sales Channel
- Japan
- Pricing Analysis
- Market Share Analysis, 2025
- By Interlock Type
- By Machine Type
- By Integration
- By Application
- By Sales Channel
- South Korea
- Pricing Analysis
- Market Share Analysis, 2025
- By Interlock Type
- By Machine Type
- By Integration
- By Application
- By Sales Channel
- United States
- Market Structure Analysis
- Competition Dashboard
- Competition Benchmarking
- Market Share Analysis of Top Players
- By Regional
- By Interlock Type
- By Machine Type
- By Integration
- By Application
- By Sales Channel
- Emerging Startups
- Innovation Benchmarking
- Competition Analysis
- Competition Deep Dive
- Caterpillar
- Overview
- Product Portfolio
- Profitability by Market Segments (Product/Region/Sales Channel)
- Sales Footprint
- Strategy Overview
- Marketing Strategy
- Product Strategy
- Channel Strategy
- Komatsu
- Volvo Construction Equipment
- Liebherr
- Hitachi Construction Machinery
- Xwatch Safety Solutions
- GKD Technologies
- Caterpillar
- Case Studies
- Success Stories
- Recent Developments
- Competition Deep Dive
- Assumptions & Acronyms Used


