Exosome-Based Skincare Market Size and Share Forecast Outlook 2025 to 2035

The exosome-based skincare market has been valued at USD 852.3 million in 2025 and is projected to advance to USD 3,952.7 million by 2035. This progression reflects an absolute increase of USD 3,100.4 million over the decade, translating into a robust CAGR of 16.6%. Such expansion signals the acceleration of science-driven skincare and the transition toward biologically active formulations.
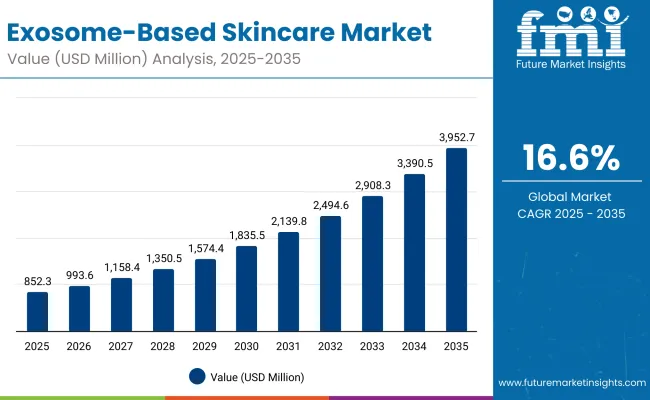
Quick Stats for Exosome-Based Skincare Market

  • Exosome-Based Skincare Market Value (2025): USD 852.3 Million
  • Exosome-Based Skincare Market Forecast Value (2035): USD 3,952.7 Million
  • Exosome-Based Skincare Market Forecast CAGR (2025 to 2035): 16.6%
  • Leading Segment in 2025: Anti-aging Function (53.5% share, USD 455.6 Million)
  • Key Growth Regions: Asia-Pacific (China, Japan, South Korea, India), North America, and Europe
  • Top Key Players: ExoCoBio, ELEVAI Labs, Rohto, L’Oréal, Shiseido, ExoSCRT, Aesthetics Biomedical, Cellexus, CosmoDerm, MediTox

Exosome Based Skincare Market

Exosome-Based Skincare Market Key Takeaways

Metric Value
Market Estimated Value In (2025E) USD 852.3 Million
Market Forecast Value In (2035F) USD 3,952.7 Million
Forecast CAGR (2025 to 2035) 16.60%

During the first phase of growth, from 2025 to 2030, the market is forecast to expand from USD 852.3 million to USD 1,835.5 million. This period adds nearly USD 983.2 million, which accounts for around one-third of the decade’s total value creation. Growth is expected to be steady, led by greater adoption of regenerative skincare solutions, early commercialization of exosome-derived actives, and rising investments in clinical validation. Professional channels, including dermatology and aesthetics clinics, are anticipated to hold a strong position as trusted points of introduction, ensuring sustained consumer awareness and confidence.

The second half of the forecast horizon, from 2030 to 2035, is projected to witness an accelerated growth trajectory, with market value climbing from USD 1,835.5 million to USD 3,952.7 million. This period alone will contribute nearly USD 2,117.2 million, which equals more than two-thirds of total decade expansion. Acceleration is expected to be supported by broader consumer acceptance, deeper penetration into direct-to-consumer retail, and the scaling of synthetic and engineered exosome technologies that ensure consistency, purity, and cost efficiency.

Overall, the exosome-based skincare industry is positioned as one of the fastest-growing categories in advanced cosmeceuticals, benefiting from the convergence of biotechnology, consumer demand for effective anti-aging solutions, and expanding global distribution networks.

From 2020 to 2024, the market transition toward exosome-derived solutions was shaped by biotech innovation and dermatology integration, paving the way for clinical skincare adoption. Between 2025 and 2035, significant expansion is projected, with clinical-grade exosome serums and regenerative treatments becoming mainstream. Competitive advantage is expected to shift from traditional cosmetic claims toward science-backed formulations, AI-driven personalization, and subscription-based treatment models, as players emphasize ecosystem-driven strategies for sustained growth.

Why the Exosome-Based Skincare Market is growing?

Growth in the exosome-based skincare market is being driven by multiple converging factors that highlight its strong future trajectory. A rising demand for advanced anti-aging and regenerative solutions has been observed, as consumers increasingly prioritize scientifically validated formulations over conventional cosmetics. The ability of exosomes to stimulate cellular communication and repair processes has been positioned as a breakthrough in achieving visible, long-lasting results, which is expected to fuel adoption.

Clinical validation and professional endorsements are also accelerating growth, with dermatology and aesthetics clinics incorporating exosome-based products into treatment protocols. As consumer trust is influenced by clinical efficacy, this channel has created a robust foundation for wider retail and e-commerce penetration. Additionally, advances in biotechnology and scalable manufacturing have improved product stability, purity, and consistency, reducing barriers to commercialization.

Future expansion is expected to be reinforced by rising investment in engineered exosomes that deliver targeted benefits, coupled with increasing regulatory clarity that supports compliant market entry across regions. This alignment of science, consumer demand, and commercialization capability is ensuring sustained growth momentum.

Segmental Analysis

The exosome-based skincare market has been segmented across multiple dimensions to capture the diversity of demand drivers. By function, the market reflects strong consumer interest in anti-aging and regenerative solutions, underpinned by growing awareness of scientifically validated skincare benefits. By channel, distribution remains anchored in clinics and professional outlets, where clinical endorsement enhances credibility, while consumer-facing routes continue to gain momentum.

By product type, formats such as serums have achieved strong acceptance due to their compatibility with daily regimens, while broader product categories complement their use across multiple skin concerns. Together, these segments illustrate how the market’s trajectory is being shaped by scientific innovation, distribution dynamics, and consumer adoption patterns that reinforce exosome-based actives as a transformative category.
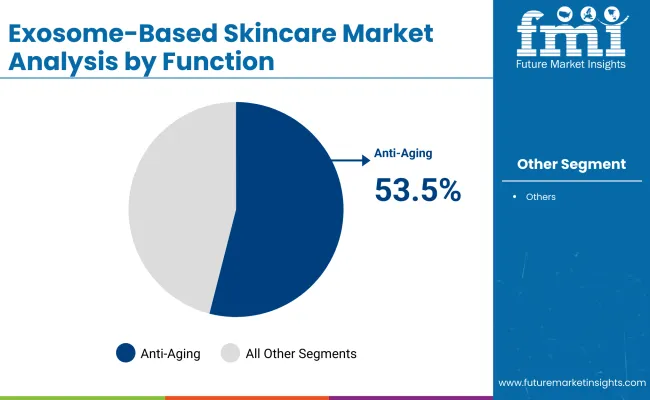
Insights into the Function Segment with Anti-aging Leading in Market Share

Exosome Based Skincare Market By Function

Segment Market Value Share, 2025
Anti-aging 53.50%
Others 46.50%

The function segment is expected to be dominated by anti-aging applications,53.5% of value in 2025, equal to USD 455.6 million. Growth has been driven by rising consumer emphasis on long-term skin health and proven regenerative benefits, with exosomes positioned as advanced actives delivering cellular repair and improved dermal vitality. The ability to stimulate rejuvenation at a cellular level is anticipated to reinforce demand in both professional and consumer markets. Other functions such as hydration, repair, and whitening are expected to play complementary roles, yet anti-aging is projected to retain its dominance given its direct link to premium skincare adoption.
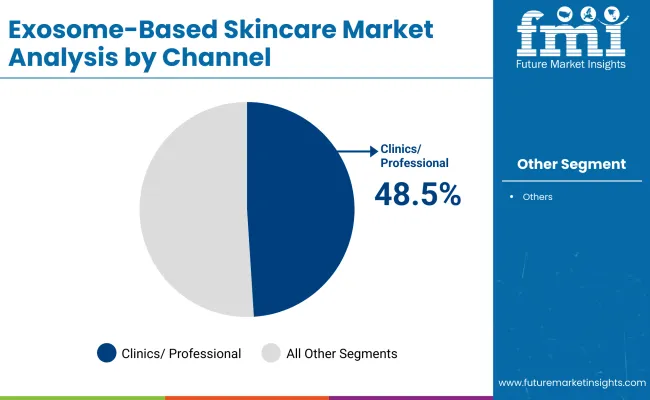
Insights into the Channel Segment with Clinics/Professional Holding Strong Share

Exosome Based Skincare Market By Channel

Segment Market Value Share, 2025
Clinics/professional 48.50%
Others 51.50%

Distribution has been led by clinics and professional outlets, representing 48.5% of 2025 market value at USD 412.1 million. Professional settings have acted as trust anchors, where exosome-based skincare is introduced within dermatology and aesthetic treatments. Clinical endorsements have validated performance claims, building consumer confidence and encouraging repeat usage. While other channels, including specialty retail and online platforms, hold a slightly higher share of 51.5%, clinics are expected to remain critical in educating consumers and driving premium positioning. Over time, professional credibility is projected to enable downstream adoption across wider distribution networks, reinforcing clinics as the foundation of market expansion.
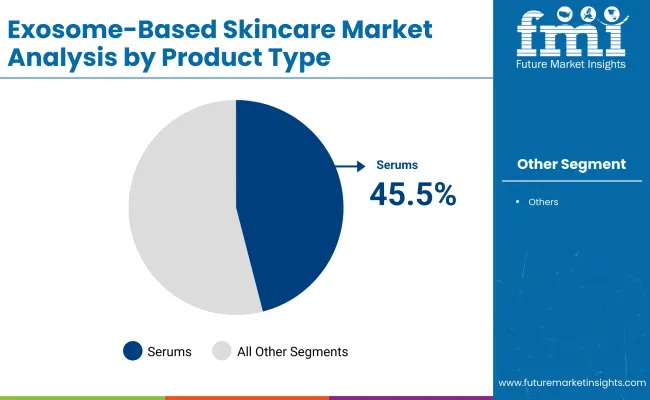
Insights into the Product Type Segment with Serums Gaining Traction

Exosome Based Skincare Market By Product

Segment Market Value Share, 2025
Serums 45.50%
Others 54.50%

and accurate measurements by calculating the geometry of scanned objects based on laser light Within product types, serums have emerged as a significant category, contributing 45.5% of value in 2025, equivalent to USD 386.9 million. Their high compatibility with daily skincare routines, fast absorption, and ability to deliver concentrated actives have established them as a preferred format. Serums have also gained traction across clinics and e-commerce due to their portability and regimen versatility. Other product types collectively accounted for a slightly larger share at 54.5%, reflecting the market’s diversity across creams, patches, and injectables. Nonetheless, serums are projected to remain a growth catalyst, supported by their alignment with consumer trends favoring targeted, science-backed formulations with visible results.

What are the Drivers, Restraints, and Key Trends of the Exosome-Based Skincare Market?

The exosome-based skincare market is advancing through a mix of scientific innovation, clinical acceptance, and consumer adoption. However, regulatory uncertainty, manufacturing complexities, and evolving consumer expectations are shaping both opportunities and challenges across its future growth trajectory.

Integration of Engineered Exosomes for Precision Skincare

The introduction of synthetic and engineered exosomes is being positioned as a transformative driver for market expansion. Unlike traditional plant- or stem cell-derived exosomes, engineered variants offer reproducibility, batch consistency, and targeted delivery of bioactive molecules. This precision is expected to enhance therapeutic relevance, reduce variability, and improve scalability.

Companies leveraging genetic engineering and advanced isolation techniques are anticipated to achieve stronger clinical validation, thereby enabling partnerships with global cosmetics and dermatology brands. Over the forecast horizon, the capability of engineered exosomes to deliver tailored benefits, such as targeted anti-inflammatory or collagen-stimulating effects, is projected to redefine competitive differentiation and accelerate commercialization in both professional and retail channels.

Regulatory Ambiguity Across Global Markets

The absence of harmonized regulatory frameworks for exosome-based skincare products is being recognized as a significant restraint. In many jurisdictions, exosomes exist in a gray area between cosmetics and biologics, leading to uncertainty in approval processes and permissible claims. This ambiguity complicates cross-border commercialization, delays product launches, and increases compliance costs.

Inconsistencies in classification standards across the US, EU, and Asian markets may further limit scalability for smaller firms with limited regulatory capacity. As scrutiny over safety, source ethics, and clinical claims intensifies, companies without robust governance structures may face heightened risk of recalls, litigation, or reputational damage. Until clearer guidelines are established, this regulatory volatility is expected to act as a critical constraint on global expansion.
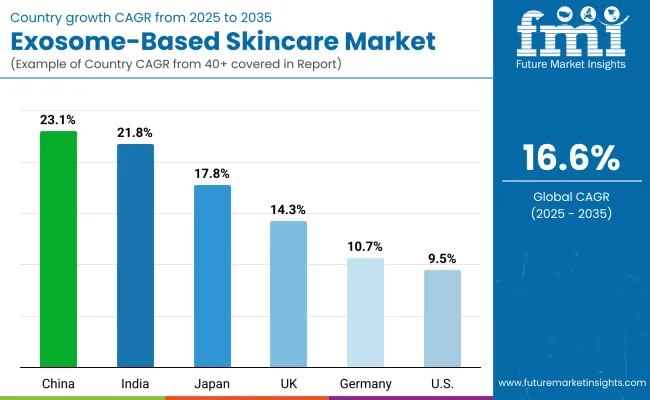
Analysis of Exosome-Based Skincare Market By Key Countries

Exosome Based Skincare Market By Country

Countries CAGR
China 23.1%
USA 9.5%
India 21.8%
UK 14.3%
Germany 10.7%
Japan 17.8%

The exosome-based skincare market demonstrates significant variation in growth potential across leading countries, shaped by consumer readiness, clinical adoption, and regulatory alignment. Asia-Pacific is emerging as the fastest-growing region, with China projected to record a CAGR of 23.1% and India closely following at 21.8% during 2025-2035. In China, strong investment in medical aesthetics, rising consumer preference for science-driven skincare, and a high penetration of professional clinics are expected to anchor its leadership. India’s expansion is anticipated to be powered by growing middle-class affordability, increasing dermatology clinic density, and heightened awareness of anti-aging solutions among younger demographics.

Japan’s market is forecast to grow at 17.8%, supported by advanced biotechnology capabilities, early regulatory frameworks for cosmeceuticals, and a cultural emphasis on anti-aging and skin health. Europe’s outlook remains resilient, with Germany at 10.7% CAGR and the UK at 14.3%, reflecting robust integration of exosome products into dermatology clinics and cosmeceutical innovation pipelines. Stringent compliance requirements and a preference for clinically validated skincare are expected to sustain adoption in these markets.

The United States, despite being a mature skincare market, is projected to grow at a more moderate CAGR of 9.5%. Growth is expected to be driven by increasing use of exosome-based serums in premium dermatology practices and expanding consumer awareness, though regulatory caution may temper rapid expansion.
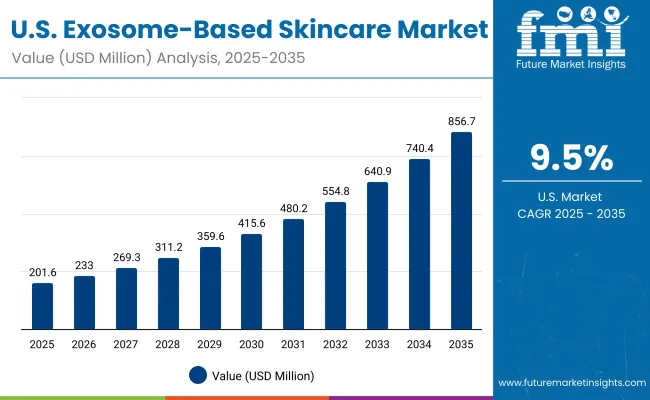
Sales Outlook for Exosome-Based Skincare in the United States

Exosome Based Skincare Market Usa

Year USA Exosome-Based Skincare Market (USD Million)
2025 201.65
2026 233.04
2027 269.31
2028 311.22
2029 359.66
2030 415.61
2031 480.23
2032 554.85
2033 640.99
2034 740.41
2035 856.73

The exosome-based skincare market in the United States is projected to grow at a CAGR of 15.5% between 2025 and 2035, increasing from USD 201.65 million in 2025 to USD 856.73 million by 2035. Growth is expected to be sustained by the integration of exosome-derived actives into clinical dermatology and aesthetics practices, where patient trust in evidence-based formulations is high. Increased availability of exosome-based serums and injectables in professional settings is anticipated to accelerate mainstream adoption, while e-commerce and specialty retail are projected to broaden consumer access.

Market momentum is expected to be reinforced by collaborations between biotechnology developers and established skincare brands, enabling products with higher purity and clinical validation. Regulatory caution may temper the pace of approvals, but growing consumer preference for regenerative, anti-aging, and repair-focused products is likely to offset such barriers. The USA market’s relatively mature structure positions it to lead in innovation-driven adoption rather than volume-led growth, making it a critical hub for technology transfer, clinical trials, and product diversification.

  • Clinics and dermatology centers are anticipated to anchor adoption through trusted endorsements.
  • Premium skincare brands are expected to launch exosome-infused serums tailored for USA consumers.
  • Cross-border partnerships are projected to strengthen innovation pipelines and scale production.

Growth and Expansion Outlook for Exosome-Based Skincare Market in the United Kingdom

The exosome-based skincare market in the United Kingdom is projected to grow at a CAGR of 14.3% from 2025 to 2035, reflecting strong adoption within premium clinical aesthetics and cosmeceutical channels. Expansion is expected to be anchored in dermatology practices and medical spas, where patient trust in science-backed skincare products remains high. Increasing consumer demand for anti-aging solutions and repair-focused formulations is expected to sustain premium pricing across both clinics and retail.

Market adoption is also being supported by the UK’s robust regulatory environment, which places emphasis on safety and clinical validation, thereby reinforcing consumer confidence. Growth opportunities are likely to emerge from e-commerce distribution and strategic collaborations between UK-based dermatology clinics and global biotech firms. By the end of the decade, the UK is positioned to be a leading European hub for innovation-driven adoption rather than volume-led growth.

  • Clinics and medical spas expected to drive premium positioning
  • Anti-aging solutions projected to remain dominant across applications
  • Regulatory credibility anticipated to strengthen market adoption
  • E-commerce likely to expand reach of exosome-based skincare

Growth and Expansion Outlook for Exosome-Based Skincare Market in India

The exosome-based skincare market in India is forecast to expand at a CAGR of 21.8% during 2025-2035, making it one of the fastest-growing global markets. Growth is expected to be underpinned by rapid urbanization, a rising middle-class population, and increasing consumer focus on advanced dermatological treatments. Dermatology and aesthetics clinics are expected to play a pivotal role in early adoption, particularly in metro and tier-1 cities, while e-commerce platforms are anticipated to extend accessibility across wider geographies.

The affordability of regenerative skincare is gradually improving as domestic clinics integrate exosome-based formulations into anti-aging and repair-focused treatments. Partnerships between international biotech firms and Indian cosmeceutical companies are expected to accelerate product introductions at competitive price points. India’s trajectory positions it as a high-potential market where volume-driven growth will combine with rising demand for premium outcomes.

  • Rapid urbanization expected to fuel premium skincare adoption
  • Clinics in metro cities anticipated to anchor early adoption
  • E-commerce projected to democratize access nationwide
  • Partnerships with global biotech firms likely to accelerate commercialization

Sales Outlook for Exosome-Based Skincare in China

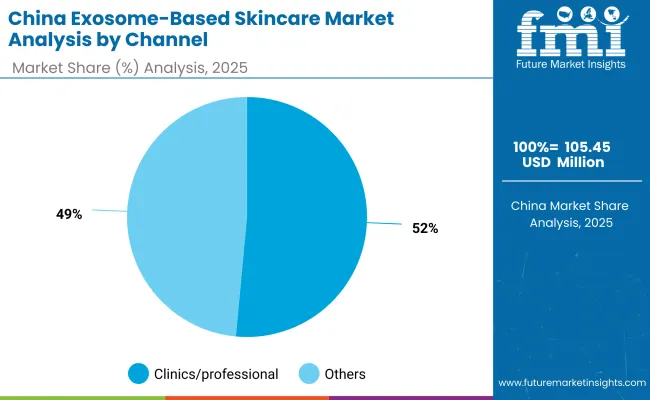
The exosome-based skincare market in China is projected to grow at a CAGR of 23.1% between 2025 and 2035, establishing the country as the fastest-growing market worldwide. Clinics and professional aesthetics centers are expected to account for the majority of adoption, with a value share of more than 50% observed in the base year. Rising consumer willingness to invest in advanced anti-aging and repair solutions is anticipated to sustain premium growth.

Domestic biotech companies are rapidly scaling production capabilities, while collaborations with international skincare leaders are likely to bring new formulations with higher clinical validation. Regulatory developments aimed at cosmeceutical standardization are expected to support long-term adoption, particularly as safety and efficacy concerns are addressed. With a large, youth-driven consumer base and strong demand for visible results, China is projected to remain the epicenter of global market expansion.
  • Professional clinics expected to dominate distribution channels
  • Anti-aging projected as the strongest function category
  • Domestic biotech scaling anticipated to reduce costs
  • Regulatory clarity likely to boost consumer trust and adoption

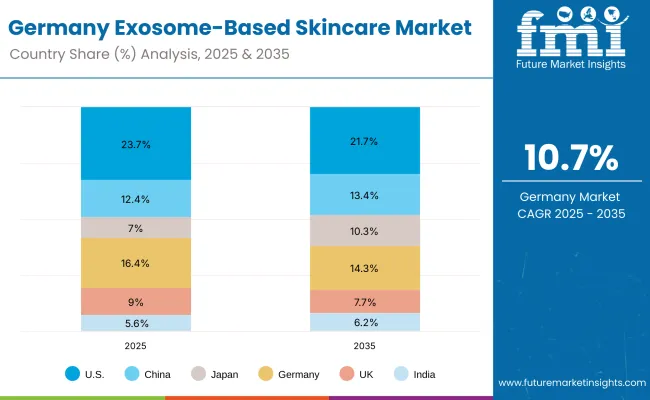
In-depth Analysis of Exosome-Based Skincare in Germany

Exosome Based Skincare Market Germany

Countries 2025
USA 23.7%
China 12.4%
Japan 7.0%
Germany 16.4%
UK 9.0%
India 5.6%
Countries 2035
USA 21.7%
China 13.4%
Japan 10.3%
Germany 14.3%
UK 7.7%
India 6.2%

The exosome-based skincare market in Germany is expected to grow at a CAGR of 10.7% from 2025 to 2035, reflecting moderate but steady expansion. Growth is anticipated to be driven by integration of exosome formulations into clinical dermatology practices and the broader cosmeceutical sector. Germany’s strong emphasis on scientific validation, safety compliance, and consumer health awareness is expected to reinforce trust in exosome-based products.

Market adoption is projected to remain concentrated in anti-aging and skin repair applications, which align closely with consumer demand for science-backed efficacy. Specialty retail and e-commerce are also expected to expand product access, complementing clinics as the leading distribution channels. Despite slower adoption compared to Asian markets, Germany’s mature dermatology ecosystem and stringent regulatory standards are expected to make it a benchmark for clinical credibility and product safety within Europe.
  • Dermatology clinics expected to act as early adoption hubs
  • Regulatory frameworks projected to reinforce consumer trust
  • Anti-aging and repair-focused products anticipated to dominate
  • E-commerce and specialty retail likely to expand accessibility

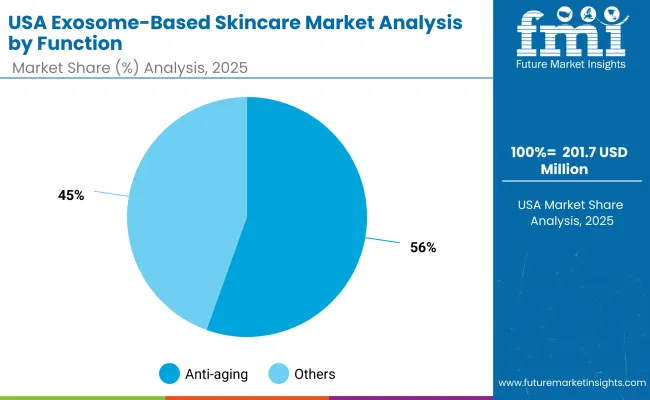
Growth Outlook for Exosome-Based Skincare Market in USA

Exosome Based Skincare Market Usa 2

Segment Market Value Share, 2025
Anti-aging 55.5%
Others 44.5%

The exosome skincare market in the USA is projected at USD 201.7 million in 2025. Anti-aging functions contribute 55.5% (USD 112.0 million), while other functions such as hydration, repair, and whitening collectively hold 44.5% (USD 89.66 million). Demand has been reinforced by a growing consumer focus on clinically validated, regenerative solutions that promise long-term skin vitality. The anti-aging segment has been propelled by rising interest in cellular rejuvenation, driven by dermatology professionals and premium skincare brands positioning exosomes as next-generation actives.

The segment’s growth is expected to be amplified by increased adoption of professional-grade treatments in medspas and dermatology clinics, paired with consumer-facing serums and creams that offer measurable results. Other functional categories are projected to support overall growth as complementary benefits, yet anti-aging is expected to remain the dominant driver due to its direct correlation with premium product adoption and higher willingness to pay.

Greater R&D investment in exosome purification technologies, partnerships between biotech innovators and skincare brands, and regulatory clarity from the FDA are likely to accelerate market maturity. As awareness rises, integrated solutions combining anti-aging, hydration, and repair benefits are anticipated to shape future product launches, creating a strong value proposition for both professional and at-home users.
  • US market share: 201.7 Million in 2025
  • Anti-aging leads at: 55.5% vs 44.5%
  • Growth supported by: Professional treatment uptake, biotech-driven innovation, and regulatory tailwinds enabling premiumization

Opportunity Analysis of China Exosome-Based Skincare Market

Exosome Based Skincare Market China

Segment Market Value Share, 2025
Clinics/professional 51.5%
Others 48.5%

The exosome skincare market in China is projected at USD 105.45 million in 2025. Clinics and professional channels are anticipated to contribute 51.5% (USD 54.3 million), while other channels collectively hold 48.5% (USD 51.15 million). Growth is being driven by the strong uptake of professional-grade exosome treatments in dermatology clinics, aesthetic centers, and medical spas, where trust in clinically validated solutions has been prioritized by Chinese consumers.

Professional channels are expected to dominate as awareness of exosome-based regenerative therapies grows, supported by a rising preference for scientifically backed, procedure-oriented solutions. This channel is forecasted to benefit from enhanced collaborations between biotech innovators and aesthetic practitioners, enabling wider accessibility and adoption.

The “others” segment, comprising retail and direct-to-consumer sales, is projected to act as a complementary growth pillar as exosome formulations transition into mainstream skincare offerings. Digital channels and social commerce are expected to accelerate product penetration, making exosome-based solutions more accessible to younger demographics seeking preventive anti-aging regimens.

Future growth is likely to be reinforced by increased investment in localized manufacturing and regulatory clarity from Chinese authorities, which will build consumer confidence. As hybrid models that combine in-clinic treatments with at-home maintenance kits emerge, the market is anticipated to transition toward an ecosystem-driven approach that maximizes long-term consumer engagement and repeat purchase behavior.
  • China market size: USD 105.45 Million in 2025
  • Clinics/Professional lead at: 51.5% vs 48.5%
  • Growth supported by: Rising clinical adoption, localized biotech collaborations, and omni-channel expansion

Competitive Landscape of Exosome-Based Skincare Market

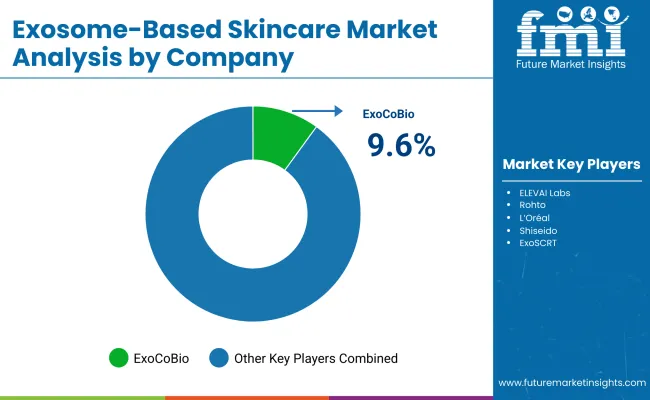
Exosome Based Skincare Market By Company

The Exosome-Based Skincare Market is moderately fragmented, with global leaders, mid-sized innovators, and specialized biotechnology players competing for adoption across clinical, retail, and professional segments. Leading players such as ExoCoBio, L’Oréal, and Shiseido dominate visibility owing to their established R&D, global reach, and strong investment in regenerative skincare solutions. Their strategies increasingly emphasize advanced exosome isolation, clinical validation, and integration of AI-driven personalization platforms. In 2024, ExoCoBio emerged as the market leader, holding approximately 9.6% of the global market share, a position supported by its strong clinical collaborations and its leadership in K-beauty innovation.

Established mid-sized innovators, including ELEVAI Labs, Rohto, and ExoSCRT, are strengthening their positions through targeted product launches and partnerships with dermatology clinics. Their focus on functional cosmetics and clinical-grade solutions enables penetration in both Asian and Western markets. Aesthetics Biomedical, CosmoDerm, and MediTox are further reinforcing competitiveness by aligning exosome science with personalized treatments and medical aesthetics, leveraging evidence-backed formulations.

Niche-focused players such as Cellexus are developing scalable bioprocessing systems for exosome production, contributing indirectly to the ecosystem by improving supply consistency and lowering costs. Competitive differentiation in this market is shifting away from pure product claims toward platform-based ecosystems involving diagnostic integration, clinic training, and subscription-driven skincare regimens.

  • Companies listed (ExoCoBio, ELEVAI Labs, Rohto, L’Oréal, Shiseido, ExoSCRT, Aesthetics Biomedical, Cellexus, CosmoDerm, MediTox) are relevant and active in the exosome-based skincare ecosystem.
  • ExoCoBio dominated the global market in 2024 with 9.6% share, positioning it as the leading company in this emerging segment.

Key Developments in Exosome-Based Skincare Market

  • In February 2025, Genèse Labs France launched Exoluma, an exosome-based skincare product line both human ADSC-derived and plant derived formulations engineered via a patented multi-step purification process to support skin regeneration, collagen synthesis, and post-procedure recovery. Excellence in clinical quality and compliance with ISO and cGMP standards is being emphasized.
  • In January 2025, ExoCoBio expanded into the Indian market with its ASCEplus range tailored for dermatologists and medispas, including both in clinic treatments and athome skincare items. Its technology, based on rose stem cell derived exosomes, is fostering regenerative skincare adoption in a high growth, premium-demand market.

Scope of the Report

Item Value
Market Size (2025) USD 852.3 Million
Market Size (2035) USD 3,952.7 Million
CAGR (2025-2035) 16.60%
Function Segments Anti-aging (USD 455.6 Million, 53.5%), Others (USD 396.0 Million, 46.5%)
Channel Segments Clinics/Professional (USD 412.1 Million, 48.5%), Others (USD 439.1 Million, 51.5%)
Product Type Segments Serums (USD 386.9 Million, 45.5%), Others (USD 464.9 Million, 54.5%)
Regions Covered North America, Europe, Asia-Pacific, Latin America, Middle East & Africa
Countries Covered United States, China, Japan, India, Germany, United Kingdom, South Korea, Brazil
Key Companies Profiled ExoCoBio, ELEVAI Labs, Rohto, L’Oréal, Shiseido, ExoSCRT, Aesthetics Biomedical, Cellexus, CosmoDerm, MediTox
Additional Attributes Rising adoption in anti-aging and regenerative skincare, high demand from clinics, integration of AI-driven personalization, expanding K-beauty exports, increasing biotech investments, and regulatory frameworks supporting cosmeceutical innovation.

Key Segments

By Source:

  • Plant-derived exosomes
  • Stem cell-derived exosomes
  • Synthetic/engineered exosomes

By Function:

  • Anti-aging
  • Repair & regeneration
  • Hydration
  • Whitening

By Product Type:

  • Serums
  • Creams
  • Patches

By Channel:

  • Clinics/professional
  • Specialty retail
  • E-commerce
  • D2C

By Region:

  • North America
  • Latin America
  • Europe
  • East Asia
  • South Asia & Pacific
  • Middle East and Africa

Table of Content

  1. Executive Summary
    • Global Market Outlook
    • Demand-side Trends
    • Supply-side Trends
    • Technology Roadmap Analysis
    • Analysis and Recommendations
  2. Market Overview
    • Market Coverage / Taxonomy
    • Market Definition / Scope / Limitations
  3. Market Background
    • Market Dynamics
      • Drivers
      • Restraints
      • Opportunity
      • Trends
    • Scenario Forecast
      • Demand in Optimistic Scenario
      • Demand in Likely Scenario
      • Demand in Conservative Scenario
    • Opportunity Map Analysis
    • Product Life Cycle Analysis
    • Supply Chain Analysis
      • Supply Side Participants and their Roles
        • Producers
        • Mid-Level Participants (Traders/ Agents/ Brokers)
        • Wholesalers and Distributors
      • Value Added and Value Created at Node in the Supply Chain
      • List of Raw Material Suppliers
      • List of Existing and Potential Buyer’s
    • Investment Feasibility Matrix
    • Value Chain Analysis
      • Profit Margin Analysis
      • Wholesalers and Distributors
      • Retailers
    • PESTLE and Porter’s Analysis
    • Regulatory Landscape
      • By Key Regions
      • By Key Countries
    • Regional Parent Market Outlook
    • Production and Consumption Statistics
    • Import and Export Statistics
  4. Global Market Analysis 2020 to 2024 and Forecast, 2025 to 2035
    • Historical Market Size Value (USD Million) & Volume (Units) Analysis, 2020 to 2024
    • Current and Future Market Size Value (USD Million) & Volume (Units) Projections, 2025 to 2035
      • Y-o-Y Growth Trend Analysis
      • Absolute $ Opportunity Analysis
  5. Global Market Analysis 2020 to 2024 and Forecast 2025 to 2035, By Source
    • Introduction / Key Findings
    • Historical Market Size Value (USD Million) & Volume (Units) Analysis By Source, 2020 to 2024
    • Current and Future Market Size Value (USD Million) & Volume (Units) Analysis and Forecast By Source, 2025 to 2035
      • Plant-derived exosomes
      • Stem cell-derived exosomes
      • Synthetic/engineered exosomes
    • Y-o-Y Growth Trend Analysis By Source, 2020 to 2024
    • Absolute $ Opportunity Analysis By Source, 2025 to 2035
  6. Global Market Analysis 2020 to 2024 and Forecast 2025 to 2035, By Function
    • Introduction / Key Findings
    • Historical Market Size Value (USD Million) & Volume (Units) Analysis By Function, 2020 to 2024
    • Current and Future Market Size Value (USD Million) & Volume (Units) Analysis and Forecast By Function, 2025 to 2035
      • Anti-aging
      • Repair & regeneration
      • Hydration
      • Whitening
    • Y-o-Y Growth Trend Analysis By Function, 2020 to 2024
    • Absolute $ Opportunity Analysis By Function, 2025 to 2035
  7. Global Market Analysis 2020 to 2024 and Forecast 2025 to 2035, By Product Type
    • Introduction / Key Findings
    • Historical Market Size Value (USD Million) & Volume (Units) Analysis By Product Type, 2020 to 2024
    • Current and Future Market Size Value (USD Million) & Volume (Units) Analysis and Forecast By Product Type, 2025 to 2035
      • Serums
      • Creams
      • Patches
    • Y-o-Y Growth Trend Analysis By Product Type, 2020 to 2024
    • Absolute $ Opportunity Analysis By Product Type, 2025 to 2035
  8. Global Market Analysis 2020 to 2024 and Forecast 2025 to 2035, By Channel
    • Introduction / Key Findings
    • Historical Market Size Value (USD Million) & Volume (Units) Analysis By Channel, 2020 to 2024
    • Current and Future Market Size Value (USD Million) & Volume (Units) Analysis and Forecast By Channel, 2025 to 2035
      • Clinics/professional
      • Specialty retail
      • E-commerce
      • D2C
    • Y-o-Y Growth Trend Analysis By Channel, 2020 to 2024
    • Absolute $ Opportunity Analysis By Channel, 2025 to 2035
  9. Global Market Analysis 2020 to 2024 and Forecast 2025 to 2035, By Region
    • Introduction
    • Historical Market Size Value (USD Million) & Volume (Units) Analysis By Region, 2020 to 2024
    • Current Market Size Value (USD Million) & Volume (Units) Analysis and Forecast By Region, 2025 to 2035
      • North America
      • Latin America
      • Europe
      • East Asia
      • South Asia & Pacific
      • Middle East and Africa
    • Market Attractiveness Analysis By Region
  10. North America Market Analysis 2020 to 2024 and Forecast 2025 to 2035, By Country
    • Historical Market Size Value (USD Million) & Volume (Units) Trend Analysis By Market Taxonomy, 2020 to 2024
    • Market Size Value (USD Million) & Volume (Units) Forecast By Market Taxonomy, 2025 to 2035
      • By Country
        • USA
        • Canada
      • By Source
      • By Function
      • By Product Type
      • By Channel
    • Market Attractiveness Analysis
      • By Country
      • By Source
      • By Function
      • By Product Type
      • By Channel
    • Key Takeaways
  11. Latin America Market Analysis 2020 to 2024 and Forecast 2025 to 2035, By Country
    • Historical Market Size Value (USD Million) & Volume (Units) Trend Analysis By Market Taxonomy, 2020 to 2024
    • Market Size Value (USD Million) & Volume (Units) Forecast By Market Taxonomy, 2025 to 2035
      • By Country
        • Brazil
        • Mexico
        • Colombia
        • Rest of Latin America
      • By Source
      • By Function
      • By Product Type
      • By Channel
    • Market Attractiveness Analysis
      • By Country
      • By Source
      • By Function
      • By Product Type
      • By Channel
    • Key Takeaways
  12. Europe Market Analysis 2020 to 2024 and Forecast 2025 to 2035, By Country
    • Historical Market Size Value (USD Million) & Volume (Units) Trend Analysis By Market Taxonomy, 2020 to 2024
    • Market Size Value (USD Million) & Volume (Units) Forecast By Market Taxonomy, 2025 to 2035
      • By Country
        • Germany
        • UK
        • France
        • Italy
        • Spain
        • Belgium
        • Netherlands
        • Nordic
        • Switzerland
        • Russia
        • Poland
        • Rest of Europe
      • By Source
      • By Function
      • By Product Type
      • By Channel
    • Market Attractiveness Analysis
      • By Country
      • By Source
      • By Function
      • By Product Type
      • By Channel
    • Key Takeaways
  13. East Asia Market Analysis 2020 to 2024 and Forecast 2025 to 2035, By Country
    • Historical Market Size Value (USD Million) & Volume (Units) Trend Analysis By Market Taxonomy, 2020 to 2024
    • Market Size Value (USD Million) & Volume (Units) Forecast By Market Taxonomy, 2025 to 2035
      • By Country
        • China
        • Japan
        • South Korea
      • By Source
      • By Function
      • By Product Type
      • By Channel
    • Market Attractiveness Analysis
      • By Country
      • By Source
      • By Function
      • By Product Type
      • By Channel
    • Key Takeaways
  14. South Asia & Pacific Market Analysis 2020 to 2024 and Forecast 2025 to 2035, By Country
    • Historical Market Size Value (USD Million) & Volume (Units) Trend Analysis By Market Taxonomy, 2020 to 2024
    • Market Size Value (USD Million) & Volume (Units) Forecast By Market Taxonomy, 2025 to 2035
      • By Country
        • India
        • Thailand
        • Malaysia
        • Indonesia
        • Singapore
        • Vietnam
        • Australia
        • New Zealand
        • Rest of South Asia
      • By Source
      • By Function
      • By Product Type
      • By Channel
    • Market Attractiveness Analysis
      • By Country
      • By Source
      • By Function
      • By Product Type
      • By Channel
    • Key Takeaways
  15. Middle East and Africa Market Analysis 2020 to 2024 and Forecast 2025 to 2035, By Country
    • Historical Market Size Value (USD Million) & Volume (Units) Trend Analysis By Market Taxonomy, 2020 to 2024
    • Market Size Value (USD Million) & Volume (Units) Forecast By Market Taxonomy, 2025 to 2035
      • By Country
        • Turkey
        • UAE
        • Saudi Arabia
        • Israel
        • Other GCC Countries
        • North Africa
        • South Africa
      • By Source
      • By Function
      • By Product Type
      • By Channel
    • Market Attractiveness Analysis
      • By Country
      • By Source
      • By Function
      • By Product Type
      • By Channel
    • Key Takeaways
  16. Key Countries Market Analysis
    • USA
      • Pricing Analysis
      • Market Share Analysis, 2024
        • By Source
        • By Function
        • By Product Type
        • By Channel
    • Canada
      • Pricing Analysis
      • Market Share Analysis, 2024
        • By Source
        • By Function
        • By Product Type
        • By Channel
    • Brazil
      • Pricing Analysis
      • Market Share Analysis, 2024
        • By Source
        • By Function
        • By Product Type
        • By Channel
    • Mexico
      • Pricing Analysis
      • Market Share Analysis, 2024
        • By Source
        • By Function
        • By Product Type
        • By Channel
    • Colombia
      • Pricing Analysis
      • Market Share Analysis, 2024
        • By Source
        • By Function
        • By Product Type
        • By Channel
    • Germany
      • Pricing Analysis
      • Market Share Analysis, 2024
        • By Source
        • By Function
        • By Product Type
        • By Channel
    • UK
      • Pricing Analysis
      • Market Share Analysis, 2024
        • By Source
        • By Function
        • By Product Type
        • By Channel
    • France
      • Pricing Analysis
      • Market Share Analysis, 2024
        • By Source
        • By Function
        • By Product Type
        • By Channel
    • Italy
      • Pricing Analysis
      • Market Share Analysis, 2024
        • By Source
        • By Function
        • By Product Type
        • By Channel
    • Spain
      • Pricing Analysis
      • Market Share Analysis, 2024
        • By Source
        • By Function
        • By Product Type
        • By Channel
    • Belgium
      • Pricing Analysis
      • Market Share Analysis, 2024
        • By Source
        • By Function
        • By Product Type
        • By Channel
    • Netherlands
      • Pricing Analysis
      • Market Share Analysis, 2024
        • By Source
        • By Function
        • By Product Type
        • By Channel
    • Nordic
      • Pricing Analysis
      • Market Share Analysis, 2024
        • By Source
        • By Function
        • By Product Type
        • By Channel
    • Switzerland
      • Pricing Analysis
      • Market Share Analysis, 2024
        • By Source
        • By Function
        • By Product Type
        • By Channel
    • Russia
      • Pricing Analysis
      • Market Share Analysis, 2024
        • By Source
        • By Function
        • By Product Type
        • By Channel
    • Poland
      • Pricing Analysis
      • Market Share Analysis, 2024
        • By Source
        • By Function
        • By Product Type
        • By Channel
    • China
      • Pricing Analysis
      • Market Share Analysis, 2024
        • By Source
        • By Function
        • By Product Type
        • By Channel
    • Japan
      • Pricing Analysis
      • Market Share Analysis, 2024
        • By Source
        • By Function
        • By Product Type
        • By Channel
    • South Korea
      • Pricing Analysis
      • Market Share Analysis, 2024
        • By Source
        • By Function
        • By Product Type
        • By Channel
    • India
      • Pricing Analysis
      • Market Share Analysis, 2024
        • By Source
        • By Function
        • By Product Type
        • By Channel
    • Thailand
      • Pricing Analysis
      • Market Share Analysis, 2024
        • By Source
        • By Function
        • By Product Type
        • By Channel
    • Indonesia
      • Pricing Analysis
      • Market Share Analysis, 2024
        • By Source
        • By Function
        • By Product Type
        • By Channel
    • Australia
      • Pricing Analysis
      • Market Share Analysis, 2024
        • By Source
        • By Function
        • By Product Type
        • By Channel
    • New Zealand
      • Pricing Analysis
      • Market Share Analysis, 2024
        • By Source
        • By Function
        • By Product Type
        • By Channel
    • Turkey
      • Pricing Analysis
      • Market Share Analysis, 2024
        • By Source
        • By Function
        • By Product Type
        • By Channel
    • UAE
      • Pricing Analysis
      • Market Share Analysis, 2024
        • By Source
        • By Function
        • By Product Type
        • By Channel
    • Saudi Arabia
      • Pricing Analysis
      • Market Share Analysis, 2024
        • By Source
        • By Function
        • By Product Type
        • By Channel
    • Israel
      • Pricing Analysis
      • Market Share Analysis, 2024
        • By Source
        • By Function
        • By Product Type
        • By Channel
    • North Africa
      • Pricing Analysis
      • Market Share Analysis, 2024
        • By Source
        • By Function
        • By Product Type
        • By Channel
    • South Africa
      • Pricing Analysis
      • Market Share Analysis, 2024
        • By Source
        • By Function
        • By Product Type
        • By Channel
  17. Market Structure Analysis
    • Competition Dashboard
    • Competition Benchmarking
    • Market Share Analysis of Top Players
      • By Regional
      • By Source
      • By Function
      • By Product Type
      • By Channel
  18. Competition Analysis
    • Competition Deep Dive
      • ExoCoBio
        • Overview
        • Product Portfolio
        • Profitability by Market Segments (Product/Age /Sales Channel/Region)
        • Sales Footprint
        • Strategy Overview
          • Marketing Strategy
          • Product Strategy
          • Channel Strategy
      • ELEVAI Labs
        • Overview
        • Product Portfolio
        • Profitability by Market Segments (Product/Age /Sales Channel/Region)
        • Sales Footprint
        • Strategy Overview
          • Marketing Strategy
          • Product Strategy
          • Channel Strategy
      • Rohto
        • Overview
        • Product Portfolio
        • Profitability by Market Segments (Product/Age /Sales Channel/Region)
        • Sales Footprint
        • Strategy Overview
          • Marketing Strategy
          • Product Strategy
          • Channel Strategy
      • L’Oréal
        • Overview
        • Product Portfolio
        • Profitability by Market Segments (Product/Age /Sales Channel/Region)
        • Sales Footprint
        • Strategy Overview
          • Marketing Strategy
          • Product Strategy
          • Channel Strategy
      • Shiseido
        • Overview
        • Product Portfolio
        • Profitability by Market Segments (Product/Age /Sales Channel/Region)
        • Sales Footprint
        • Strategy Overview
          • Marketing Strategy
          • Product Strategy
          • Channel Strategy
      • ExoSCRT
        • Overview
        • Product Portfolio
        • Profitability by Market Segments (Product/Age /Sales Channel/Region)
        • Sales Footprint
        • Strategy Overview
          • Marketing Strategy
          • Product Strategy
          • Channel Strategy
      • Aesthetics Biomedical
        • Overview
        • Product Portfolio
        • Profitability by Market Segments (Product/Age /Sales Channel/Region)
        • Sales Footprint
        • Strategy Overview
          • Marketing Strategy
          • Product Strategy
          • Channel Strategy
      • Cellexus
        • Overview
        • Product Portfolio
        • Profitability by Market Segments (Product/Age /Sales Channel/Region)
        • Sales Footprint
        • Strategy Overview
          • Marketing Strategy
          • Product Strategy
          • Channel Strategy
      • CosmoDerm
        • Overview
        • Product Portfolio
        • Profitability by Market Segments (Product/Age /Sales Channel/Region)
        • Sales Footprint
        • Strategy Overview
          • Marketing Strategy
          • Product Strategy
          • Channel Strategy
      • MediTox
        • Overview
        • Product Portfolio
        • Profitability by Market Segments (Product/Age /Sales Channel/Region)
        • Sales Footprint
        • Strategy Overview
          • Marketing Strategy
          • Product Strategy
          • Channel Strategy
      • Others
        • Overview
        • Product Portfolio
        • Profitability by Market Segments (Product/Age /Sales Channel/Region)
        • Sales Footprint
        • Strategy Overview
          • Marketing Strategy
          • Product Strategy
          • Channel Strategy
  19. Assumptions & Acronyms Used
  20. Research Methodology

List of Tables

  • Table 1: Global Market Value (USD Million) Forecast by Region, 2020-2035
  • Table 2: Global Market Volume (Units) Forecast by Region, 2020-2035
  • Table 3: Global Market Value (USD Million) Forecast by Source, 2020-2035
  • Table 4: Global Market Volume (Units) Forecast by Source, 2020-2035
  • Table 5: Global Market Value (USD Million) Forecast by Function, 2020-2035
  • Table 6: Global Market Volume (Units) Forecast by Function, 2020-2035
  • Table 7: Global Market Value (USD Million) Forecast by Product Type, 2020-2035
  • Table 8: Global Market Volume (Units) Forecast by Product Type, 2020-2035
  • Table 9: Global Market Value (USD Million) Forecast by Channel, 2020-2035
  • Table 10: Global Market Volume (Units) Forecast by Channel, 2020-2035
  • Table 11: North America Market Value (USD Million) Forecast by Country, 2020-2035
  • Table 12: North America Market Volume (Units) Forecast by Country, 2020-2035
  • Table 13: North America Market Value (USD Million) Forecast by Source, 2020-2035
  • Table 14: North America Market Volume (Units) Forecast by Source, 2020-2035
  • Table 15: North America Market Value (USD Million) Forecast by Function, 2020-2035
  • Table 16: North America Market Volume (Units) Forecast by Function, 2020-2035
  • Table 17: North America Market Value (USD Million) Forecast by Product Type, 2020-2035
  • Table 18: North America Market Volume (Units) Forecast by Product Type, 2020-2035
  • Table 19: North America Market Value (USD Million) Forecast by Channel, 2020-2035
  • Table 20: North America Market Volume (Units) Forecast by Channel, 2020-2035
  • Table 21: Latin America Market Value (USD Million) Forecast by Country, 2020-2035
  • Table 22: Latin America Market Volume (Units) Forecast by Country, 2020-2035
  • Table 23: Latin America Market Value (USD Million) Forecast by Source, 2020-2035
  • Table 24: Latin America Market Volume (Units) Forecast by Source, 2020-2035
  • Table 25: Latin America Market Value (USD Million) Forecast by Function, 2020-2035
  • Table 26: Latin America Market Volume (Units) Forecast by Function, 2020-2035
  • Table 27: Latin America Market Value (USD Million) Forecast by Product Type, 2020-2035
  • Table 28: Latin America Market Volume (Units) Forecast by Product Type, 2020-2035
  • Table 29: Latin America Market Value (USD Million) Forecast by Channel, 2020-2035
  • Table 30: Latin America Market Volume (Units) Forecast by Channel, 2020-2035
  • Table 31: Europe Market Value (USD Million) Forecast by Country, 2020-2035
  • Table 32: Europe Market Volume (Units) Forecast by Country, 2020-2035
  • Table 33: Europe Market Value (USD Million) Forecast by Source, 2020-2035
  • Table 34: Europe Market Volume (Units) Forecast by Source, 2020-2035
  • Table 35: Europe Market Value (USD Million) Forecast by Function, 2020-2035
  • Table 36: Europe Market Volume (Units) Forecast by Function, 2020-2035
  • Table 37: Europe Market Value (USD Million) Forecast by Product Type, 2020-2035
  • Table 38: Europe Market Volume (Units) Forecast by Product Type, 2020-2035
  • Table 39: Europe Market Value (USD Million) Forecast by Channel, 2020-2035
  • Table 40: Europe Market Volume (Units) Forecast by Channel, 2020-2035
  • Table 41: East Asia Market Value (USD Million) Forecast by Country, 2020-2035
  • Table 42: East Asia Market Volume (Units) Forecast by Country, 2020-2035
  • Table 43: East Asia Market Value (USD Million) Forecast by Source, 2020-2035
  • Table 44: East Asia Market Volume (Units) Forecast by Source, 2020-2035
  • Table 45: East Asia Market Value (USD Million) Forecast by Function, 2020-2035
  • Table 46: East Asia Market Volume (Units) Forecast by Function, 2020-2035
  • Table 47: East Asia Market Value (USD Million) Forecast by Product Type, 2020-2035
  • Table 48: East Asia Market Volume (Units) Forecast by Product Type, 2020-2035
  • Table 49: East Asia Market Value (USD Million) Forecast by Channel, 2020-2035
  • Table 50: East Asia Market Volume (Units) Forecast by Channel, 2020-2035
  • Table 51: South Asia & Pacific Market Value (USD Million) Forecast by Country, 2020-2035
  • Table 52: South Asia & Pacific Market Volume (Units) Forecast by Country, 2020-2035
  • Table 53: South Asia & Pacific Market Value (USD Million) Forecast by Source, 2020-2035
  • Table 54: South Asia & Pacific Market Volume (Units) Forecast by Source, 2020-2035
  • Table 55: South Asia & Pacific Market Value (USD Million) Forecast by Function, 2020-2035
  • Table 56: South Asia & Pacific Market Volume (Units) Forecast by Function, 2020-2035
  • Table 57: South Asia & Pacific Market Value (USD Million) Forecast by Product Type, 2020-2035
  • Table 58: South Asia & Pacific Market Volume (Units) Forecast by Product Type, 2020-2035
  • Table 59: South Asia & Pacific Market Value (USD Million) Forecast by Channel, 2020-2035
  • Table 60: South Asia & Pacific Market Volume (Units) Forecast by Channel, 2020-2035
  • Table 61: Middle East and Africa Market Value (USD Million) Forecast by Country, 2020-2035
  • Table 62: Middle East and Africa Market Volume (Units) Forecast by Country, 2020-2035
  • Table 63: Middle East and Africa Market Value (USD Million) Forecast by Source, 2020-2035
  • Table 64: Middle East and Africa Market Volume (Units) Forecast by Source, 2020-2035
  • Table 65: Middle East and Africa Market Value (USD Million) Forecast by Function, 2020-2035
  • Table 66: Middle East and Africa Market Volume (Units) Forecast by Function, 2020-2035
  • Table 67: Middle East and Africa Market Value (USD Million) Forecast by Product Type, 2020-2035
  • Table 68: Middle East and Africa Market Volume (Units) Forecast by Product Type, 2020-2035
  • Table 69: Middle East and Africa Market Value (USD Million) Forecast by Channel, 2020-2035
  • Table 70: Middle East and Africa Market Volume (Units) Forecast by Channel, 2020-2035Table 1: Global Market Value (USD Million) Forecast by Region, 2020-2035
  • Table 2: Global Market Volume (Units) Forecast by Region, 2020-2035
  • Table 3: Global Market Value (USD Million) Forecast by Source, 2020-2035
  • Table 4: Global Market Volume (Units) Forecast by Source, 2020-2035
  • Table 5: Global Market Value (USD Million) Forecast by Function, 2020-2035
  • Table 6: Global Market Volume (Units) Forecast by Function, 2020-2035
  • Table 7: Global Market Value (USD Million) Forecast by Product Type, 2020-2035
  • Table 8: Global Market Volume (Units) Forecast by Product Type, 2020-2035
  • Table 9: Global Market Value (USD Million) Forecast by Channel, 2020-2035
  • Table 10: Global Market Volume (Units) Forecast by Channel, 2020-2035
  • Table 11: North America Market Value (USD Million) Forecast by Country, 2020-2035
  • Table 12: North America Market Volume (Units) Forecast by Country, 2020-2035
  • Table 13: North America Market Value (USD Million) Forecast by Source, 2020-2035
  • Table 14: North America Market Volume (Units) Forecast by Source, 2020-2035
  • Table 15: North America Market Value (USD Million) Forecast by Function, 2020-2035
  • Table 16: North America Market Volume (Units) Forecast by Function, 2020-2035
  • Table 17: North America Market Value (USD Million) Forecast by Product Type, 2020-2035
  • Table 18: North America Market Volume (Units) Forecast by Product Type, 2020-2035
  • Table 19: North America Market Value (USD Million) Forecast by Channel, 2020-2035
  • Table 20: North America Market Volume (Units) Forecast by Channel, 2020-2035
  • Table 21: Latin America Market Value (USD Million) Forecast by Country, 2020-2035
  • Table 22: Latin America Market Volume (Units) Forecast by Country, 2020-2035
  • Table 23: Latin America Market Value (USD Million) Forecast by Source, 2020-2035
  • Table 24: Latin America Market Volume (Units) Forecast by Source, 2020-2035
  • Table 25: Latin America Market Value (USD Million) Forecast by Function, 2020-2035
  • Table 26: Latin America Market Volume (Units) Forecast by Function, 2020-2035
  • Table 27: Latin America Market Value (USD Million) Forecast by Product Type, 2020-2035
  • Table 28: Latin America Market Volume (Units) Forecast by Product Type, 2020-2035
  • Table 29: Latin America Market Value (USD Million) Forecast by Channel, 2020-2035
  • Table 30: Latin America Market Volume (Units) Forecast by Channel, 2020-2035
  • Table 31: Europe Market Value (USD Million) Forecast by Country, 2020-2035
  • Table 32: Europe Market Volume (Units) Forecast by Country, 2020-2035
  • Table 33: Europe Market Value (USD Million) Forecast by Source, 2020-2035
  • Table 34: Europe Market Volume (Units) Forecast by Source, 2020-2035
  • Table 35: Europe Market Value (USD Million) Forecast by Function, 2020-2035
  • Table 36: Europe Market Volume (Units) Forecast by Function, 2020-2035
  • Table 37: Europe Market Value (USD Million) Forecast by Product Type, 2020-2035
  • Table 38: Europe Market Volume (Units) Forecast by Product Type, 2020-2035
  • Table 39: Europe Market Value (USD Million) Forecast by Channel, 2020-2035
  • Table 40: Europe Market Volume (Units) Forecast by Channel, 2020-2035
  • Table 41: East Asia Market Value (USD Million) Forecast by Country, 2020-2035
  • Table 42: East Asia Market Volume (Units) Forecast by Country, 2020-2035
  • Table 43: East Asia Market Value (USD Million) Forecast by Source, 2020-2035
  • Table 44: East Asia Market Volume (Units) Forecast by Source, 2020-2035
  • Table 45: East Asia Market Value (USD Million) Forecast by Function, 2020-2035
  • Table 46: East Asia Market Volume (Units) Forecast by Function, 2020-2035
  • Table 47: East Asia Market Value (USD Million) Forecast by Product Type, 2020-2035
  • Table 48: East Asia Market Volume (Units) Forecast by Product Type, 2020-2035
  • Table 49: East Asia Market Value (USD Million) Forecast by Channel, 2020-2035
  • Table 50: East Asia Market Volume (Units) Forecast by Channel, 2020-2035
  • Table 51: South Asia & Pacific Market Value (USD Million) Forecast by Country, 2020-2035
  • Table 52: South Asia & Pacific Market Volume (Units) Forecast by Country, 2020-2035
  • Table 53: South Asia & Pacific Market Value (USD Million) Forecast by Source, 2020-2035
  • Table 54: South Asia & Pacific Market Volume (Units) Forecast by Source, 2020-2035
  • Table 55: South Asia & Pacific Market Value (USD Million) Forecast by Function, 2020-2035
  • Table 56: South Asia & Pacific Market Volume (Units) Forecast by Function, 2020-2035
  • Table 57: South Asia & Pacific Market Value (USD Million) Forecast by Product Type, 2020-2035
  • Table 58: South Asia & Pacific Market Volume (Units) Forecast by Product Type, 2020-2035
  • Table 59: South Asia & Pacific Market Value (USD Million) Forecast by Channel, 2020-2035
  • Table 60: South Asia & Pacific Market Volume (Units) Forecast by Channel, 2020-2035
  • Table 61: Middle East and Africa Market Value (USD Million) Forecast by Country, 2020-2035
  • Table 62: Middle East and Africa Market Volume (Units) Forecast by Country, 2020-2035
  • Table 63: Middle East and Africa Market Value (USD Million) Forecast by Source, 2020-2035
  • Table 64: Middle East and Africa Market Volume (Units) Forecast by Source, 2020-2035
  • Table 65: Middle East and Africa Market Value (USD Million) Forecast by Function, 2020-2035
  • Table 66: Middle East and Africa Market Volume (Units) Forecast by Function, 2020-2035
  • Table 67: Middle East and Africa Market Value (USD Million) Forecast by Product Type, 2020-2035
  • Table 68: Middle East and Africa Market Volume (Units) Forecast by Product Type, 2020-2035
  • Table 69: Middle East and Africa Market Value (USD Million) Forecast by Channel, 2020-2035
  • Table 70: Middle East and Africa Market Volume (Units) Forecast by Channel, 2020-2035

List of Figures

  • Figure 1: Global Market Value (USD Million) by Source, 2025-2035
  • Figure 2: Global Market Value (USD Million) by Function, 2025-2035
  • Figure 3: Global Market Value (USD Million) by Product Type, 2025-2035
  • Figure 4: Global Market Value (USD Million) by Channel, 2025-2035
  • Figure 5: Global Market Value (USD Million) by Region, 2025-2035
  • Figure 6: Global Market Value (USD Million) Analysis by Region, 2020-2035
  • Figure 7: Global Market Volume (Units) Analysis by Region, 2020-2035
  • Figure 8: Global Market Value Share (%) and BPS Analysis by Region, 2025-2035
  • Figure 9: Global Market Y-o-Y Growth (%) Projections by Region, 2025-2035
  • Figure 10: Global Market Value (USD Million) Analysis by Source, 2020-2035
  • Figure 11: Global Market Volume (Units) Analysis by Source, 2020-2035
  • Figure 12: Global Market Value Share (%) and BPS Analysis by Source, 2025-2035
  • Figure 13: Global Market Y-o-Y Growth (%) Projections by Source, 2025-2035
  • Figure 14: Global Market Value (USD Million) Analysis by Function, 2020-2035
  • Figure 15: Global Market Volume (Units) Analysis by Function, 2020-2035
  • Figure 16: Global Market Value Share (%) and BPS Analysis by Function, 2025-2035
  • Figure 17: Global Market Y-o-Y Growth (%) Projections by Function, 2025-2035
  • Figure 18: Global Market Value (USD Million) Analysis by Product Type, 2020-2035
  • Figure 19: Global Market Volume (Units) Analysis by Product Type, 2020-2035
  • Figure 20: Global Market Value Share (%) and BPS Analysis by Product Type, 2025-2035
  • Figure 21: Global Market Y-o-Y Growth (%) Projections by Product Type, 2025-2035
  • Figure 22: Global Market Value (USD Million) Analysis by Channel, 2020-2035
  • Figure 23: Global Market Volume (Units) Analysis by Channel, 2020-2035
  • Figure 24: Global Market Value Share (%) and BPS Analysis by Channel, 2025-2035
  • Figure 25: Global Market Y-o-Y Growth (%) Projections by Channel, 2025-2035
  • Figure 26: Global Market Attractiveness by Source, 2025-2035
  • Figure 27: Global Market Attractiveness by Function, 2025-2035
  • Figure 28: Global Market Attractiveness by Product Type, 2025-2035
  • Figure 29: Global Market Attractiveness by Channel, 2025-2035
  • Figure 30: Global Market Attractiveness by Region, 2025-2035
  • Figure 31: North America Market Value (USD Million) by Source, 2025-2035
  • Figure 32: North America Market Value (USD Million) by Function, 2025-2035
  • Figure 33: North America Market Value (USD Million) by Product Type, 2025-2035
  • Figure 34: North America Market Value (USD Million) by Channel, 2025-2035
  • Figure 35: North America Market Value (USD Million) by Country, 2025-2035
  • Figure 36: North America Market Value (USD Million) Analysis by Country, 2020-2035
  • Figure 37: North America Market Volume (Units) Analysis by Country, 2020-2035
  • Figure 38: North America Market Value Share (%) and BPS Analysis by Country, 2025-2035
  • Figure 39: North America Market Y-o-Y Growth (%) Projections by Country, 2025-2035
  • Figure 40: North America Market Value (USD Million) Analysis by Source, 2020-2035
  • Figure 41: North America Market Volume (Units) Analysis by Source, 2020-2035
  • Figure 42: North America Market Value Share (%) and BPS Analysis by Source, 2025-2035
  • Figure 43: North America Market Y-o-Y Growth (%) Projections by Source, 2025-2035
  • Figure 44: North America Market Value (USD Million) Analysis by Function, 2020-2035
  • Figure 45: North America Market Volume (Units) Analysis by Function, 2020-2035
  • Figure 46: North America Market Value Share (%) and BPS Analysis by Function, 2025-2035
  • Figure 47: North America Market Y-o-Y Growth (%) Projections by Function, 2025-2035
  • Figure 48: North America Market Value (USD Million) Analysis by Product Type, 2020-2035
  • Figure 49: North America Market Volume (Units) Analysis by Product Type, 2020-2035
  • Figure 50: North America Market Value Share (%) and BPS Analysis by Product Type, 2025-2035
  • Figure 51: North America Market Y-o-Y Growth (%) Projections by Product Type, 2025-2035
  • Figure 52: North America Market Value (USD Million) Analysis by Channel, 2020-2035
  • Figure 53: North America Market Volume (Units) Analysis by Channel, 2020-2035
  • Figure 54: North America Market Value Share (%) and BPS Analysis by Channel, 2025-2035
  • Figure 55: North America Market Y-o-Y Growth (%) Projections by Channel, 2025-2035
  • Figure 56: North America Market Attractiveness by Source, 2025-2035
  • Figure 57: North America Market Attractiveness by Function, 2025-2035
  • Figure 58: North America Market Attractiveness by Product Type, 2025-2035
  • Figure 59: North America Market Attractiveness by Channel, 2025-2035
  • Figure 60: North America Market Attractiveness by Country, 2025-2035
  • Figure 61: Latin America Market Value (USD Million) by Source, 2025-2035
  • Figure 62: Latin America Market Value (USD Million) by Function, 2025-2035
  • Figure 63: Latin America Market Value (USD Million) by Product Type, 2025-2035
  • Figure 64: Latin America Market Value (USD Million) by Channel, 2025-2035
  • Figure 65: Latin America Market Value (USD Million) by Country, 2025-2035
  • Figure 66: Latin America Market Value (USD Million) Analysis by Country, 2020-2035
  • Figure 67: Latin America Market Volume (Units) Analysis by Country, 2020-2035
  • Figure 68: Latin America Market Value Share (%) and BPS Analysis by Country, 2025-2035
  • Figure 69: Latin America Market Y-o-Y Growth (%) Projections by Country, 2025-2035
  • Figure 70: Latin America Market Value (USD Million) Analysis by Source, 2020-2035
  • Figure 71: Latin America Market Volume (Units) Analysis by Source, 2020-2035
  • Figure 72: Latin America Market Value Share (%) and BPS Analysis by Source, 2025-2035
  • Figure 73: Latin America Market Y-o-Y Growth (%) Projections by Source, 2025-2035
  • Figure 74: Latin America Market Value (USD Million) Analysis by Function, 2020-2035
  • Figure 75: Latin America Market Volume (Units) Analysis by Function, 2020-2035
  • Figure 76: Latin America Market Value Share (%) and BPS Analysis by Function, 2025-2035
  • Figure 77: Latin America Market Y-o-Y Growth (%) Projections by Function, 2025-2035
  • Figure 78: Latin America Market Value (USD Million) Analysis by Product Type, 2020-2035
  • Figure 79: Latin America Market Volume (Units) Analysis by Product Type, 2020-2035
  • Figure 80: Latin America Market Value Share (%) and BPS Analysis by Product Type, 2025-2035
  • Figure 81: Latin America Market Y-o-Y Growth (%) Projections by Product Type, 2025-2035
  • Figure 82: Latin America Market Value (USD Million) Analysis by Channel, 2020-2035
  • Figure 83: Latin America Market Volume (Units) Analysis by Channel, 2020-2035
  • Figure 84: Latin America Market Value Share (%) and BPS Analysis by Channel, 2025-2035
  • Figure 85: Latin America Market Y-o-Y Growth (%) Projections by Channel, 2025-2035
  • Figure 86: Latin America Market Attractiveness by Source, 2025-2035
  • Figure 87: Latin America Market Attractiveness by Function, 2025-2035
  • Figure 88: Latin America Market Attractiveness by Product Type, 2025-2035
  • Figure 89: Latin America Market Attractiveness by Channel, 2025-2035
  • Figure 90: Latin America Market Attractiveness by Country, 2025-2035
  • Figure 91: Europe Market Value (USD Million) by Source, 2025-2035
  • Figure 92: Europe Market Value (USD Million) by Function, 2025-2035
  • Figure 93: Europe Market Value (USD Million) by Product Type, 2025-2035
  • Figure 94: Europe Market Value (USD Million) by Channel, 2025-2035
  • Figure 95: Europe Market Value (USD Million) by Country, 2025-2035
  • Figure 96: Europe Market Value (USD Million) Analysis by Country, 2020-2035
  • Figure 97: Europe Market Volume (Units) Analysis by Country, 2020-2035
  • Figure 98: Europe Market Value Share (%) and BPS Analysis by Country, 2025-2035
  • Figure 99: Europe Market Y-o-Y Growth (%) Projections by Country, 2025-2035
  • Figure 100: Europe Market Value (USD Million) Analysis by Source, 2020-2035
  • Figure 101: Europe Market Volume (Units) Analysis by Source, 2020-2035
  • Figure 102: Europe Market Value Share (%) and BPS Analysis by Source, 2025-2035
  • Figure 103: Europe Market Y-o-Y Growth (%) Projections by Source, 2025-2035
  • Figure 104: Europe Market Value (USD Million) Analysis by Function, 2020-2035
  • Figure 105: Europe Market Volume (Units) Analysis by Function, 2020-2035
  • Figure 106: Europe Market Value Share (%) and BPS Analysis by Function, 2025-2035
  • Figure 107: Europe Market Y-o-Y Growth (%) Projections by Function, 2025-2035
  • Figure 108: Europe Market Value (USD Million) Analysis by Product Type, 2020-2035
  • Figure 109: Europe Market Volume (Units) Analysis by Product Type, 2020-2035
  • Figure 110: Europe Market Value Share (%) and BPS Analysis by Product Type, 2025-2035
  • Figure 111: Europe Market Y-o-Y Growth (%) Projections by Product Type, 2025-2035
  • Figure 112: Europe Market Value (USD Million) Analysis by Channel, 2020-2035
  • Figure 113: Europe Market Volume (Units) Analysis by Channel, 2020-2035
  • Figure 114: Europe Market Value Share (%) and BPS Analysis by Channel, 2025-2035
  • Figure 115: Europe Market Y-o-Y Growth (%) Projections by Channel, 2025-2035
  • Figure 116: Europe Market Attractiveness by Source, 2025-2035
  • Figure 117: Europe Market Attractiveness by Function, 2025-2035
  • Figure 118: Europe Market Attractiveness by Product Type, 2025-2035
  • Figure 119: Europe Market Attractiveness by Channel, 2025-2035
  • Figure 120: Europe Market Attractiveness by Country, 2025-2035
  • Figure 121: East Asia Market Value (USD Million) by Source, 2025-2035
  • Figure 122: East Asia Market Value (USD Million) by Function, 2025-2035
  • Figure 123: East Asia Market Value (USD Million) by Product Type, 2025-2035
  • Figure 124: East Asia Market Value (USD Million) by Channel, 2025-2035
  • Figure 125: East Asia Market Value (USD Million) by Country, 2025-2035
  • Figure 126: East Asia Market Value (USD Million) Analysis by Country, 2020-2035
  • Figure 127: East Asia Market Volume (Units) Analysis by Country, 2020-2035
  • Figure 128: East Asia Market Value Share (%) and BPS Analysis by Country, 2025-2035
  • Figure 129: East Asia Market Y-o-Y Growth (%) Projections by Country, 2025-2035
  • Figure 130: East Asia Market Value (USD Million) Analysis by Source, 2020-2035
  • Figure 131: East Asia Market Volume (Units) Analysis by Source, 2020-2035
  • Figure 132: East Asia Market Value Share (%) and BPS Analysis by Source, 2025-2035
  • Figure 133: East Asia Market Y-o-Y Growth (%) Projections by Source, 2025-2035
  • Figure 134: East Asia Market Value (USD Million) Analysis by Function, 2020-2035
  • Figure 135: East Asia Market Volume (Units) Analysis by Function, 2020-2035
  • Figure 136: East Asia Market Value Share (%) and BPS Analysis by Function, 2025-2035
  • Figure 137: East Asia Market Y-o-Y Growth (%) Projections by Function, 2025-2035
  • Figure 138: East Asia Market Value (USD Million) Analysis by Product Type, 2020-2035
  • Figure 139: East Asia Market Volume (Units) Analysis by Product Type, 2020-2035
  • Figure 140: East Asia Market Value Share (%) and BPS Analysis by Product Type, 2025-2035
  • Figure 141: East Asia Market Y-o-Y Growth (%) Projections by Product Type, 2025-2035
  • Figure 142: East Asia Market Value (USD Million) Analysis by Channel, 2020-2035
  • Figure 143: East Asia Market Volume (Units) Analysis by Channel, 2020-2035
  • Figure 144: East Asia Market Value Share (%) and BPS Analysis by Channel, 2025-2035
  • Figure 145: East Asia Market Y-o-Y Growth (%) Projections by Channel, 2025-2035
  • Figure 146: East Asia Market Attractiveness by Source, 2025-2035
  • Figure 147: East Asia Market Attractiveness by Function, 2025-2035
  • Figure 148: East Asia Market Attractiveness by Product Type, 2025-2035
  • Figure 149: East Asia Market Attractiveness by Channel, 2025-2035
  • Figure 150: East Asia Market Attractiveness by Country, 2025-2035
  • Figure 151: South Asia & Pacific Market Value (USD Million) by Source, 2025-2035
  • Figure 152: South Asia & Pacific Market Value (USD Million) by Function, 2025-2035
  • Figure 153: South Asia & Pacific Market Value (USD Million) by Product Type, 2025-2035
  • Figure 154: South Asia & Pacific Market Value (USD Million) by Channel, 2025-2035
  • Figure 155: South Asia & Pacific Market Value (USD Million) by Country, 2025-2035
  • Figure 156: South Asia & Pacific Market Value (USD Million) Analysis by Country, 2020-2035
  • Figure 157: South Asia & Pacific Market Volume (Units) Analysis by Country, 2020-2035
  • Figure 158: South Asia & Pacific Market Value Share (%) and BPS Analysis by Country, 2025-2035
  • Figure 159: South Asia & Pacific Market Y-o-Y Growth (%) Projections by Country, 2025-2035
  • Figure 160: South Asia & Pacific Market Value (USD Million) Analysis by Source, 2020-2035
  • Figure 161: South Asia & Pacific Market Volume (Units) Analysis by Source, 2020-2035
  • Figure 162: South Asia & Pacific Market Value Share (%) and BPS Analysis by Source, 2025-2035
  • Figure 163: South Asia & Pacific Market Y-o-Y Growth (%) Projections by Source, 2025-2035
  • Figure 164: South Asia & Pacific Market Value (USD Million) Analysis by Function, 2020-2035
  • Figure 165: South Asia & Pacific Market Volume (Units) Analysis by Function, 2020-2035
  • Figure 166: South Asia & Pacific Market Value Share (%) and BPS Analysis by Function, 2025-2035
  • Figure 167: South Asia & Pacific Market Y-o-Y Growth (%) Projections by Function, 2025-2035
  • Figure 168: South Asia & Pacific Market Value (USD Million) Analysis by Product Type, 2020-2035
  • Figure 169: South Asia & Pacific Market Volume (Units) Analysis by Product Type, 2020-2035
  • Figure 170: South Asia & Pacific Market Value Share (%) and BPS Analysis by Product Type, 2025-2035
  • Figure 171: South Asia & Pacific Market Y-o-Y Growth (%) Projections by Product Type, 2025-2035
  • Figure 172: South Asia & Pacific Market Value (USD Million) Analysis by Channel, 2020-2035
  • Figure 173: South Asia & Pacific Market Volume (Units) Analysis by Channel, 2020-2035
  • Figure 174: South Asia & Pacific Market Value Share (%) and BPS Analysis by Channel, 2025-2035
  • Figure 175: South Asia & Pacific Market Y-o-Y Growth (%) Projections by Channel, 2025-2035
  • Figure 176: South Asia & Pacific Market Attractiveness by Source, 2025-2035
  • Figure 177: South Asia & Pacific Market Attractiveness by Function, 2025-2035
  • Figure 178: South Asia & Pacific Market Attractiveness by Product Type, 2025-2035
  • Figure 179: South Asia & Pacific Market Attractiveness by Channel, 2025-2035
  • Figure 180: South Asia & Pacific Market Attractiveness by Country, 2025-2035
  • Figure 181: Middle East and Africa Market Value (USD Million) by Source, 2025-2035
  • Figure 182: Middle East and Africa Market Value (USD Million) by Function, 2025-2035
  • Figure 183: Middle East and Africa Market Value (USD Million) by Product Type, 2025-2035
  • Figure 184: Middle East and Africa Market Value (USD Million) by Channel, 2025-2035
  • Figure 185: Middle East and Africa Market Value (USD Million) by Country, 2025-2035
  • Figure 186: Middle East and Africa Market Value (USD Million) Analysis by Country, 2020-2035
  • Figure 187: Middle East and Africa Market Volume (Units) Analysis by Country, 2020-2035
  • Figure 188: Middle East and Africa Market Value Share (%) and BPS Analysis by Country, 2025-2035
  • Figure 189: Middle East and Africa Market Y-o-Y Growth (%) Projections by Country, 2025-2035
  • Figure 190: Middle East and Africa Market Value (USD Million) Analysis by Source, 2020-2035
  • Figure 191: Middle East and Africa Market Volume (Units) Analysis by Source, 2020-2035
  • Figure 192: Middle East and Africa Market Value Share (%) and BPS Analysis by Source, 2025-2035
  • Figure 193: Middle East and Africa Market Y-o-Y Growth (%) Projections by Source, 2025-2035
  • Figure 194: Middle East and Africa Market Value (USD Million) Analysis by Function, 2020-2035
  • Figure 195: Middle East and Africa Market Volume (Units) Analysis by Function, 2020-2035
  • Figure 196: Middle East and Africa Market Value Share (%) and BPS Analysis by Function, 2025-2035
  • Figure 197: Middle East and Africa Market Y-o-Y Growth (%) Projections by Function, 2025-2035
  • Figure 198: Middle East and Africa Market Value (USD Million) Analysis by Product Type, 2020-2035
  • Figure 199: Middle East and Africa Market Volume (Units) Analysis by Product Type, 2020-2035
  • Figure 200: Middle East and Africa Market Value Share (%) and BPS Analysis by Product Type, 2025-2035
  • Figure 201: Middle East and Africa Market Y-o-Y Growth (%) Projections by Product Type, 2025-2035
  • Figure 202: Middle East and Africa Market Value (USD Million) Analysis by Channel, 2020-2035
  • Figure 203: Middle East and Africa Market Volume (Units) Analysis by Channel, 2020-2035
  • Figure 204: Middle East and Africa Market Value Share (%) and BPS Analysis by Channel, 2025-2035
  • Figure 205: Middle East and Africa Market Y-o-Y Growth (%) Projections by Channel, 2025-2035
  • Figure 206: Middle East and Africa Market Attractiveness by Source, 2025-2035
  • Figure 207: Middle East and Africa Market Attractiveness by Function, 2025-2035
  • Figure 208: Middle East and Africa Market Attractiveness by Product Type, 2025-2035
  • Figure 209: Middle East and Africa Market Attractiveness by Channel, 2025-2035
  • Figure 210: Middle East and Africa Market Attractiveness by Country, 2025-2035

Frequently Asked Questions

How big is the Exosome-Based Skincare Market in 2025?

The global Exosome-Based Skincare Market is estimated to be valued at USD 852.3 million in 2025.

What will be the size of the Exosome-Based Skincare Market in 2035?

The market size for the Exosome-Based Skincare Market is projected to reach USD 3,952.7 million by 2035.

How much will the Exosome-Based Skincare Market grow between 2025 and 2035?

The Exosome-Based Skincare Market is expected to grow at a CAGR of 16.6% between 2025 and 2035.

What are the key product types in the Exosome-Based Skincare Market?

The key product types in the Exosome-Based Skincare Market are Serums (45.5% share, USD 386.9 Million) and Other formulations (54.5% share, USD 464.9 Million).

Which channel segment will contribute significant share in the Exosome-Based Skincare Market in 2025?

In terms of channel, Clinics/Professional outlets are projected to command 48.5% share (USD 412.1 Million) of the market in 2025.

Explore Similar Insights

Future Market Insights

Exosome-Based Skincare Market

Chat With

MaRIA

Hi There, I am MaRIA, Your Market Research Intelligence Assistant. How may I help you?