Ferulic Acid Market Size and Share Forecast Outlook 2025 to 2035

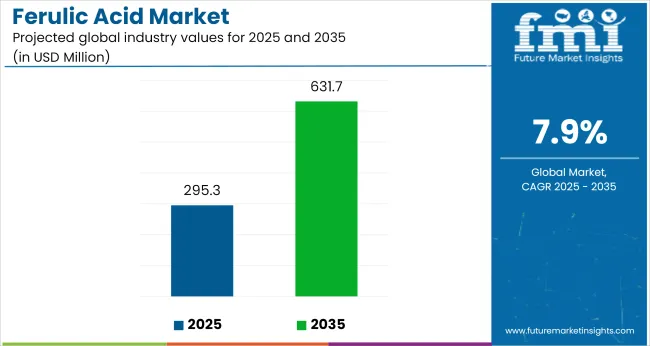
The global ferulic acid market is projected to grow from USD 295.3 million in 2025 to USD 631.7 million by 2035, registering a CAGR of 7.9%. Market expansion is driven by increasing demand across skincare, pharmaceuticals, and functional food industries.
Quick Stats for Ferulic Acid Market

  • Market Value (2025): USD 295.3 million
  • Forecast Value (2035): USD 631.7 million
  • Forecast CAGR: 7.9%
  • Source Type Leader in 2025: Cereal Grains (52% market share)
  • Top Purity Segment: Medium Purity (45% share)
  • Key Growth Region: North America (USA is the fastest-growing market with an 8% CAGR)

Ferulic Acid Market Industry Value Analysis

Metric Value
Industry Size (2025E) USD 295.3 million
Industry Value (2035F) USD 631.7 million
CAGR (2025 to 2035) 7.9%

Rising awareness regarding antioxidant, anti-aging, and stabilizing benefits is prompting ferulic acid’s integration into high-grade skincare serums, food fortification, and health supplements. Technological advances in extraction and synthetic production are improving yields, reducing costs, and ensuring consistent purity levels, supporting broader adoption.

The market holds an estimated 18% share in the functional food ingredients market, driven by its antioxidant stabilizing properties for food fortification and preservation. It commands approximately 12% of the cosmetic active ingredients market due to proven anti-aging applications in serums, creams, and UV-protection formulations.

Within the natural antioxidants market, it contributes around 10%, emphasizing its importance in oxidative stability and product life extension. However, in the expansive pharmaceutical API market, its share is small at 0.5%, reflecting specialized but limited therapeutic applications compared to broader APIs.

Government regulations impacting the market focus on food-grade safety standards, permissible antioxidant usage levels, and cosmetic ingredient approvals. The European Union Cosmetics Regulation (EC) No 1223/2009 outlines safety assessment requirements for actives like ferulic acid, while the USA FDA recognizesferulic acid as GRAS for specific food applications. Such regulations drive adoption of high-purity ferulic acid, ensuring product safety and efficacy in global consumer markets.

The USA market is projected to grow at the fastest rate with a CAGR of 8% from 2025 to 2035. Cereal grains will lead the source type segment with a 52% share, while medium purity will dominate the purity segment with a 45% share. Japan is expected to be the fastest-growing market with a CAGR of 7.7%, while Germany is projected to expand at a CAGR of 7.4% during the forecast period.

Analyzing Ferulic Acid Market by Top Investment Segments

The market is segmented by source type, purity level, application, and region. By source type, the market is divided into cereal grains, fruits & vegetables, herbs & spices, and synthetic production. By purity level, the market is classified into low purity, medium purity, and high purity.

Based on application, the market is segmented into food & beverage, pharmaceuticals, cosmetics & personal care, agriculture, and industrial. Regionally, the market is classified into North America, Latin America, Western Europe, Eastern Europe, Balkans & Baltic, Russia & Belarus, Central Asia, East Asia, South Asia & Pacific, Middle East & Africa.

Cereal Grains to Lead the Source Type Segment with 52% Market Share

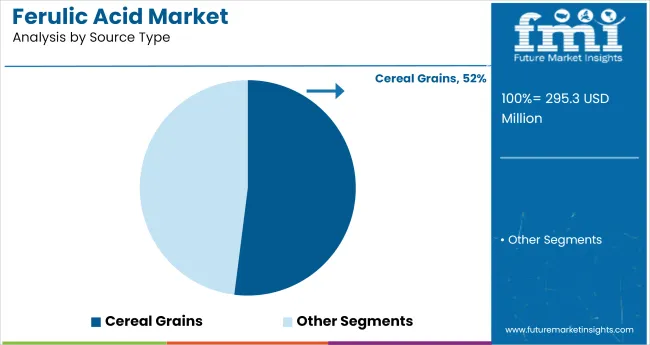
Cereal grains are projected to lead the source type segment, capturing 52% of the market share by 2025. Rice bran and wheat bran are widely used due to their high ferulic acid content and abundant availability.
  • Easily sourced from rice and wheat bran, providing cost-efficient raw materials.
  • Rising consumer preference for naturally sourced antioxidants drives growth in this segment.

Ferulic Acid Market Analysis By Source Type

Medium Purity to Capture the Purity Level Segment with 45% Market Share

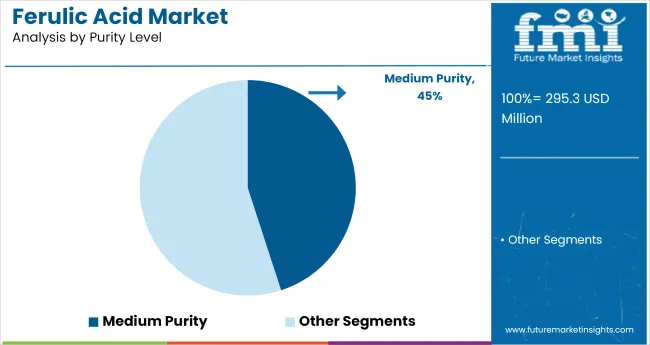
Medium purity is projected to capture 45% of the market share in 2025. It balances cost-effectiveness and efficacy, making it suitable for various food, beverage, and cosmetic formulations.
  • Preferred for food preservation, functional foods, and mid-tier cosmetic products.
  • Offers regulatory compliance while remaining economical for mass-market applications.

Ferulic Acid Market Analysis By Purity Level

Food & Beverage to Lead the Application Segment with 40% Market Share

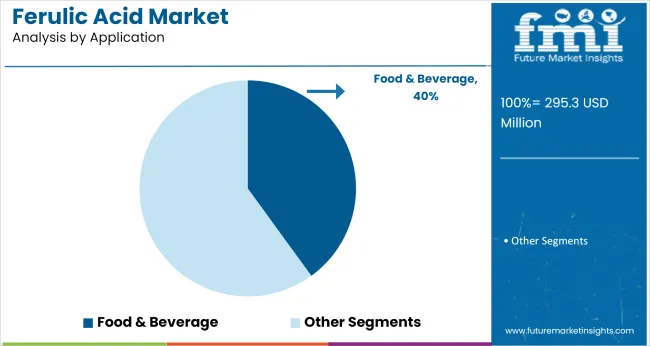
The food & beverage segment is expected to dominate the application segment, accounting for 40% of the market share by 2025. Ferulic acid is widely used as a natural antioxidant and preservative in food products.
  • Enhances shelf life and maintains nutritional stability in processed foods.
  • Growing demand for functional foods and natural additives supports segment expansion.

Ferulic Acid Market Analysis By Application

Top Ferulic Acid Market Dynamics

The global ferulic acid market is experiencing steady growth, driven by rising demand for natural antioxidants and anti-aging ingredients across food, cosmetics, and pharmaceutical applications. Growth is further supported by innovations in botanical extraction, expanded use in nutricosmetics, and regulatory alignment favoring plant-based preservatives.

Recent Trends in the Ferulic Acid Market

  • Growth in synthetic production to ensure consistent purity for premium skincare formulations.
  • Increased extraction of ferulic acid from rice bran and wheat bran to meet clean-label product preferences.

Challenges in the Ferulic Acid Market

  • Volatile prices of agricultural raw materials affect natural extraction-based production costs.
  • Stringent regulatory approvals for pharmaceutical grade ferulic acid limit market entry for new players.

Top Countries Manufacturing, Regulating, and Driving Demand for Ferulic Acid

Japan’s growth is shaped by cosmeceutical innovation, pharmaceutical-grade purity standards, and investments in antioxidant synergy research. Germany and France sustain stable demand under EU regulations promoting natural preservatives and anti-aging actives. In contrast, mature economies such as the USA (8% CAGR), UK (7.2%), and Japan (7.7%) are expanding at a consistent 0.91-1.00x of the global growth rate.

Japan leads in high-purity ferulic acid use for premium serums and sunscreen formulations, supported by advanced skincare manufacturing. Germany and France anchor demand in anti-aging cosmetics and functional food additives, reinforced by strict EU ingredient safety mandates.

The USA market drives forward with wide-scale adoption in nutraceuticals and fortified beverages, aided by GRAS status and clean-label preferences. The UK shows strength in natural skincare and organic food formulations. As the market is set to gain over USD 336 million by 2035, regions prioritizing cosmetic innovation and natural antioxidant regulation are expected to shape future growth.

The report includes in-depth analysis of 40+ countries; five top-performing OECD countries are highlighted below.

In-depth Analysis of Ferulic Acid Demand in France

The French ferulic acid market is projected to grow at a CAGR of 7.1% from 2025 to 2035. Growth is driven by premium skincare, pharmaceuticals, and functional food applications. France emphasizes high purity ferulic acid for anti-aging cosmetics, supported by EU regulatory frameworks. Functional food manufacturers use ferulic acid for shelf-life extension and antioxidant benefits.

  • High demand from premium cosmetic brands (anti-aging serums, creams).
  • Adoption in fortified foods and dietary supplements.
  • Strict EU ingredient safety and quality regulations.

Growth Outlook for Ferulic Acid in Japan

The demand for ferulic acid in Japan is expected to expand at a CAGR of 7.7% from 2025 to 2035. Growth is driven by advanced skincare formulations, cosmeceuticals, and pharmaceuticals. Japan focuses on high-purity ferulic acid for premium serums and sunscreens due to its proven antioxidant synergy with vitamins C and E.

  • Major applications in scientific anti-aging skincare.
  • Investments in purification and formulation R&D.
  • Strong domestic cosmetic manufacturing and innovation ecosystem.

Ferulic Acid Industrial Demand in Germany

The demand for ferulic acid in Germany is projected to grow at a CAGR of 7.4% from 2025 to 2035. Growth is driven by antioxidant use in food preservation, nutraceuticals, and skincare. Germany enforces strict EU standards ensuring ingredient safety, benefiting high-grade ferulic acid producers and importers.

  • Utilized in natural food preservatives and stabilizers.
  • Cosmetic brands focus on anti-aging formulations.
  • Strong regulatory compliance under EU Cosmetic Regulation.

Ferulic Acid Demand Trajectory in the USA

The USA ferulic acid market is projected to grow at an 8% CAGR from 2025 to 2035. Growth is supported by rising functional food antioxidants, nutraceutical applications, and premium skincare products. GRAS status supports food use, while skincare formulators use it for UV-stabilizing anti-aging serums.

  • High adoption in fortified beverages and cereals.
  • Skincare brands integrate ferulic acid in anti-aging serums.
  • Regulatory acceptance drives diverse application growth.

Ferulic Acid Trends in the UK

The UK ferulic acid revenue is projected to grow at a CAGR of 7.2% from 2025 to 2035. Growth is driven by demand in natural skincare and clean-label food products. Brands prefer rice bran-derived ferulic acid to align with natural and organic consumer trends.

  • Rising use in natural anti-aging skincare ranges.
  • Adoption in clean-label food and drink formulations.
  • Compliance with food and cosmetic safety standards.

Leading Ferulic Acid Suppliers and Manufacturers

The market is moderately consolidated, with leading players like Aktin Chemicals Inc., Spectrum Chemical Manufacturing Corp., Pfaltz & Bauer, Inc., Tianjin NWC Biotechnology Co., Ltd., and Shanghai Winhere Biopharma Co., Ltd. dominating the industry.

These companies provide high-purity ferulic acid catering to industries such as pharmaceuticals, cosmetics, and food additives. Aktin Chemicals Inc. focuses on botanical extraction and pharmaceutical-grade ferulic acid, while Spectrum Chemical Manufacturing Corp. supplies research and industrial-grade ferulic acid across applications.

Pfaltz & Bauer, Inc. delivers specialty chemicals with a focus on custom sourcing for laboratory use. Tianjin NWC Biotechnology Co., Ltd. and Shanghai Winhere Biopharma Co., Ltd. are known for large-scale production of high-purity ferulic acid for cosmetic formulations.
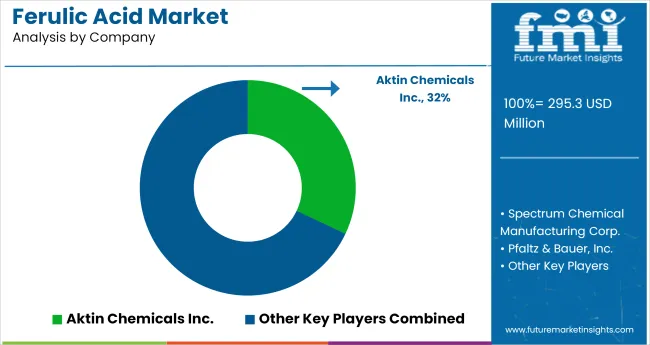
Ferulic Acid Market Analysis By Company

Recent Ferulic Acid Industry News

  • In January 2024, Tsuno Group and Matsumoto Trading developed a patent-pending sunscreen stick using high-concentration ferulic acid extracted from rice bran. The innovation replaces petrochemical UV filters, offering SPF 50+ protection with enhanced stability, marking a first-in-class natural UV-absorbing formulation.

Ferulic Acid Market Report Scope

Report Attributes Details
Market Size (2025) USD 295.3 million
Projected Market Size (2035) USD 631.7 million
CAGR (2025 to 2035) 7.9%
Base Year for Estimation 2024
Historical Period 2020 to 2024
Projections Period 2025 to 2035
Report Parameter USD million for value/Metric Tons
Source Type Analyzed Cereal Grains, Fruits & Vegetables, Herbs & Spices, and Synthetic Production
Purity Level Analyzed Low Purity, Medium Purity, and High Purity
Application Analyzed Food & Beverage, Pharmaceuticals, Cosmetics & Personal Care, Agriculture, and Industrial
Regions Covered North America, Latin America, Western Europe, Eastern Europe, Balkans & Baltic, Russia & Belarus, Central Asia, East Asia, South Asia & Pacific, and Middle East & Africa
Countries Covered United States, United Kingdom, Germany, France, Japan, China, India, Brazil, South Korea, Australia
Key Players Influencing the Market Aktin Chemicals Inc., Spectrum Chemical Manufacturing Corp., Pfaltz & Bauer, Inc., Tianjin NWC Biotechnology Co., Ltd., Shanghai Winhere Biopharma Co., Ltd., Hangzhou Dayangchem Co., Ltd., Hubei Biochem International Co., Ltd., Sigma-Aldrich Corporation, Tokyo Chemical Industry Co., Ltd., Cayman Chemical Company, Merck KGaA, Alfa Aesar, Nomura Chemical Co., Ltd., Spectrum Chemical Manufacturing Corp., and Parchem Fine & Specialty Chemicals
Additional Attributes Dollar sales by source type, purity analysis, regional demand growth, regulatory influence, competitive benchmarking

Key Segmentation

By Source Type:

As per Source Type, the industry has been categorized into Cereal Grains, Fruits & Vegetables, Herbs & Spices and Synthetic Production.

By Purity Level:

As per Purity Level, the industry has been categorized into Low Purity, Medium Purity and High Purity.

By Application:

As per Application, the industry has been categorized into Food & Beverage, Pharmaceuticals, Cosmetics & Personal Care, Agriculture and Industrial.

By Region:

Industry analysis has been carried out in key countries of North America, Latin America, Western Europe Eastern Europe, Balkans & Baltic, Russia & Belarus, Central Asia, East Asia, South Asia & Pacific and Middle East & Africa.

Table of Content

  1. Executive Summary
    • Global Market Outlook
    • Demand-side Trends
    • Supply-side Trends
    • Technology Roadmap Analysis
    • Analysis and Recommendations
  2. Market Overview
    • Market Coverage/Taxonomy
    • Market Definition/Scope/Limitations
  3. Market Background
    • Market Dynamics
      • Drivers
      • Restraints
      • Opportunity
      • Trends
    • Scenario Forecast
      • Demand in Optimistic Scenario
      • Demand in Likely Scenario
      • Demand in Conservative Scenario
    • Opportunity Map Analysis
    • Product Life Cycle Analysis
    • Supply Chain Analysis
      • Supply Side Participants and their Roles
        • Producers
        • Mid-Level Participants (Traders/ Agents/ Brokers)
        • Wholesalers and Distributors
      • Value Added and Value Created at Node in the Supply Chain
      • List of Raw Material Suppliers
      • List of Existing and Potential Buyer’s
    • Investment Feasibility Matrix
    • Value Chain Analysis
      • Profit Margin Analysis
      • Wholesalers and Distributors
      • Retailers
    • PESTLE and Porter’s Analysis
    • Regulatory Landscape
      • By Key Regions
      • By Key Countries
    • Regional Parent Market Outlook
    • Production and Consumption Statistics
    • Import and Export Statistics
  4. Global Market Analysis 2020 to 2024 and Forecast, 2025 to 2035
    • Historical Market Size Value (USD Million) & Volume (Metric Tons) Analysis, 2020 to 2024
    • Current and Future Market Size Value (USD Million) & Volume (Metric Tons) Projections, 2025 to 2035
      • Y-o-Y Growth Trend Analysis
      • Absolute $ Opportunity Analysis
  5. Global Market Pricing Analysis 2020 to 2024 and Forecast 2025 to 2035
  6. Global Market Analysis 2020 to 2024 and Forecast 2025 to 2035, By Source Type
    • Introduction/Key Findings
    • Historical Market Size Value (USD Million) & Volume (Metric Tons) Analysis By Source Type, 2020 to 2024
    • Current and Future Market Size Value (USD Million) & Volume (Metric Tons) Analysis and Forecast By Source Type, 2025 to 2035
      • Cereal Grains
      • Fruits & Vegetables
      • Herbs & Spices
      • Synthetic Production
    • Y-o-Y Growth Trend Analysis By Source Type, 2020 to 2024
    • Absolute $ Opportunity Analysis By Source Type, 2025 to 2035
  7. Global Market Analysis 2020 to 2024 and Forecast 2025 to 2035, By Purity Level
    • Introduction/Key Findings
    • Historical Market Size Value (USD Million) & Volume (Metric Tons) Analysis By Purity Level, 2020 to 2024
    • Current and Future Market Size Value (USD Million) & Volume (Metric Tons) Analysis and Forecast By Purity Level, 2025 to 2035
      • Low Purity
      • Medium Purity
      • High Purity
    • Y-o-Y Growth Trend Analysis By Purity Level, 2020 to 2024
    • Absolute $ Opportunity Analysis By Purity Level, 2025 to 2035
  8. Global Market Analysis 2020 to 2024 and Forecast 2025 to 2035, By Application
    • Introduction/Key Findings
    • Historical Market Size Value (USD Million) & Volume (Metric Tons) Analysis By Application, 2020 to 2024
    • Current and Future Market Size Value (USD Million) & Volume (Metric Tons) Analysis and Forecast By Application, 2025 to 2035
      • Food & Beverage
      • Pharmaceuticals
      • Cosmetics & Personal Care
      • Agriculture
      • Industrial
    • Y-o-Y Growth Trend Analysis By Application, 2020 to 2024
    • Absolute $ Opportunity Analysis By Application, 2025 to 2035
  9. Global Market Analysis 2020 to 2024 and Forecast 2025 to 2035, By Region
    • Introduction
    • Historical Market Size Value (USD Million) & Volume (Metric Tons) Analysis By Region, 2020 to 2024
    • Current Market Size Value (USD Million) & Volume (Metric Tons) Analysis and Forecast By Region, 2025 to 2035
      • North America
      • Latin America
      • Western Europe
      • Eastern Europe
      • East Asia
      • South Asia & Pacific
      • Middle East and Africa
    • Market Attractiveness Analysis By Region
  10. North America Market Analysis 2020 to 2024 and Forecast 2025 to 2035, By Country
    • Historical Market Size Value (USD Million) & Volume (Metric Tons) Trend Analysis By Market Taxonomy, 2020 to 2024
    • Market Size Value (USD Million) & Volume (Metric Tons) Forecast By Market Taxonomy, 2025 to 2035
      • By Country
        • USA
        • Canada
        • Mexico
      • By Source Type
      • By Purity Level
      • By Application
    • Market Attractiveness Analysis
      • By Country
      • By Source Type
      • By Purity Level
      • By Application
    • Key Takeaways
  11. Latin America Market Analysis 2020 to 2024 and Forecast 2025 to 2035, By Country
    • Historical Market Size Value (USD Million) & Volume (Metric Tons) Trend Analysis By Market Taxonomy, 2020 to 2024
    • Market Size Value (USD Million) & Volume (Metric Tons) Forecast By Market Taxonomy, 2025 to 2035
      • By Country
        • Brazil
        • Argentina
        • Rest of LATAM
      • By Source Type
      • By Purity Level
      • By Application
    • Market Attractiveness Analysis
      • By Country
      • By Source Type
      • By Purity Level
      • By Application
    • Key Takeaways
  12. Western Europe Market Analysis 2020 to 2024 and Forecast 2025 to 2035, By Country
    • Historical Market Size Value (USD Million) & Volume (Metric Tons) Trend Analysis By Market Taxonomy, 2020 to 2024
    • Market Size Value (USD Million) & Volume (Metric Tons) Forecast By Market Taxonomy, 2025 to 2035
      • By Country
        • Germany
        • Italy
        • France
        • UK
        • Spain
        • BENELUX
        • Nordic
        • Rest of W.Europe
      • By Source Type
      • By Purity Level
      • By Application
    • Market Attractiveness Analysis
      • By Country
      • By Source Type
      • By Purity Level
      • By Application
    • Key Takeaways
  13. Eastern Europe Market Analysis 2020 to 2024 and Forecast 2025 to 2035, By Country
    • Historical Market Size Value (USD Million) & Volume (Metric Tons) Trend Analysis By Market Taxonomy, 2020 to 2024
    • Market Size Value (USD Million) & Volume (Metric Tons) Forecast By Market Taxonomy, 2025 to 2035
      • By Country
        • Russia
        • Hungary
        • Poland
        • Balkan & Baltics
        • Rest of E. Europe
      • By Source Type
      • By Purity Level
      • By Application
    • Market Attractiveness Analysis
      • By Country
      • By Source Type
      • By Purity Level
      • By Application
    • Key Takeaways
  14. East Asia Market Analysis 2020 to 2024 and Forecast 2025 to 2035, By Country
    • Historical Market Size Value (USD Million) & Volume (Metric Tons) Trend Analysis By Market Taxonomy, 2020 to 2024
    • Market Size Value (USD Million) & Volume (Metric Tons) Forecast By Market Taxonomy, 2025 to 2035
      • By Country
        • China
        • Japan
        • South Korea
      • By Source Type
      • By Purity Level
      • By Application
    • Market Attractiveness Analysis
      • By Country
      • By Source Type
      • By Purity Level
      • By Application
    • Key Takeaways
  15. South Asia & Pacific Market Analysis 2020 to 2024 and Forecast 2025 to 2035, By Country
    • Historical Market Size Value (USD Million) & Volume (Metric Tons) Trend Analysis By Market Taxonomy, 2020 to 2024
    • Market Size Value (USD Million) & Volume (Metric Tons) Forecast By Market Taxonomy, 2025 to 2035
      • By Country
        • India
        • Australia & New Zealand
        • ASEAN
        • Rest of SAP
      • By Source Type
      • By Purity Level
      • By Application
    • Market Attractiveness Analysis
      • By Country
      • By Source Type
      • By Purity Level
      • By Application
    • Key Takeaways
  16. Middle East and Africa Market Analysis 2020 to 2024 and Forecast 2025 to 2035, By Country
    • Historical Market Size Value (USD Million) & Volume (Metric Tons) Trend Analysis By Market Taxonomy, 2020 to 2024
    • Market Size Value (USD Million) & Volume (Metric Tons) Forecast By Market Taxonomy, 2025 to 2035
      • By Country
        • GCC Countries
        • Northern Africa
        • South Africa
        • Turkiye
        • Rest of MEA
      • By Source Type
      • By Purity Level
      • By Application
    • Market Attractiveness Analysis
      • By Country
      • By Source Type
      • By Purity Level
      • By Application
    • Key Takeaways
  17. Key Countries Market Analysis
    • USA
      • Pricing Analysis
      • Market Share Analysis, 2024
        • By Source Type
        • By Purity Level
        • By Application
    • Canada
      • Pricing Analysis
      • Market Share Analysis, 2024
        • By Source Type
        • By Purity Level
        • By Application
    • Brazil
      • Pricing Analysis
      • Market Share Analysis, 2024
        • By Source Type
        • By Purity Level
        • By Application
    • Mexico
      • Pricing Analysis
      • Market Share Analysis, 2024
        • By Source Type
        • By Purity Level
        • By Application
    • Argentina
      • Pricing Analysis
      • Market Share Analysis, 2024
        • By Source Type
        • By Purity Level
        • By Application
  18. Market Structure Analysis
    • Competition Dashboard
    • Competition Benchmarking
    • Market Share Analysis of Top Players
      • By Regional
      • By Source Type
      • By Purity Level
      • By Application
  19. Competition Analysis
    • Competition Deep Dive
      • Aktin Chemicals Inc.
        • Overview
        • Product Portfolio
        • Profitability by Market Segments (Product/Age /Sales Channel/Region)
        • Sales Footprint
        • Strategy Overview
          • Marketing Strategy
          • Product Strategy
          • Channel Strategy
      • Spectrum Chemical Manufacturing Corp.
        • Overview
        • Product Portfolio
        • Profitability by Market Segments (Product/Age /Sales Channel/Region)
        • Sales Footprint
        • Strategy Overview
          • Marketing Strategy
          • Product Strategy
          • Channel Strategy
      • Pfaltz & Bauer, Inc.
        • Overview
        • Product Portfolio
        • Profitability by Market Segments (Product/Age /Sales Channel/Region)
        • Sales Footprint
        • Strategy Overview
          • Marketing Strategy
          • Product Strategy
          • Channel Strategy
      • Tianjin NWC Biotechnology Co., Ltd.
        • Overview
        • Product Portfolio
        • Profitability by Market Segments (Product/Age /Sales Channel/Region)
        • Sales Footprint
        • Strategy Overview
          • Marketing Strategy
          • Product Strategy
          • Channel Strategy
      • Shanghai Winhere Biopharma Co., Ltd.
        • Overview
        • Product Portfolio
        • Profitability by Market Segments (Product/Age /Sales Channel/Region)
        • Sales Footprint
        • Strategy Overview
          • Marketing Strategy
          • Product Strategy
          • Channel Strategy
      • Hangzhou Dayangchem Co., Ltd.
        • Overview
        • Product Portfolio
        • Profitability by Market Segments (Product/Age /Sales Channel/Region)
        • Sales Footprint
        • Strategy Overview
          • Marketing Strategy
          • Product Strategy
          • Channel Strategy
      • Hubei Biochem International Co., Ltd.
        • Overview
        • Product Portfolio
        • Profitability by Market Segments (Product/Age /Sales Channel/Region)
        • Sales Footprint
        • Strategy Overview
          • Marketing Strategy
          • Product Strategy
          • Channel Strategy
      • Sigma-Aldrich Corporation
        • Overview
        • Product Portfolio
        • Profitability by Market Segments (Product/Age /Sales Channel/Region)
        • Sales Footprint
        • Strategy Overview
          • Marketing Strategy
          • Product Strategy
          • Channel Strategy
      • Tokyo Chemical Industry Co., Ltd.
        • Overview
        • Product Portfolio
        • Profitability by Market Segments (Product/Age /Sales Channel/Region)
        • Sales Footprint
        • Strategy Overview
          • Marketing Strategy
          • Product Strategy
          • Channel Strategy
      • Cayman Chemical Company
        • Overview
        • Product Portfolio
        • Profitability by Market Segments (Product/Age /Sales Channel/Region)
        • Sales Footprint
        • Strategy Overview
          • Marketing Strategy
          • Product Strategy
          • Channel Strategy
      • Merck KGaA
        • Overview
        • Product Portfolio
        • Profitability by Market Segments (Product/Age /Sales Channel/Region)
        • Sales Footprint
        • Strategy Overview
          • Marketing Strategy
          • Product Strategy
          • Channel Strategy
      • Alfa Aesar
        • Overview
        • Product Portfolio
        • Profitability by Market Segments (Product/Age /Sales Channel/Region)
        • Sales Footprint
        • Strategy Overview
          • Marketing Strategy
          • Product Strategy
          • Channel Strategy
      • Nomura Chemical Co., Ltd.
        • Overview
        • Product Portfolio
        • Profitability by Market Segments (Product/Age /Sales Channel/Region)
        • Sales Footprint
        • Strategy Overview
          • Marketing Strategy
          • Product Strategy
          • Channel Strategy
      • Parchem Fine & Specialty Chemicals
        • Overview
        • Product Portfolio
        • Profitability by Market Segments (Product/Age /Sales Channel/Region)
        • Sales Footprint
        • Strategy Overview
          • Marketing Strategy
          • Product Strategy
          • Channel Strategy
  20. Assumptions & Acronyms Used
  21. Research Methodology

List of Tables

  • Table 1: Global Market Value (USD Million) Forecast by Region, 2020-2035
  • Table 2: Global Market Volume (Metric Tons) Forecast by Region, 2020-2035
  • Table 3: Global Market Value (USD Million) Forecast by Source Type, 2020-2035
  • Table 4: Global Market Volume (Metric Tons) Forecast by Source Type, 2020-2035
  • Table 5: Global Market Value (USD Million) Forecast by Purity Level, 2020-2035
  • Table 6: Global Market Volume (Metric Tons) Forecast by Purity Level, 2020-2035
  • Table 7: Global Market Value (USD Million) Forecast by Application, 2020-2035
  • Table 8: Global Market Volume (Metric Tons) Forecast by Application, 2020-2035
  • Table 9: North America Market Value (USD Million) Forecast by Country, 2020-2035
  • Table 10: North America Market Volume (Metric Tons) Forecast by Country, 2020-2035
  • Table 11: North America Market Value (USD Million) Forecast by Source Type, 2020-2035
  • Table 12: North America Market Volume (Metric Tons) Forecast by Source Type, 2020-2035
  • Table 13: North America Market Value (USD Million) Forecast by Purity Level, 2020-2035
  • Table 14: North America Market Volume (Metric Tons) Forecast by Purity Level, 2020-2035
  • Table 15: North America Market Value (USD Million) Forecast by Application, 2020-2035
  • Table 16: North America Market Volume (Metric Tons) Forecast by Application, 2020-2035
  • Table 17: Latin America Market Value (USD Million) Forecast by Country, 2020-2035
  • Table 18: Latin America Market Volume (Metric Tons) Forecast by Country, 2020-2035
  • Table 19: Latin America Market Value (USD Million) Forecast by Source Type, 2020-2035
  • Table 20: Latin America Market Volume (Metric Tons) Forecast by Source Type, 2020-2035
  • Table 21: Latin America Market Value (USD Million) Forecast by Purity Level, 2020-2035
  • Table 22: Latin America Market Volume (Metric Tons) Forecast by Purity Level, 2020-2035
  • Table 23: Latin America Market Value (USD Million) Forecast by Application, 2020-2035
  • Table 24: Latin America Market Volume (Metric Tons) Forecast by Application, 2020-2035
  • Table 25: Western Europe Market Value (USD Million) Forecast by Country, 2020-2035
  • Table 26: Western Europe Market Volume (Metric Tons) Forecast by Country, 2020-2035
  • Table 27: Western Europe Market Value (USD Million) Forecast by Source Type, 2020-2035
  • Table 28: Western Europe Market Volume (Metric Tons) Forecast by Source Type, 2020-2035
  • Table 29: Western Europe Market Value (USD Million) Forecast by Purity Level, 2020-2035
  • Table 30: Western Europe Market Volume (Metric Tons) Forecast by Purity Level, 2020-2035
  • Table 31: Western Europe Market Value (USD Million) Forecast by Application, 2020-2035
  • Table 32: Western Europe Market Volume (Metric Tons) Forecast by Application, 2020-2035
  • Table 33: Eastern Europe Market Value (USD Million) Forecast by Country, 2020-2035
  • Table 34: Eastern Europe Market Volume (Metric Tons) Forecast by Country, 2020-2035
  • Table 35: Eastern Europe Market Value (USD Million) Forecast by Source Type, 2020-2035
  • Table 36: Eastern Europe Market Volume (Metric Tons) Forecast by Source Type, 2020-2035
  • Table 37: Eastern Europe Market Value (USD Million) Forecast by Purity Level, 2020-2035
  • Table 38: Eastern Europe Market Volume (Metric Tons) Forecast by Purity Level, 2020-2035
  • Table 39: Eastern Europe Market Value (USD Million) Forecast by Application, 2020-2035
  • Table 40: Eastern Europe Market Volume (Metric Tons) Forecast by Application, 2020-2035
  • Table 41: East Asia Market Value (USD Million) Forecast by Country, 2020-2035
  • Table 42: East Asia Market Volume (Metric Tons) Forecast by Country, 2020-2035
  • Table 43: East Asia Market Value (USD Million) Forecast by Source Type, 2020-2035
  • Table 44: East Asia Market Volume (Metric Tons) Forecast by Source Type, 2020-2035
  • Table 45: East Asia Market Value (USD Million) Forecast by Purity Level, 2020-2035
  • Table 46: East Asia Market Volume (Metric Tons) Forecast by Purity Level, 2020-2035
  • Table 47: East Asia Market Value (USD Million) Forecast by Application, 2020-2035
  • Table 48: East Asia Market Volume (Metric Tons) Forecast by Application, 2020-2035
  • Table 49: South Asia & Pacific Market Value (USD Million) Forecast by Country, 2020-2035
  • Table 50: South Asia & Pacific Market Volume (Metric Tons) Forecast by Country, 2020-2035
  • Table 51: South Asia & Pacific Market Value (USD Million) Forecast by Source Type, 2020-2035
  • Table 52: South Asia & Pacific Market Volume (Metric Tons) Forecast by Source Type, 2020-2035
  • Table 53: South Asia & Pacific Market Value (USD Million) Forecast by Purity Level, 2020-2035
  • Table 54: South Asia & Pacific Market Volume (Metric Tons) Forecast by Purity Level, 2020-2035
  • Table 55: South Asia & Pacific Market Value (USD Million) Forecast by Application, 2020-2035
  • Table 56: South Asia & Pacific Market Volume (Metric Tons) Forecast by Application, 2020-2035
  • Table 57: Middle East and Africa Market Value (USD Million) Forecast by Country, 2020-2035
  • Table 58: Middle East and Africa Market Volume (Metric Tons) Forecast by Country, 2020-2035
  • Table 59: Middle East and Africa Market Value (USD Million) Forecast by Source Type, 2020-2035
  • Table 60: Middle East and Africa Market Volume (Metric Tons) Forecast by Source Type, 2020-2035
  • Table 61: Middle East and Africa Market Value (USD Million) Forecast by Purity Level, 2020-2035
  • Table 62: Middle East and Africa Market Volume (Metric Tons) Forecast by Purity Level, 2020-2035
  • Table 63: Middle East and Africa Market Value (USD Million) Forecast by Application, 2020-2035
  • Table 64: Middle East and Africa Market Volume (Metric Tons) Forecast by Application, 2020-2035

List of Figures

  • Figure 1: Global Market Volume (Metric Tons) Forecast 2020-2035
  • Figure 2: Global Market Pricing Analysis
  • Figure 3: Global Market Value (USD Million) Forecast 2020-2035
  • Figure 4: Global Market Value Share and BPS Analysis by Source Type, 2025 and 2035
  • Figure 5: Global Market Y-o-Y Growth Comparison by Source Type, 2025-2035
  • Figure 6: Global Market Attractiveness Analysis by Source Type
  • Figure 7: Global Market Value Share and BPS Analysis by Purity Level, 2025 and 2035
  • Figure 8: Global Market Y-o-Y Growth Comparison by Purity Level, 2025-2035
  • Figure 9: Global Market Attractiveness Analysis by Purity Level
  • Figure 10: Global Market Value Share and BPS Analysis by Application, 2025 and 2035
  • Figure 11: Global Market Y-o-Y Growth Comparison by Application, 2025-2035
  • Figure 12: Global Market Attractiveness Analysis by Application
  • Figure 13: Global Market Value (USD Million) Share and BPS Analysis by Region, 2025 and 2035
  • Figure 14: Global Market Y-o-Y Growth Comparison by Region, 2025-2035
  • Figure 15: Global Market Attractiveness Analysis by Region
  • Figure 16: North America Market Incremental $ Opportunity, 2025-2035
  • Figure 17: Latin America Market Incremental $ Opportunity, 2025-2035
  • Figure 18: Western Europe Market Incremental $ Opportunity, 2025-2035
  • Figure 19: Eastern Europe Market Incremental $ Opportunity, 2025-2035
  • Figure 20: East Asia Market Incremental $ Opportunity, 2025-2035
  • Figure 21: South Asia & Pacific Market Incremental $ Opportunity, 2025-2035
  • Figure 22: Middle East and Africa Market Incremental $ Opportunity, 2025-2035
  • Figure 23: North America Market Value Share and BPS Analysis by Country, 2025 and 2035
  • Figure 24: North America Market Value Share and BPS Analysis by Source Type, 2025 and 2035
  • Figure 25: North America Market Y-o-Y Growth Comparison by Source Type, 2025-2035
  • Figure 26: North America Market Attractiveness Analysis by Source Type
  • Figure 27: North America Market Value Share and BPS Analysis by Purity Level, 2025 and 2035
  • Figure 28: North America Market Y-o-Y Growth Comparison by Purity Level, 2025-2035
  • Figure 29: North America Market Attractiveness Analysis by Purity Level
  • Figure 30: North America Market Value Share and BPS Analysis by Application, 2025 and 2035
  • Figure 31: North America Market Y-o-Y Growth Comparison by Application, 2025-2035
  • Figure 32: North America Market Attractiveness Analysis by Application
  • Figure 33: Latin America Market Value Share and BPS Analysis by Country, 2025 and 2035
  • Figure 34: Latin America Market Value Share and BPS Analysis by Source Type, 2025 and 2035
  • Figure 35: Latin America Market Y-o-Y Growth Comparison by Source Type, 2025-2035
  • Figure 36: Latin America Market Attractiveness Analysis by Source Type
  • Figure 37: Latin America Market Value Share and BPS Analysis by Purity Level, 2025 and 2035
  • Figure 38: Latin America Market Y-o-Y Growth Comparison by Purity Level, 2025-2035
  • Figure 39: Latin America Market Attractiveness Analysis by Purity Level
  • Figure 40: Latin America Market Value Share and BPS Analysis by Application, 2025 and 2035
  • Figure 41: Latin America Market Y-o-Y Growth Comparison by Application, 2025-2035
  • Figure 42: Latin America Market Attractiveness Analysis by Application
  • Figure 43: Western Europe Market Value Share and BPS Analysis by Country, 2025 and 2035
  • Figure 44: Western Europe Market Value Share and BPS Analysis by Source Type, 2025 and 2035
  • Figure 45: Western Europe Market Y-o-Y Growth Comparison by Source Type, 2025-2035
  • Figure 46: Western Europe Market Attractiveness Analysis by Source Type
  • Figure 47: Western Europe Market Value Share and BPS Analysis by Purity Level, 2025 and 2035
  • Figure 48: Western Europe Market Y-o-Y Growth Comparison by Purity Level, 2025-2035
  • Figure 49: Western Europe Market Attractiveness Analysis by Purity Level
  • Figure 50: Western Europe Market Value Share and BPS Analysis by Application, 2025 and 2035
  • Figure 51: Western Europe Market Y-o-Y Growth Comparison by Application, 2025-2035
  • Figure 52: Western Europe Market Attractiveness Analysis by Application
  • Figure 53: Eastern Europe Market Value Share and BPS Analysis by Country, 2025 and 2035
  • Figure 54: Eastern Europe Market Value Share and BPS Analysis by Source Type, 2025 and 2035
  • Figure 55: Eastern Europe Market Y-o-Y Growth Comparison by Source Type, 2025-2035
  • Figure 56: Eastern Europe Market Attractiveness Analysis by Source Type
  • Figure 57: Eastern Europe Market Value Share and BPS Analysis by Purity Level, 2025 and 2035
  • Figure 58: Eastern Europe Market Y-o-Y Growth Comparison by Purity Level, 2025-2035
  • Figure 59: Eastern Europe Market Attractiveness Analysis by Purity Level
  • Figure 60: Eastern Europe Market Value Share and BPS Analysis by Application, 2025 and 2035
  • Figure 61: Eastern Europe Market Y-o-Y Growth Comparison by Application, 2025-2035
  • Figure 62: Eastern Europe Market Attractiveness Analysis by Application
  • Figure 63: East Asia Market Value Share and BPS Analysis by Country, 2025 and 2035
  • Figure 64: East Asia Market Value Share and BPS Analysis by Source Type, 2025 and 2035
  • Figure 65: East Asia Market Y-o-Y Growth Comparison by Source Type, 2025-2035
  • Figure 66: East Asia Market Attractiveness Analysis by Source Type
  • Figure 67: East Asia Market Value Share and BPS Analysis by Purity Level, 2025 and 2035
  • Figure 68: East Asia Market Y-o-Y Growth Comparison by Purity Level, 2025-2035
  • Figure 69: East Asia Market Attractiveness Analysis by Purity Level
  • Figure 70: East Asia Market Value Share and BPS Analysis by Application, 2025 and 2035
  • Figure 71: East Asia Market Y-o-Y Growth Comparison by Application, 2025-2035
  • Figure 72: East Asia Market Attractiveness Analysis by Application
  • Figure 73: South Asia & Pacific Market Value Share and BPS Analysis by Country, 2025 and 2035
  • Figure 74: South Asia & Pacific Market Value Share and BPS Analysis by Source Type, 2025 and 2035
  • Figure 75: South Asia & Pacific Market Y-o-Y Growth Comparison by Source Type, 2025-2035
  • Figure 76: South Asia & Pacific Market Attractiveness Analysis by Source Type
  • Figure 77: South Asia & Pacific Market Value Share and BPS Analysis by Purity Level, 2025 and 2035
  • Figure 78: South Asia & Pacific Market Y-o-Y Growth Comparison by Purity Level, 2025-2035
  • Figure 79: South Asia & Pacific Market Attractiveness Analysis by Purity Level
  • Figure 80: South Asia & Pacific Market Value Share and BPS Analysis by Application, 2025 and 2035
  • Figure 81: South Asia & Pacific Market Y-o-Y Growth Comparison by Application, 2025-2035
  • Figure 82: South Asia & Pacific Market Attractiveness Analysis by Application
  • Figure 83: Middle East and Africa Market Value Share and BPS Analysis by Country, 2025 and 2035
  • Figure 84: Middle East and Africa Market Value Share and BPS Analysis by Source Type, 2025 and 2035
  • Figure 85: Middle East and Africa Market Y-o-Y Growth Comparison by Source Type, 2025-2035
  • Figure 86: Middle East and Africa Market Attractiveness Analysis by Source Type
  • Figure 87: Middle East and Africa Market Value Share and BPS Analysis by Purity Level, 2025 and 2035
  • Figure 88: Middle East and Africa Market Y-o-Y Growth Comparison by Purity Level, 2025-2035
  • Figure 89: Middle East and Africa Market Attractiveness Analysis by Purity Level
  • Figure 90: Middle East and Africa Market Value Share and BPS Analysis by Application, 2025 and 2035
  • Figure 91: Middle East and Africa Market Y-o-Y Growth Comparison by Application, 2025-2035
  • Figure 92: Middle East and Africa Market Attractiveness Analysis by Application
  • Figure 93: Global Market - Tier Structure Analysis
  • Figure 94: Global Market - Company Share Analysis

Frequently Asked Questions

What is the projected size of the ferulic acid market in 2025?

The market is valued at USD 295.3 million in 2025.

What is the outlook on ferulic acid demand by 2035?

The market is forecasted to reach USD 631.7 million by 2035, reflecting a CAGR of 7.9%.

Which segment leads the ferulic acid market by source type in 2025?

Cereal grains will lead the source type segment, accounting for 52% of the market in 2025.

What is the top purity segment for the ferulic acid market in 2025?

Medium purity ferulic acid will dominate the purity segment with a 45% share in 2025.

Which country is projected to have the fastest-growing ferulic acid market?

The USA is projected to grow at the fastest rate with a CAGR of 8% from 2025 to 2035.

Explore Similar Insights

Future Market Insights

Ferulic Acid Market