

- Market Size (2026)
- USD 1.1 Bn
- Forecast (2036)
- USD 1.8 Bn
- CAGR (2026 to 2036)
- 4.8%
How big is Flotation Activators Market in 2026?
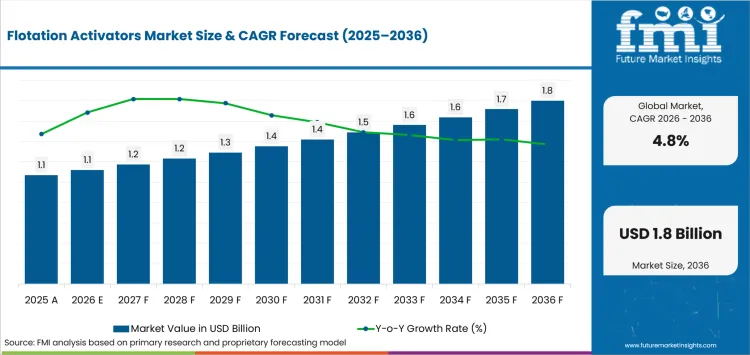
USD 1.1 billion in 2026 and USD 1.8 billion by 2036 at a 4.8% CAGR from 2026 to 2036.
Demand for flotation activators is projected to rise at a 4.8% CAGR from 2026 to 2036, lifting valuation from USD 1.1 billion to USD 1.8 billion. The forecast adds USD 0.7 billion as base-metal concentrators use activators to restore collector response in mining flotation chemicals programs. At SME MINEXCHANGE in February 2025, Clariant presented alternative copper-recovery chemistries for difficult secondary sulfides and clay-bearing ores. Ore-specific testing keeps activation chemistry tied to metallurgical results instead of specification alone.
Country demand diverges where concentrator throughput and project timing differ. COCHILCO recorded 5,415.3 thousand tonnes of Chilean mine copper production in 2025 in its July 2026 bulletin. That installed processing base supports repeated activator trials on operating circuits. Projects in Mexico and Peru widen future qualification work. Order conversion also depends on mineral processing equipment capacity and the ore feed handled at each site.
Key Takeaways
- Base-metal concentrators sustain flotation activator demand as changing sulfide mineralogy requires controlled surface conditioning so collectors can recover target minerals.
- Based on activator type, copper sulfate is projected to account for 39.0% in 2026 due to familiar dosing practice in conventional sphalerite flotation circuits.
- By ore type, sphalerite ores are estimated to hold 29.0% in 2026 owing to the need to condition zinc sulfide surfaces ahead of collector attachment.
- In 2026, mineral surface activation is expected to lead the function category with 36.0% share because it directly controls collector response on difficult sulfide surfaces.
- Variable gangue minerals, dissolved ions, and pulp conditions can narrow the operating window and turn an activator-led recovery gain into a selectivity loss.
- Some of the key players in this market include Orica, BASF, Clariant, Syensqo, Nouryon, Arkema, FUCHS, and Quadra.
Analyst Perspective
"Plant metallurgists should compare flotation activators on recovery, concentrate grade, dosage tolerance, and repeatability on the site's own ore. Unit price enters the decision after that evidence is stable. Commercial value comes from reproducing the result during ore changes and keeping the qualified chemistry available without disrupting the approved reagent scheme."
- Nikhil Kaitwade, Principal Consultant, Future Market Insights
How is the flotation activators market segmented?
The flotation activators market is segmented by activator type, ore type, function, end use, sales channel, and region.
The flotation activators market is segmented by activator type, ore type, function, end use, sales channel, and region. Activator types cover copper sulfate, sodium sulfide, lead nitrate, zinc sulfate activator blends, and specialty metal salts. Ore types include sphalerite, oxidized, gold sulfide, copper, and polymetallic ores. Functions cover mineral surface activation, sulfidization support, collector response improvement, and selective flotation control. End uses include base-metal, gold, industrial-mineral, and toll-processing plants. Sales channels include direct mine contracts, distributors, reagent service providers, and regional blending.
What supports demand for copper sulfate within the activator type category?
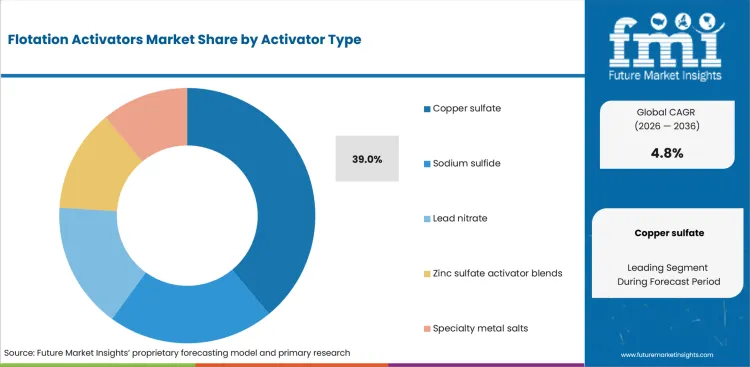
Copper sulfate conditions sphalerite so thiol collectors can attach. Plant metallurgists therefore test dosage and conditioning time against zinc recovery and check whether iron sulfides gain unwanted floatability ahead of changing flotation reagents.
- Based on activator type, copper sulfate is projected to account for 39.0% in 2026 due to familiar dosing practice in conventional zinc-sulfide circuits.
- Syensqo reported in November 2025 that Technology Solutions sales rose 4% year over year on higher mining volumes. The result confirms active demand for specialty mineral-processing chemistry without being used to prove the modelled share.
How do sphalerite ores shape activator demand within the ore type category?
Untreated zinc sulfide can respond weakly to common collectors, so sphalerite circuits use activation. Operators adjust copper dosage with pH, ore grade, and zinc-processing chemistry ahead of changing the approved collector scheme.
- Sphalerite ores are set to lead the ore type category with 29.0% share in 2026 due to copper-assisted activation in established zinc and polymetallic circuits.
- The USA Geological Survey estimated USA zinc mine production fell 12% in 2025, mainly from lower ore grades at Red Dog. Grade changes make repeatable activation control more important during normal circuit adjustments.
Why do base metal concentrators lead demand within the end use category?
Base metal concentrators run copper, zinc, lead, and polymetallic circuits. A reagent change can alter recovery and concentrate quality together, so new beneficiation reagents usually pass laboratory and plant trials before procurement expands.
- By end use, base metal concentrators are forecast to represent 59.0% in 2026 driven by repeated activator dosing in large sulfide-ore flotation circuits.
- Peru's Ministry of Energy and Mines listed 66 mining investment projects in June 2026 in 19 departments. New or expanded concentrators widen the number of sites that must qualify ore-specific activation before routine orders begin.
What makes direct mine contracts important within the sales channel category?
Direct contracts let mine metallurgists tie commercial terms to site trials, delivery schedules, and field support for specialty chemicals. The route fits activators because dosage changes interact with collector choice, water chemistry, and the mine's approved reagent recipe.
- Direct mine contracts are projected to hold 44.0% share in 2026 owing to the need for technical accountability beside scheduled reagent supply.
- Clariant's May 2026 first-quarter release stated that sales grew in Mining Solutions. The result confirms active mine-facing chemistry demand where commercial supply is paired with technical contact.
What are the drivers, restraints and opportunities in the Flotation Activators Market?
Base-metal project activity raises activator demand, ore-specific selectivity limits substitution, and mine-site test support can shorten the path from reagent trial to contracted supply.
- Driver: Copper and zinc project pipelines increase the number of flotation circuits that require activator qualification before steady production.
- Restraint: Unwanted activation of pyrite or impurity-bearing minerals can erase recovery gains by lowering concentrate quality.
- Opportunity: Site test programs that prove stable recovery at practical dosage can convert technical results into long-term chemical supply.
Mine-project pipelines affect reagent demand once concentrators enter commissioning and begin treating stable ore feeds. Peru's October 2025 investment portfolio contained 67 projects, including copper and zinc developments with greenfield and brownfield work. Those projects enlarge the future trial base for activators and adjacent precious metal beneficiation reagents, but orders follow plant start-up and successful site qualification.
Selectivity is the main technical brake on activator substitution. JOGMEC and CODELCO signed a cooperation agreement in December 2025 to develop technology for lowering impurities in copper raw materials. A recovery gain is insufficient by itself. Replacement chemistry must also protect concentrate quality under the plant's actual feed conditions.
Regional test support gains value in mining districts with several operating base-metal sites and different ore responses. Geoscience Australia listed 24 operating copper mines and 14 operating zinc mines in its December 2025 preliminary tables. A nearby laboratory can spread test capacity among several operations, giving lower-dose and eco-friendly beneficiation reagents a practical route into qualification without assuming one formula suits every ore.
Which country CAGRs are profiled in the Flotation Activators Market?
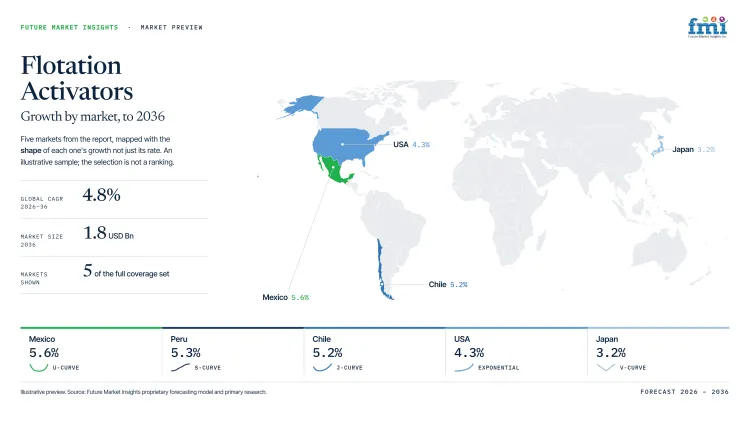
| Country | CAGR |
|---|---|
| Mexico | 5.6% |
| Peru | 5.3% |
| Chile | 5.2% |
| Australia | 4.7% |
| Canada | 4.5% |
| United States | 4.3% |
| Japan | 3.2% |
How do country-level CAGRs compare in the Flotation Activators Market?
The seven forecasts span 2.4 percentage points between Mexico at 5.6% and Japan at 3.2%. Mexico, Peru, and Chile form the upper group because mine pipelines sit beside sulfide-processing bases. Australia, Canada, and the United States occupy the middle. Japan grows slowly from a mature processing position.
- Mexico's northern polymetallic districts favor local reagent stock.
- Peru's high-altitude concentrators raise freight and service requirements.
- Chile's large copper circuits prioritize impurity-control testwork.
- Australia's dispersed mines reward regional warehousing and field service.
- Canada's remote mines make winter supply continuity commercially important.
- USA brownfield circuits favor reagents compatible with installed equipment.
- Japan's imported concentrates raise demand for specialist impurity control.
Comparable CAGRs still convert into orders through different site, logistics, and qualification conditions.
The full report provides country-level CAGR analysis across North America, Latin America, Western Europe, Eastern Europe, East Asia, South Asia and Pacific, and Middle East and Africa.
Country-wise Analysis
- Northern Mexico combines polymetallic mining districts with chemical distribution routes serving zinc, lead, copper, and precious-metal concentrators where plant teams often need rapid resupply during abrupt ore changes. Mexico is projected to grow at 5.6% CAGR through 2036, attributable to mine activity that keeps flotation chemistry in regular operating budgets. Servicio Geológico Mexicano reported in July 2026 that national mining production value rose 19.6% in 2024, but permit uncertainty and long mine-to-warehouse distances favor companies that hold regional stock and can send metallurgical support before a trial becomes contracted volume during difficult ore-transition campaigns at operating mine sites.
- Peruvian concentrators often operate at altitude with long inbound routes for process chemicals, making inventory planning part of reagent qualification as plants move between ore domains and manage seasonal transport constraints. The Ministry of Energy and Mines published 69 exploration projects in March 2026, widening the pipeline for future testwork and brownfield activity during high-altitude commissioning and mine expansion work. Peru is estimated to post 5.3% CAGR over the forecast period, aided by a strong copper and zinc project base. Road distance can still slow conversion from laboratory success to repeat orders without regional stock and plant-level metallurgical service.
- Chilean activator demand is anchored in large copper concentrators where impurity rejection and concentrate quality are monitored beside recovery, making reagent changes difficult to approve without ore-specific testwork and stable concentrate-grade results during plant trials locally. Flotation activator sales in Chile are forecast to expand at 5.2% CAGR by 2036, tied to concentrator investment and increasingly complex feeds. COCHILCO's 2025-2034 project portfolio identifies new concentrators at Collahuasi and Escondida in prefeasibility, but environmental approvals and commissioning schedules can delay the point at which qualified chemistry becomes sustained commercial volume during ramp-up and the first months of stable concentrate production.
- Australian mine sites are widely dispersed, so reagent economics depend on stock position and field support as much as laboratory performance during routine concentrator operation and planned shutdowns. Geoscience Australia reported in 2026 that copper mine production was 0.75 million tonnes in 2024, down 4% from the prior year, and zinc production reached 1.10 million tonnes. Adoption of flotation activators in Australia is estimated to expand at 4.7% CAGR through 2036, linked to a mature mineral-processing base, but long transport routes raise working-capital needs and favor companies with regional warehouses and on-site technical teams near major mineral-processing districts.
- Canadian base-metal mines include remote operations where winter logistics and limited storage can turn a qualified reagent into a supply-risk decision, especially when concentrators cannot carry long inventory buffers. Natural Resources Canada stated in March 2026 that more than 60 minerals and metals are produced by over 200 operating mines, providing a broad installed base for process-chemical service. Canada's flotation activators outlook is anticipated to advance at 4.5% CAGR over the assessment period, propelled by critical-mineral development. Remote-site freight keeps regional warehousing and fast technical response especially important during winter resupply, shutdown work and unplanned plant process changes onsite.
- USA demand is concentrated in mature copper and zinc circuits plus brownfield projects that must fit existing plant equipment, control logic, and reagent recipes before operators accept a chemistry change. The United States flotation activators sector is projected to record 4.3% CAGR during the assessment period, driven by replacement and selective new development. The Bureau of Land Management approved access to 67 pre-existing drill-pad sites at Arizona's Copper Creek project in June 2025. Permitting and site water chemistry can slow conversion unless a company successfully proves compatibility on the operating flowsheet during commissioning and brownfield circuit changes locally.
- Japanese mineral processors rely heavily on imported concentrates, making feed quality and impurity variability central to reagent selection despite a smaller domestic mine base and mature downstream processing system. METI's final December 2025 industrial index placed non-ferrous metals production at 99.9 for the year, down 1.7% from 2024, which limits the volume case for broad reagent expansion. In Japan, flotation activator demand is predicted to advance at 3.2% CAGR through 2036, reflecting specialist impurity-control needs, so technical partnerships offer a stronger route than strategies built around large mine-site volume alone for imported base-metal concentrate treatment programs locally.
Who are the notable companies in the Flotation Activators Market?
Orica, BASF, Clariant, Syensqo, Nouryon, Arkema, FUCHS, and Quadra are the notable companies serving this market.
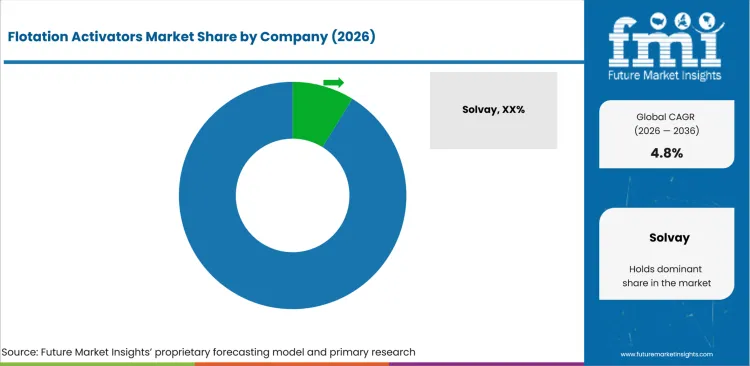
Competition is fragmented between global mining-chemistry groups, specialty surfactant formulators, and regional distributors of legacy beneficiation reagents. Entry barriers come from ore-specific testwork, reliable supply, and technical response at mine sites. The same logistics network that supports mining lubricants can influence chemical availability at remote operations, but flotation activators require separate metallurgical qualification before a contract scales.
- Orica, BASF, Clariant, and Syensqo carry broad mining-chemistry platforms with formulation or technical-service depth.
- Nouryon and Arkema participate from specialty chemical portfolios that serve mineral treatment and adjacent process-chemistry needs.
- FUCHS and Quadra use mine-facing service and distribution routes where local inventory and technical access can determine how quickly a qualified reagent reaches regular supply.
Competitive Benchmarking: Flotation Activators Market
| Company | Sulfide Flotation Chemistry | Site Test and Technical Support | Supply and Channel Coverage | Geographic Reach |
|---|---|---|---|---|
| Orica | Medium | High | High | Global |
| BASF | High | High | High | Global |
| Clariant | High | High | High | Global |
| Syensqo | High | High | High | Global |
| Nouryon | Medium | Medium | High | Global |
| Arkema | Medium | High | High | Global |
| FUCHS | Medium | High | High | Australia and international mining service |
| Quadra | High | Medium | High | Canada and United States |
Scoring basis: High sulfide-flotation chemistry requires several verified reagent routes relevant to mineral separation. Medium identifies a narrower or adjacent portfolio and Low identifies one documented route. High site support requires laboratory plus field capability, Medium one verified support route, and Low limited documented support. High channel coverage requires multiple regions or a documented distribution network. Medium is regionally concentrated and Low is a single documented route.
Key Developments in the Flotation Activators Market
- In April 2026, Orica acquired the Danafloat product range from FMC Corporation, extending its Specialty Mining Chemicals portfolio into copper and other sulfide-ore flotation.
- In May 2025, BASF relocated global copper-leaching R&D to Houston and intensified development of flotation formulations for sulfide and non-sulfide ores.
- In November 2025, Nouryon opened a larger Shanghai innovation center with a Natural Resources laboratory supporting mining and other resource industries in Asia Pacific.
Key Players in the Flotation Activators Market
Global Mining-Chemistry Platforms
- Orica
- BASF
- Clariant
- Syensqo
Specialty Chemical Formulators
- Nouryon
- Arkema
Mine-Service and Distribution Channels
- FUCHS
- Quadra
Flotation Activators Market - Report Scope
| Coverage field | Report scope |
|---|---|
| Market breakdown | By activator type, ore type, function, end use, sales channel, and region. |
| Quantitative Units | USD billion. |
| Market Definition | Commercial flotation activators and adjacent surface-conditioning reagents used to modify mineral response before or during froth flotation. |
| Regions Covered | North America, Latin America, Western Europe, Eastern Europe, East Asia, South Asia and Pacific, and Middle East and Africa. |
| Countries Covered | Mexico, Peru, Chile, Australia, Canada, United States, Japan, and 30+ countries included in the full report. |
| Key Companies Profiled | Orica, BASF, Clariant, Syensqo, Nouryon, Arkema, FUCHS, Quadra. |
| Forecast Period | 2026 to 2036. |
| Approach | Primary and secondary research with market triangulation. |
Flotation Activators Market - Research Methodology
| Method | Approach |
|---|---|
| Primary Research | FMI analysts gathered input from manufacturers, service providers, technology developers, distributors, end users, procurement teams, and subject-matter experts. Interviews examined purchasing decisions, product or service evaluation, adoption barriers, approval requirements, pricing considerations, and expectations for technical or commercial support. Respondents were also asked what evidence is required before a trial, pilot, or initial order develops into regular purchasing. |
| Desk Research | Desk research covered government statistics, regulatory publications, trade data, industry associations, technical literature, standards, company filings, product information, and official corporate announcements. Sources were reviewed for relevance, publication date, geographic coverage, and consistency with the defined market scope. Claims relating to performance, applications, approvals, capacity, investment, and commercial activity were retained only when supported by credible public evidence. |
| Market Sizing and Forecasting | The market model combined the baseline value with historical performance, segment structure, pricing and volume indicators, adoption levels, company participation, and country-level demand conditions. Forecast assumptions considered economic activity, investment trends, regulatory developments, technology adoption, purchasing cycles, supply availability, and barriers to wider market use. Segment and regional estimates were reconciled before the final market total was calculated. |
| Data Validation | Estimates were checked against multiple independent indicators, including public data, company activity, trade patterns, industry developments, and findings from primary interviews. Validation also tested whether products, services, applications, and company revenues fell within the defined market boundaries. Adjacent categories, unsupported claims, overlapping revenues, and activities without direct market relevance were excluded to reduce double counting and maintain consistency across segments and countries. |
Flotation Activators Market by Segments
Flotation Activators Market segmented by Activator Type:
- Copper sulfate
- Sodium sulfide
- Lead nitrate
- Zinc sulfate activator blends
- Specialty metal salts
Flotation Activators Market segmented by Ore Type:
- Sphalerite ores
- Oxidized ores
- Gold sulfide ores
- Copper ores
- Polymetallic ores
Flotation Activators Market segmented by Function:
- Mineral surface activation
- Sulfidization support
- Collector response improvement
- Selective flotation control
Flotation Activators Market segmented by End Use:
- Base metal concentrators
- Gold plants
- Industrial mineral plants
- Toll processing plants
Flotation Activators Market segmented by Sales Channel:
- Direct mine contracts
- Chemical distributors
- Reagent service providers
- Regional blending
Flotation Activators Market by Region:
- North America
- United States
- Canada
- Latin America
- Brazil
- Mexico
- Argentina
- Chile
- Western Europe
- Germany
- France
- United Kingdom
- Italy
- Spain
- Benelux
- Nordics
- Eastern Europe
- Poland
- Czech Republic
- Romania
- Hungary
- East Asia
- China
- Japan
- South Korea
- South Asia and Pacific
- India
- ASEAN
- Australia and New Zealand
- Middle East and Africa
- GCC Countries
- South Africa
- Türkiye
- Israel
Research Sources and Bibliography
- Clariant. (2025, February 23). SME Minexchange 2025.
- Chilean Copper Commission. (2026, July). Boletín mensual: Producción mundial de cobre de mina.
- Syensqo. (2025, November 6). Syensqo third quarter 2025 results.
- USA Geological Survey. (2026, February 6). Mineral commodity summaries 2026.
- Ministerio de Energía y Minas del Perú. (2026, June 17). Cartera de Proyectos de Inversión Minera 2026.
- Clariant. (2026, May 8). Clariant delivers resilient performance in challenging environment.
- Ministerio de Energía y Minas del Perú. (2025, October 26). Cartera de Proyectos de Inversión Minera 2025.
- Japan Organization for Metals and Energy Security. (2025, December 8). Agreement on Cooperation for Technology to Reduce Impurities in Copper Raw Materials with CODELCO.
- Geoscience Australia. (2025, December 10). Australia’s Identified Mineral Resources 2025 Preliminary Tables.
- Servicio Geológico Mexicano. (2026, July 1). Anuario Estadístico de la Minería Mexicana.
- Ministerio de Energía y Minas del Perú. (2026, March 24). Cartera de Proyectos de Exploración Minera 2026.
- Chilean Copper Commission. (2025, December). Informe Cartera de Proyectos de Inversión Minera 2025-2034.
- Geoscience Australia. (2026, February 26). Australia’s Identified Mineral Resources.
- Natural Resources Canada. (2026, March 3). Government of Canada invests to unlock Canada’s critical minerals advantage.
- Bureau of Land Management. (2025, June 30). BLM approves Copper Creek mineral exploration near Mammoth.
- Ministry of Economy, Trade and Industry. (2026). 2025 December indices of industrial production: final report.
- Orica. (2026, April 17). Orica expands portfolio into copper chemistry with Danafloat acquisition.
- BASF. (2025, June 18). BASF mining solutions and FUCHS announce cooperation to serve the Australian mining industry.
- Quadra. (2025, April 1). Quadra Announces Acquisition of Bell Chem, Accelerating Growth and Strengthening Market Position.
- BASF. (2025, August 28). BASF opens Mining Solutions Laboratory in conjunction with Al-Farabi Kazakh National University in Kazakhstan.
- Nouryon. (2025, March 18). First Nordic supplier to launch low-carbon footprint hydrogen peroxide.
- Syensqo. (2026, May 21). Syensqo launches strategic review of its Performance & Care segment.
- Arkema. (2026, March 26). Filing of Arkema’s 2025 Universal Registration Document.
- Kemcore. (2025, December 3). Integrated Battery Mineral Complex - Identified as a priority project.
- Orica. (2025, November 13). Highest earnings in 13 years.
- FUCHS SE. (2026, April 30). FUCHS SE successfully completes full acquisition of the OPET FUCHS joint venture.
- AECI. (2025, February 26). AECI reports 2024 results: strategic execution drives transformation.
- Clariant. (2026, February 27). Clariant publishes Integrated Report 2025.
- Syensqo. (2026, March 31). Regulated information: 2025 Annual Integrated Report release.
- BASF. (2025, May 20). BASF mining solutions strengthens commitment to copper hydrometallurgy and flotation research and development.
- Nouryon. (2025, November 10). Nouryon opens new innovation center in Shanghai to accelerate localized innovation and customer collaboration in China.
- Vinnova. (2025, September 26). Designed Collectors for Selective Flotation of Sulfide Minerals.
- Quadra. (2025, March 12). Indigenous Relations.
This bibliography is provided for reader reference and is not exhaustive. The full report contains the complete reference list and detailed citations
This Report Answers
- How large is the flotation activators market in 2026 and 2036?
- Which operating conditions sustain repeat demand for flotation activators in sulfide-ore circuits?
- Why does copper sulfate account for 39.0% of activator type demand in 2026?
- How do sphalerite ores shape activation and collector response?
- Why do base metal concentrators represent 59.0% of end-use demand in 2026?
- How do country growth rates differ among Mexico, Peru, Chile, Australia, Canada, the United States, and Japan?
- Which companies supply flotation chemistry, mine-site support, and regional distribution?
- What technical and logistics conditions can slow activator qualification or switching?
- What should plant metallurgists compare before moving an activator from trial to contracted supply?
Frequently Asked Questions
How big is the flotation activators market in 2026?
The flotation activators market is valued at USD 1.1 billion in 2026 and is projected to reach USD 1.8 billion by 2036. Growth follows base-metal flotation throughput and repeat reagent qualification on changing sulfide ores.
What is the CAGR of the flotation activators market from 2026 to 2036?
The flotation activators market is projected to grow at a CAGR of 4.8% between 2026 and 2036. Expansion is supported by copper and zinc processing activity plus the need to maintain recovery as ore mineralogy changes.
Which activator type leads the flotation activators market?
The copper sulfate segment is expected to hold 39.0% of the flotation activators market in 2026, owing to its established use in sphalerite activation. Plant teams still qualify dosage against local ore and selectivity requirements.
Which end use leads the flotation activators market?
Base metal concentrators are expected to hold 59.0% of the flotation activators market in 2026, driven by repeated dosing in large sulfide-ore circuits. Their continuous operation also makes dependable reagent supply and technical support commercially important.
How much value will the flotation activators market add between 2026 and 2036?
The flotation activators market is expected to add USD 0.7 billion in value between 2026 and 2036. The increase follows more flotation work in copper and zinc circuits plus continued site-level reagent qualification.
Which countries are projected to record the highest growth in the flotation activators market?
Mexico is projected to grow at 5.6% CAGR, followed by Peru at 5.3% and Chile at 5.2% through 2036. Their stronger outlooks are tied to mine-project activity and substantial sulfide-processing bases.
Which companies are active in the flotation activators market?
Key companies operating in the flotation activators market include Orica, BASF, Clariant, Syensqo, Nouryon, Arkema, FUCHS, and Quadra. Their competitive positions depend on flotation chemistry, technical test support, regional distribution, and mine-site service coverage.
Preview the report firsthand - request a free sample
Get SampleGet the brochure for pricing and purchase details.
Get PDFTable of Content
- Key Takeaways
- Market Size and CAGR
- Top Growth Driver
- Fastest Growing Segment
- Leading Region
- Key Companies
- Emerging Opportunities
- Executive Summary
- Global Market Outlook
- Demand-side Trends
- Supply-side Trends
- Technology Roadmap Analysis
- Analysis and Recommendations
- Analyst Perspective (What is happening? Why now? What should investors know?)
- Key Questions Answered
- How large is the market?
- What is the CAGR?
- What are key trends?
- Which region dominates?
- Who are the leaders?
- Market Overview
- Market Coverage / Taxonomy
- Market Definition / Scope / Limitations
- Research Methodology
- Chapter Orientation
- Analytical Lens and Working Hypotheses
- Market Structure, Signals, and Trend Drivers
- Benchmarking and Cross-market Comparability
- Market Sizing, Forecasting, and Opportunity Mapping
- Research Design and Evidence Framework
- Desk Research Programme (Secondary Evidence)
- Expert Input and Fieldwork (Primary Evidence)
- Tooling, Models, and Reference Databases
- Data Engineering and Model Build
- Quality Assurance and Audit Trail
- Market Background
- Market Dynamics (Drivers, Restraints, Opportunity, Trends)
- Scenario Forecast (Optimistic, Likely, Conservative)
- Impact Analysis
- AI Impact
- Sustainability Impact
- Regulatory Impact
- Technology Impact
- Consumer / Buyer Analysis
- Purchase Drivers
- Adoption Barriers
- Buyer Journey
- Opportunity Map Analysis
- Product Life Cycle Analysis
- Supply Chain Analysis
- Investment Feasibility Matrix
- Value Chain Analysis
- PESTLE and Porter's Analysis
- Regulatory Landscape
- Regional Parent Market Outlook
- Production and Consumption Statistics
- Import and Export Statistics
- Global Market Analysis and Forecast, 2021 to 2036
- Historical Market Size Value (USD Billion) Analysis, 2021 to 2025
- Current and Future Market Size Value (USD Billion) Projections, 2026 to 2036
- Y-o-Y Growth Trend Analysis
- Absolute $ Opportunity Analysis
- Global Market Pricing Analysis, 2021 to 2036
- Global Market Analysis and Forecast, By Activator Type, 2021 to 2036
- Introduction / Key Findings
- Historical Market Size Value (USD Billion) Analysis By Activator Type, 2021 to 2025
- Current and Future Market Size Value (USD Billion) Analysis and Forecast By Activator Type, 2026 to 2036
- Copper sulfate
- Sodium sulfide
- Lead nitrate
- Zinc sulfate activator blends
- Specialty metal salts
- Copper sulfate
- Y-o-Y Growth Trend Analysis By Activator Type, 2021 to 2025
- Absolute $ Opportunity Analysis By Activator Type, 2026 to 2036
- Global Market Analysis and Forecast, By Ore Type, 2021 to 2036
- Introduction / Key Findings
- Historical Market Size Value (USD Billion) Analysis By Ore Type, 2021 to 2025
- Current and Future Market Size Value (USD Billion) Analysis and Forecast By Ore Type, 2026 to 2036
- Sphalerite ores
- Oxidized ores
- Gold sulfide ores
- Copper ores
- Polymetallic ores
- Sphalerite ores
- Y-o-Y Growth Trend Analysis By Ore Type, 2021 to 2025
- Absolute $ Opportunity Analysis By Ore Type, 2026 to 2036
- Global Market Analysis and Forecast, By Function, 2021 to 2036
- Introduction / Key Findings
- Historical Market Size Value (USD Billion) Analysis By Function, 2021 to 2025
- Current and Future Market Size Value (USD Billion) Analysis and Forecast By Function, 2026 to 2036
- Mineral surface activation
- Sulfidization support
- Collector response improvement
- Selective flotation control
- Mineral surface activation
- Y-o-Y Growth Trend Analysis By Function, 2021 to 2025
- Absolute $ Opportunity Analysis By Function, 2026 to 2036
- Global Market Analysis and Forecast, By End Use, 2021 to 2036
- Introduction / Key Findings
- Historical Market Size Value (USD Billion) Analysis By End Use, 2021 to 2025
- Current and Future Market Size Value (USD Billion) Analysis and Forecast By End Use, 2026 to 2036
- Base metal concentrators
- Gold plants
- Industrial mineral plants
- Toll processing plants
- Base metal concentrators
- Y-o-Y Growth Trend Analysis By End Use, 2021 to 2025
- Absolute $ Opportunity Analysis By End Use, 2026 to 2036
- Global Market Analysis and Forecast, By Sales Channel, 2021 to 2036
- Introduction / Key Findings
- Historical Market Size Value (USD Billion) Analysis By Sales Channel, 2021 to 2025
- Current and Future Market Size Value (USD Billion) Analysis and Forecast By Sales Channel, 2026 to 2036
- Direct mine contracts
- Chemical distributors
- Reagent service providers
- Regional blending
- Direct mine contracts
- Y-o-Y Growth Trend Analysis By Sales Channel, 2021 to 2025
- Absolute $ Opportunity Analysis By Sales Channel, 2026 to 2036
- Global Market Analysis and Forecast, By Region, 2021 to 2036
- Introduction
- Historical Market Size Value (USD Billion) Analysis By Region, 2021 to 2025
- Current Market Size Value (USD Billion) Analysis and Forecast By Region, 2026 to 2036
- North America
- Latin America
- Western Europe
- Eastern Europe
- East Asia
- South Asia and Pacific
- Middle East & Africa
- Market Attractiveness Analysis By Region
- North America Market Analysis and Forecast, By Country, 2021 to 2036
- Historical Market Size Value (USD Billion) Trend Analysis By Market Taxonomy, 2021 to 2025
- Market Size Value (USD Billion) Forecast By Market Taxonomy, 2026 to 2036
- By Country
- USA
- Canada
- By Activator Type
- By Ore Type
- By Function
- By End Use
- By Sales Channel
- By Country
- Market Attractiveness Analysis
- By Country
- By Activator Type
- By Ore Type
- By Function
- By End Use
- By Sales Channel
- Key Takeaways
- Latin America Market Analysis and Forecast, By Country
- Historical Market Size Value (USD Billion) Trend Analysis By Market Taxonomy, 2021 to 2025
- Market Size Value (USD Billion) Forecast By Market Taxonomy, 2026 to 2036
- By Country
- Brazil
- Mexico
- Chile
- Rest of Latin America
- By Activator Type
- By Ore Type
- By Function
- By End Use
- By Sales Channel
- By Country
- Market Attractiveness Analysis
- By Country
- By Activator Type
- By Ore Type
- By Function
- By End Use
- By Sales Channel
- Key Takeaways
- Western Europe Market Analysis and Forecast, By Country
- Historical Market Size Value (USD Billion) Trend Analysis By Market Taxonomy, 2021 to 2025
- Market Size Value (USD Billion) Forecast By Market Taxonomy, 2026 to 2036
- By Country
- Germany
- UK
- Italy
- Spain
- France
- Nordic
- BENELUX
- Rest of Western Europe
- By Activator Type
- By Ore Type
- By Function
- By End Use
- By Sales Channel
- By Country
- Market Attractiveness Analysis
- By Country
- By Activator Type
- By Ore Type
- By Function
- By End Use
- By Sales Channel
- Key Takeaways
- Eastern Europe Market Analysis and Forecast, By Country
- Historical Market Size Value (USD Billion) Trend Analysis By Market Taxonomy, 2021 to 2025
- Market Size Value (USD Billion) Forecast By Market Taxonomy, 2026 to 2036
- By Country
- Russia
- Poland
- Hungary
- Balkan & Baltic
- Rest of Eastern Europe
- By Activator Type
- By Ore Type
- By Function
- By End Use
- By Sales Channel
- By Country
- Market Attractiveness Analysis
- By Country
- By Activator Type
- By Ore Type
- By Function
- By End Use
- By Sales Channel
- Key Takeaways
- East Asia Market Analysis and Forecast, By Country
- Historical Market Size Value (USD Billion) Trend Analysis By Market Taxonomy, 2021 to 2025
- Market Size Value (USD Billion) Forecast By Market Taxonomy, 2026 to 2036
- By Country
- China
- Japan
- South Korea
- By Activator Type
- By Ore Type
- By Function
- By End Use
- By Sales Channel
- By Country
- Market Attractiveness Analysis
- By Country
- By Activator Type
- By Ore Type
- By Function
- By End Use
- By Sales Channel
- Key Takeaways
- South Asia and Pacific Market Analysis and Forecast, By Country
- Historical Market Size Value (USD Billion) Trend Analysis By Market Taxonomy, 2021 to 2025
- Market Size Value (USD Billion) Forecast By Market Taxonomy, 2026 to 2036
- By Country
- India
- ASEAN
- Australia & New Zealand
- Rest of South Asia and Pacific
- By Activator Type
- By Ore Type
- By Function
- By End Use
- By Sales Channel
- By Country
- Market Attractiveness Analysis
- By Country
- By Activator Type
- By Ore Type
- By Function
- By End Use
- By Sales Channel
- Key Takeaways
- Middle East & Africa Market Analysis and Forecast, By Country
- Historical Market Size Value (USD Billion) Trend Analysis By Market Taxonomy, 2021 to 2025
- Market Size Value (USD Billion) Forecast By Market Taxonomy, 2026 to 2036
- By Country
- Kingdom of Saudi Arabia
- Other GCC Countries
- Türkiye
- South Africa
- Other African Union
- Rest of Middle East & Africa
- By Activator Type
- By Ore Type
- By Function
- By End Use
- By Sales Channel
- By Country
- Market Attractiveness Analysis
- By Country
- By Activator Type
- By Ore Type
- By Function
- By End Use
- By Sales Channel
- Key Takeaways
- Key Countries Market Analysis
- USA
- Pricing Analysis
- Market Share Analysis, 2025
- By Activator Type
- By Ore Type
- By Function
- By End Use
- By Sales Channel
- Canada
- Pricing Analysis
- Market Share Analysis, 2025
- By Activator Type
- By Ore Type
- By Function
- By End Use
- By Sales Channel
- Mexico
- Pricing Analysis
- Market Share Analysis, 2025
- By Activator Type
- By Ore Type
- By Function
- By End Use
- By Sales Channel
- Brazil
- Pricing Analysis
- Market Share Analysis, 2025
- By Activator Type
- By Ore Type
- By Function
- By End Use
- By Sales Channel
- Chile
- Pricing Analysis
- Market Share Analysis, 2025
- By Activator Type
- By Ore Type
- By Function
- By End Use
- By Sales Channel
- Germany
- Pricing Analysis
- Market Share Analysis, 2025
- By Activator Type
- By Ore Type
- By Function
- By End Use
- By Sales Channel
- UK
- Pricing Analysis
- Market Share Analysis, 2025
- By Activator Type
- By Ore Type
- By Function
- By End Use
- By Sales Channel
- Italy
- Pricing Analysis
- Market Share Analysis, 2025
- By Activator Type
- By Ore Type
- By Function
- By End Use
- By Sales Channel
- Spain
- Pricing Analysis
- Market Share Analysis, 2025
- By Activator Type
- By Ore Type
- By Function
- By End Use
- By Sales Channel
- France
- Pricing Analysis
- Market Share Analysis, 2025
- By Activator Type
- By Ore Type
- By Function
- By End Use
- By Sales Channel
- India
- Pricing Analysis
- Market Share Analysis, 2025
- By Activator Type
- By Ore Type
- By Function
- By End Use
- By Sales Channel
- ASEAN
- Pricing Analysis
- Market Share Analysis, 2025
- By Activator Type
- By Ore Type
- By Function
- By End Use
- By Sales Channel
- Australia & New Zealand
- Pricing Analysis
- Market Share Analysis, 2025
- By Activator Type
- By Ore Type
- By Function
- By End Use
- By Sales Channel
- China
- Pricing Analysis
- Market Share Analysis, 2025
- By Activator Type
- By Ore Type
- By Function
- By End Use
- By Sales Channel
- Japan
- Pricing Analysis
- Market Share Analysis, 2025
- By Activator Type
- By Ore Type
- By Function
- By End Use
- By Sales Channel
- South Korea
- Pricing Analysis
- Market Share Analysis, 2025
- By Activator Type
- By Ore Type
- By Function
- By End Use
- By Sales Channel
- Russia
- Pricing Analysis
- Market Share Analysis, 2025
- By Activator Type
- By Ore Type
- By Function
- By End Use
- By Sales Channel
- Poland
- Pricing Analysis
- Market Share Analysis, 2025
- By Activator Type
- By Ore Type
- By Function
- By End Use
- By Sales Channel
- Hungary
- Pricing Analysis
- Market Share Analysis, 2025
- By Activator Type
- By Ore Type
- By Function
- By End Use
- By Sales Channel
- Kingdom of Saudi Arabia
- Pricing Analysis
- Market Share Analysis, 2025
- By Activator Type
- By Ore Type
- By Function
- By End Use
- By Sales Channel
- Türkiye
- Pricing Analysis
- Market Share Analysis, 2025
- By Activator Type
- By Ore Type
- By Function
- By End Use
- By Sales Channel
- South Africa
- Pricing Analysis
- Market Share Analysis, 2025
- By Activator Type
- By Ore Type
- By Function
- By End Use
- By Sales Channel
- USA
- Market Structure Analysis
- Competition Dashboard
- Competition Benchmarking
- Market Share Analysis of Top Players
- By Regional
- By Activator Type
- By Ore Type
- By Function
- By End Use
- By Sales Channel
- Emerging Startups
- Innovation Benchmarking
- Competition Analysis
- Competition Deep Dive
- Solvay
- Overview
- Product Portfolio
- Profitability by Market Segments
- Sales Footprint
- Strategy Overview
- Marketing Strategy
- Product Strategy
- Channel Strategy
- Clariant
- Nouryon
- Orica
- Axis House
- Senmin
- Nasaco
- Coogee Chemicals
- Quadra Chemicals
- Kemcore
- Solvay
- Case Studies
- Success Stories
- Recent Developments
- Competition Deep Dive
- Assumptions & Acronyms Used


