The food preservation equipment market is estimated to be valued at USD 48.6 billion in 2025 and is projected to reach USD 88.7 billion by 2035, registering a compound annual growth rate (CAGR) of 6.2% over the forecast period.
The market experiences substantial expansion driven by food safety regulations, extended shelf life demands, and supply chain efficiency requirements that necessitate advanced preservation technologies capable of maintaining nutritional content while preventing spoilage across diverse food categories. Commercial food processors implement integrated preservation systems that coordinate refrigeration, dehydration, freezing, and modified atmosphere packaging within unified platforms that optimize food quality retention while reducing waste throughout processing and distribution operations. The industry's evolution toward natural preservation methods creates demand for equipment utilizing high-pressure processing, pulsed electric fields, and ultraviolet sterilization technologies that eliminate pathogens without chemical additives or thermal degradation.
Food processing facilities represent the dominant consumption segment where preservation equipment enables large-scale production of shelf-stable products including canned goods, frozen foods, and dehydrated ingredients requiring precise temperature control and moisture management throughout processing cycles. Manufacturing operations specify equipment systems that accommodate varying product characteristics while maintaining consistent preservation parameters necessary for regulatory compliance and quality assurance standards. Production managers balance preservation effectiveness against energy consumption and processing time requirements that directly impact operational costs and throughput capacity across diverse product lines.
Cold chain infrastructure markets demonstrate increasing adoption of advanced refrigeration and freezing systems that maintain precise temperature control throughout food storage and distribution networks where thermal fluctuations could compromise product safety and quality characteristics. Food distributors utilize blast freezing equipment and controlled atmosphere storage systems that preserve fresh produce, meat products, and prepared foods during extended storage periods while maintaining optimal texture and nutritional properties. Temperature monitoring integration provides real-time tracking and alarm systems that prevent temperature excursions affecting product integrity and regulatory compliance.
Innovation development focuses on non-thermal preservation technologies including high-pressure processing, pulsed electric fields, and cold plasma treatments that achieve microbial inactivation while preserving nutritional content and sensory characteristics that thermal processing methods could compromise. Smart packaging integration incorporates preservation-enhancing features including oxygen scavenging, moisture control, and antimicrobial properties within packaging systems that extend product shelf life beyond traditional preservation methods alone.
Regulatory compliance drives equipment development toward systems that provide comprehensive documentation and validation capabilities necessary for food safety audits and regulatory inspections while maintaining traceability throughout preservation processes that support recall procedures and quality management systems required by food safety standards.
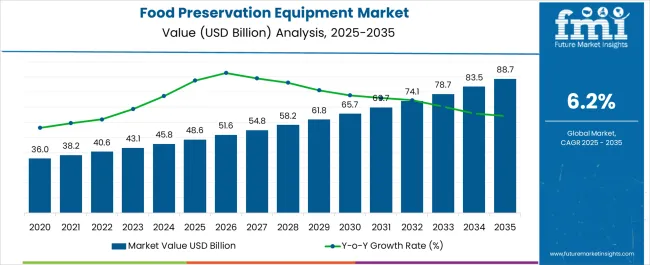
| Metric | Value |
|---|---|
| Food Preservation Equipment Market Estimated Value in (2025 E) | USD 48.6 billion |
| Food Preservation Equipment Market Forecast Value in (2035 F) | USD 88.7 billion |
| Forecast CAGR (2025 to 2035) | 6.2% |
The food preservation equipment market is witnessing strong growth driven by rising global demand for processed and packaged food, increasing focus on food safety standards, and technological advancements in preservation techniques. Growing consumer preference for longer shelf life products and the expansion of international food trade are further propelling the adoption of advanced preservation systems.
Regulatory mandates emphasizing hygiene, microbial safety, and sustainable processing methods are pushing manufacturers to invest in energy efficient and automated equipment. Developments in heat treatment, cold storage integration, and smart monitoring technologies are also shaping the industry landscape.
The future outlook remains favorable as food producers seek solutions that minimize waste, enhance product quality, and align with global sustainability initiatives.
The market is segmented by Product Type and End User and region. By Product Type, the market is divided into Pasteurizer, Refrigerators, Fermenting Equipment, Canning Equipment, and Irradiation Equipment. In terms of End User, the market is classified into Poultry Industry, Seafood Industry, Beverage Industry, Snacks Industry, Dairy Products Industry, Health Foods Industry (Whey protein etc.), and Bakery Industry. Regionally, the market is classified into North America, Latin America, Western Europe, Eastern Europe, Balkan & Baltic Countries, Russia & Belarus, Central Asia, East Asia, South Asia & Pacific, and the Middle East & Africa.
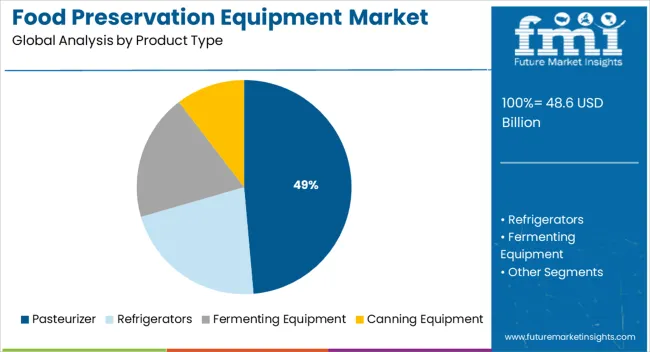
The pasteurizer product type segment is expected to account for 48.60% of total market revenue by 2025, making it the dominant category. This leadership is supported by its ability to ensure microbial safety, extend shelf life, and preserve the nutritional quality of food and beverages.
The wide applicability of pasteurization across dairy, beverages, and ready to eat products has strengthened its market position. Advances in continuous processing systems and energy efficient pasteurization technologies have further improved operational performance, reducing both costs and environmental impact.
As regulatory authorities continue to emphasize safe food processing standards, pasteurizers remain the most widely adopted equipment within the market.
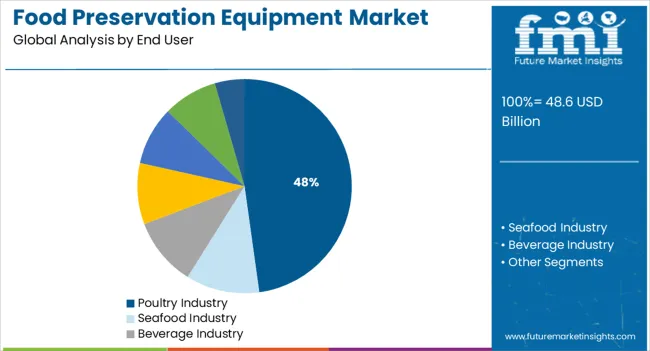
The poultry industry end user segment is projected to hold 47.80% of market revenue by 2025, making it the leading application area. Rising global poultry consumption, coupled with stringent food safety regulations, has accelerated the need for advanced preservation systems.
Equipment adoption is being driven by the necessity to prevent microbial contamination, enhance freshness, and maintain nutritional integrity during storage and distribution. Large scale poultry producers are increasingly investing in preservation equipment to meet export quality standards and ensure compliance with international regulations.
The growing demand for processed poultry products, both fresh and frozen, has reinforced the leadership of this segment, making it a critical driver of growth within the food preservation equipment market.
Over the past half-decade (2020 to 2025), the global demand for food preservation equipment increased at 5.5% CAGR. However, due to increasing consumption of packaged and ready-to-cook food products, a robust CAGR of 6.2% has been predicted by Future Market Insights for the worldwide food preservation equipment industry for the projection period (2025 to 2035)
Consumers choose packaged food due to freshness, convenience, and hygiene, which is boosting the food preservation equipment industry. Food manufacturing companies use food preservation equipment to prevent microbial attack and extend shelf life of products.
Factors such as busy lifestyles and growing popularity of ready-to-cook meals are expected to generate high demand for processed food products like canned and frozen ones during the forecast period. This will create lucrative opportunities for food preservation equipment manufacturers.
Implementation of government regulations and rules surrounding food safety and effective quality, which are driving manufacturers to engage in sustainable and state-of-the-art food preservation equipment will foster market development during the projection period.
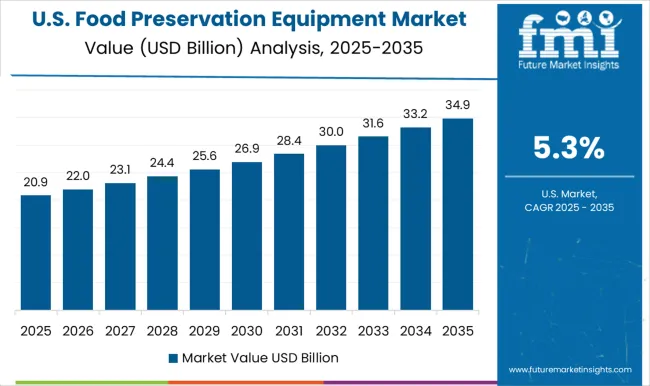
Growing Focus Towards Preventing Foodborne Illnesses Boosting the United States Market
According to Future Market Insights, the United States food preservation equipment market is currently valued at USD 8.2 billion and it holds around 68% share of the North America market. This is attributed to the rising demand for advanced food preservation equipment from industries such as poultry, beverages, and dairy.
Rising incidence of food-borne diseases across the United States is playing a crucial role in propelling food preservation demand. According to the Centers for Disease Control and Prevention (CDC), around 48 million people get sick while 3000 die of foodborne diseases each year across the United States This has prompted food manufacturing companies to employ various food preservation equipment to reduce food spoilage, prevent foodborne illnesses, and extend shelf life of products.
Similarly, continuous new product launches with enhanced features by United States food preservation equipment manufacturers will aid in the expansion of the market during the projection period.
Growing Demand for Processed Foods Propelling Food Preservation Equipment Sales in China
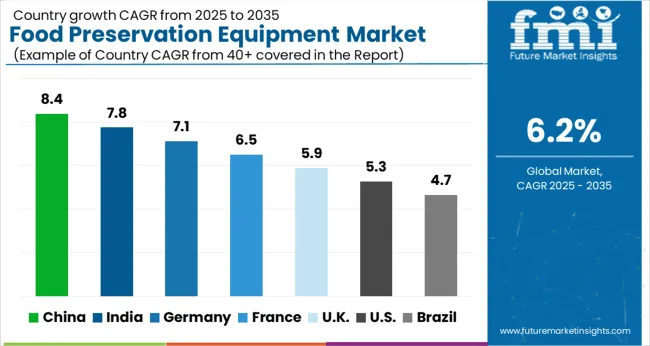
As per Future Market Insights’ latest report, food preservation equipment sales across China are likely to surge at a healthy pace during the next ten years owing to the rising demand for processed food products, increase in export of meat products, and availability of low-cost food preservation tools.
Due to its rapid development over the last several decades, the people of China have developed a fast and stressful lifestyle. This has led to an increase in demand for processed foods. People are spending large amounts on purchasing processed food products like canned and frozen foods. This is positively impacting food preservation equipment industry in the country.
Food preservative equipment are essential to increase shelf life of processed food. This equipment is extensively being used across food manufacturing and processing industries to increase shelf life of products and prevent microbial growth.
With rapid population growth and skyrocketing demand for processed or packaged food products, China may overtake the United States as the dominant market for food preservation equipment during the projected period.
Growing Adoption Across Residential and Commercial Sectors Propelling Refrigerators Demand
According to Future Market Insights, refrigerators segment currently holds a substantial revenue share of the global food preservation equipment and it is expected to grow at a robust pace during the forecast period.
Rising adoption across residential and commercial sectors to prevent food spoilage and increase shelf life of products is a key factor driving demand for refrigerators.
Food preservation equipment such as visi coolers, freezers, walk-in refrigerators, and confectionery cabinets are being increasingly employed across commercial kitchens, food processing facilities, and other sectors to preserve food products and reduce chances of food spoilage.
Poultry Industry to Create Lucrative Opportunities for Food Preservation Equipment Manufacturers
Based on end user, the global market is segmented into poultry industry, seafood industry, beverages industry, snacks industry, dairy products industry, health foods industry, and bakery industry.
Among these, poultry industry is expected to emerge as the leading end user of food preservation equipment during the projection period. This is attributed to the rising demand for poultry products worldwide and increasing adoption of food preservation equipment in poultry processing units for longer-term storage.
To preserve poultry products and extend their shelf life, poultry processing companies are increasingly using a wide range of preservation techniques including freezing, chilling, and canning. This in turn is generating high demand for food preservation equipment and the trend is expected to continue during the projection period.
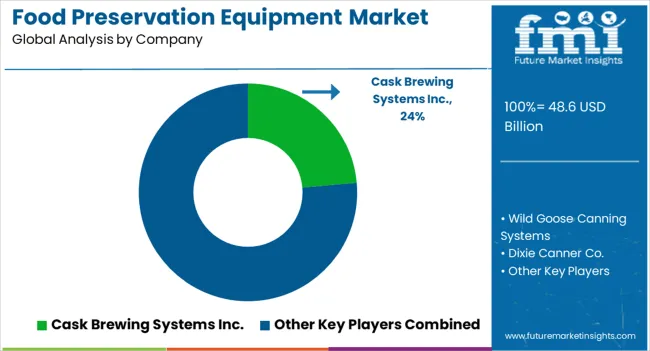
The food preservation equipment market is led by global food technology and processing system manufacturers offering advanced solutions for extending shelf life, maintaining quality, and ensuring food safety. GEA Group Aktiengesellschaft dominates with a wide range of preservation systems, including refrigeration, pasteurization, and vacuum technologies used in dairy, meat, and beverage processing. Alfa Laval AB provides thermal and separation equipment designed for hygienic processing and preservation, focusing on efficient heat exchange and microbial control.
SPX FLOW Inc. and JBT Corporation supply integrated food preservation systems such as thermal sterilization, high-pressure processing, and aseptic filling lines used in ready-to-eat and packaged food production. Marel hf delivers preservation equipment for meat, poultry, and seafood, combining chilling and portioning systems that ensure consistent quality.
Bühler AG offers preservation technologies integrated with milling and drying systems, ensuring moisture control and extended product stability for cereals, grains, and snack foods. Krones AG provides aseptic processing and filling equipment used for beverage and liquid food preservation, enhancing product safety and packaging integrity. IMA S.p.A. specializes in vacuum sealing, modified atmosphere packaging, and sterilization machinery for dry and processed food products. Ishida Co. Ltd. and Multivac Sepp Haggenmüller SE & Co. KG focus on advanced weighing, packaging, and vacuum sealing equipment that extend shelf life while maintaining freshness and appearance.
| Attribute | Details |
|---|---|
| Current Market Size (2025) | USD 48.6 billion |
| Estimated Market Size (2035) | USD 88.7 billion |
| Anticipated Growth Rate (2025 to 2035) | 6.2% CAGR |
| Forecast Period | 2025 to 2035 |
| Historical Data Available for | 2020 to 2025 |
| Market Analysis | USD Million for Value and Units for Volume |
| Key Regions Covered | North America; Latin America; Europe; Asia Pacific; Oceania; Middle East and Africa |
| Key Countries Covered | United States, Canada, Mexico, Germany, United Kingdom, France, Italy, Spain, China, Japan, India, South Korea, Australia, Brazil, Argentina, South Africa, United Arab Emirates |
| Key Segments Covered | Product Type, End User, Region |
| Key Companies Profiled |
GEA Group Aktiengesellschaft, Alfa Laval AB, SPX FLOW Inc., JBT Corporation, Marel hf, Bühler AG, Krones AG, IMA S.p.A., Ishida Co. Ltd., and Multivac Sepp Haggenmüller SE & Co. KG. |
| Report Coverage | Market Forecast, Company Share Analysis, Competitive Landscape, DROT Analysis, Market Dynamics and Challenges, and Strategic Growth Initiatives |
Pasteurizer
Refrigerators
Fermenting Equipment
Canning Equipment
Irradiation Equipment
The global food preservation equipment market is estimated to be valued at USD 48.6 billion in 2025.
The market size for the food preservation equipment market is projected to reach USD 88.7 billion by 2035.
The food preservation equipment market is expected to grow at a 6.2% CAGR between 2025 and 2035.
The key product types in food preservation equipment market are pasteurizer, high-temperature short time pasteurizer, higher heat shorter time, ultra high temperature, ultra pasteurized, refrigerators, manual and irradiation equipment.
In terms of end user, poultry industry segment to command 47.8% share in the food preservation equipment market in 2025.


Full Research Suite comprises of:
Market outlook & trends analysis
Interviews & case studies
Strategic recommendations
Vendor profiles & capabilities analysis
5-year forecasts
8 regions and 60+ country-level data splits
Market segment data splits
12 months of continuous data updates
DELIVERED AS:
PDF EXCEL ONLINE
Food & Beverage OEE Software Market Size and Share Forecast Outlook 2025 to 2035
Food Grade Crosslinked Polyvinylpolypyrrolidone (PVPP) Market Size and Share Forecast Outlook 2025 to 2035
Food Grade Cassia Gum Powder Market Size and Share Forecast Outlook 2025 to 2035
Food Grade Dry Film Lubricant Market Size and Share Forecast Outlook 2025 to 2035
Food Basket Market Forecast and Outlook 2025 to 2035
Food Grade Tremella Polysaccharide Market Size and Share Forecast Outlook 2025 to 2035
Food Sorting Machine Market Size and Share Forecast Outlook 2025 to 2035
Foodservice Paper Bag Market Size and Share Forecast Outlook 2025 to 2035
Food Stabilizers Market Size and Share Forecast Outlook 2025 to 2035
Food Packaging Film Market Size and Share Forecast Outlook 2025 to 2035
Food Certification Market Size and Share Forecast Outlook 2025 to 2035
Food Tray Market Size and Share Forecast Outlook 2025 to 2035
Food & Beverage Industrial Disinfection and Cleaning Market Size and Share Forecast Outlook 2025 to 2035
Food Technology Market Size and Share Forecast Outlook 2025 to 2035
Food Tourism Sector Market Size and Share Forecast Outlook 2025 to 2035
Food Processing Boiler Market Size and Share Forecast Outlook 2025 to 2035
Food Packaging Machines Market Size and Share Forecast Outlook 2025 to 2035
Food Minerals Market Size and Share Forecast Outlook 2025 to 2035
Food And Beverage Chemicals Market Size and Share Forecast Outlook 2025 to 2035
Food and Beverage Industry Software Market Size and Share Forecast Outlook 2025 to 2035

Thank you!
You will receive an email from our Business Development Manager. Please be sure to check your SPAM/JUNK folder too.
Chat With
MaRIA