Friction Tape Market Size and Share Forecast Outlook 2025 to 2035

The friction tape market is expected to grow from USD 1.2 billion in 2025 to USD 1.7 billion by 2035, adding USD 0.5 billion over the ten-year period. This represents a 41.7% total market growth, supported by a compound annual growth rate (CAGR) of 4.1%.
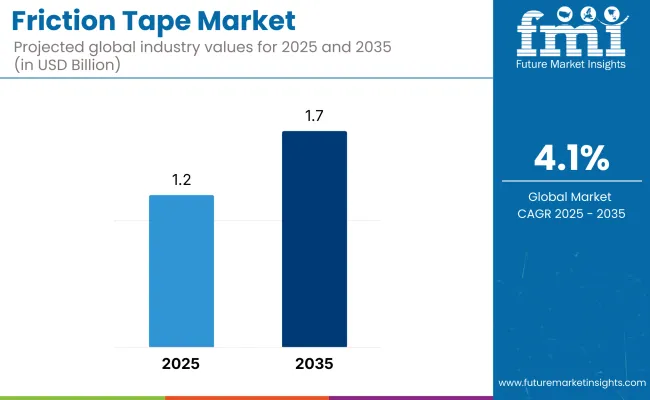
Quick Stats Of Friction Tape Market

  • Market Value (2025): USD 1.2 billion
  • Market Forecast Value (2035): USD 1.7 billion
  • Market Forecast CAGR: 4.1%
  • Leading Segment in 2025: Cotton Cloth (47.8%)
  • Key Growth Regions: Asia-Pacific (India is the fastest-growing market with 5.4% CAGR)
  • Top Key Players: Euro Tapes Pvt. Ltd., Medi Spare, AVR Industries Private Limited, Champion Tape, Goyal Electric Works, and 3M Company

Friction Tape Market

Metric Value
Industry Size (2025E) USD 1.2 billion
Industry Value (2035F) USD 1.7 billion
CAGR (2025 to 2035) 4.1%

Over the forecast period, the market is projected to expand by a 1.4 multiple. In the first half of the decade (2025-2030), the market increases from USD 1.2 billion to USD 1.4 billion, contributing USD 0.2 billion, or 40.0% of the total decade’s growth. Growth in this period is driven by demand from electrical insulation, sports grip applications, and industrial bundling, particularly in North America and Asia Pacific. Cloth-backed tapes with high friction coefficients dominate due to their durability and performance under abrasion.

In the second half (2030-2035), the market rises from USD 1.4 billion to USD 1.7 billion, adding USD 0.3 billion, or 60.0% of the decade’s total growth. This phase benefits from rising adoption in renewable energy installations, EV manufacturing, and specialized industrial equipment maintenance, where enhanced tensile strength and heat resistance are critical. Eco-friendly, solvent-free adhesive formulations gain traction as sustainability regulations tighten across manufacturing industries.

From 2020 to 2024, the friction tape Market grew from USD 1.0 billion to USD 1.1 billion, driven by hardware-centric adoption in electrical insulation, wire harnessing, and sports equipment applications where abrasion resistance and grip enhancement are essential. During this period, the competitive landscape was dominated by adhesive and industrial tape manufacturers controlling nearly 70% of market revenue, with leaders such as Euro Tapes Pvt. Ltd., Medi Spare, and AVR Industries Private Limited focusing on durable cotton cloth-backed tapes with rubber-based adhesives.

Competitive differentiation relied on tensile strength, temperature resistance, and adhesion to irregular surfaces, while digital-enabled inventory tracking or usage analytics remained bundled into broader distributor offerings rather than acting as standalone revenue streams. Service-based models including custom printing and specialty roll conversion accounted for less than 10% of total market value, as most demand was met through standardized bulk supply channels.

Demand for friction tape will expand to USD 1.7 billion in 2035, and the revenue mix will shift as specialty formulations, eco-friendly adhesives, and smart-label integration grow to over 40% share. Traditional tape suppliers face rising competition from niche players offering fire-retardant, UV-resistant, and biodegradable friction tape solutions.

Why the Friction Tape Market is growing?

Rising demand for durable, non-slip insulation and protective wrapping solutions in electrical, industrial, and automotive applications is driving the growth of the friction tape market. Made from cloth impregnated with adhesive, friction tapes provide strong grip, abrasion resistance, and insulation, making them essential in environments where mechanical protection and electrical safety are critical. Their versatility in both repair and original equipment manufacturing has sustained consistent market adoption.

Cloth-backed rubber adhesive friction tapes have gained popularity due to their high tensile strength, flexibility, and ability to adhere securely to irregular surfaces. These tapes offer a combination of mechanical protection and insulation, making them suitable for binding electrical wires, protecting cable splices, and improving grip on tools and sports equipment. Their performance in high-friction and high-wear scenarios adds to their industrial utility.

Segmental Analysis

The market is segmented by material, application, adhesion strength, end-use industry, and region. Material segmentation includes cotton cloth, rubber-resin blend, and non-woven fabric, offering varied durability, flexibility, and moisture resistance for different usage environments. Application areas include electrical insulation, grip enhancement, sports equipment, and tool wrapping, each requiring specific mechanical strength and surface adhesion properties.

Adhesion strength is categorized into low tack, medium tack, and high tack, allowing selection based on ease of removal, secure bonding, or long-term durability. End-use industries include electrical, automotive, industrial maintenance, and sports, reflecting the tape’s utility in both functional and performance-enhancing roles. Regionally, the market is segmented into North America, Europe, Asia-Pacific, Latin America, and the Middle East & Africa.
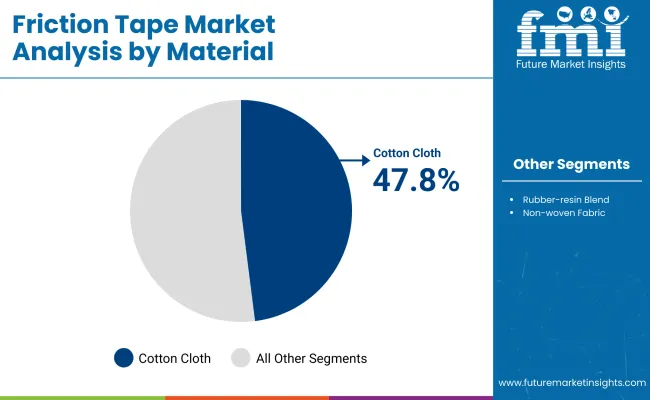
Cotton Cloth Segment Dominates for Its Durability and Flexibility

Friction Tape Market By Material

The cotton cloth segment is expected to capture the highest share of 47.8% in the Friction Tape Market by 2025, supported by its superior tensile strength, abrasion resistance, and adaptability across various applications. Cotton cloth tapes provide a textured surface that enhances grip and withstands mechanical stress, making them ideal for wrapping, bundling, and reinforcement tasks in industrial and electrical settings.

Manufacturers are also advancing cotton cloth tape designs with enhanced flame retardancy and weather resistance to meet evolving safety regulations. This balance of mechanical performance and comfort handling continues to position cotton cloth as the preferred substrate for heavy-duty friction tape applications worldwide.
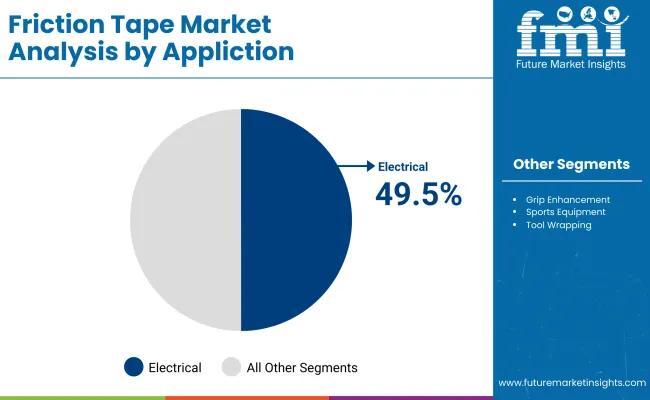
Electrical Segment Leads on Back of Safety-Critical Applications

Friction Tape Market By Application

The electrical segment is projected to command a 49.5% share in 2025, driven by the growing need for reliable insulation and mechanical protection in wiring systems. Friction tapes are valued for their ability to maintain adhesion and insulation under varying temperature and moisture conditions, making them indispensable in electrical maintenance and repair work.

As industries expand infrastructure for power distribution, telecommunications, and renewable energy, the demand for tapes that combine mechanical strength with electrical safety is rising. This has led to higher adoption of friction tapes in both commercial installations and field servicing.

Electrical Insulation Application Dominates Due to Enhanced Safety Requirements

Electrical insulation applications are projected to hold a 39.3% market share by 2025, underscoring the critical importance of friction tapes in safeguarding electrical systems from shorts, arc faults, and premature component wear. This dominant share reflects their indispensable role in both preventive maintenance and new installations across residential, commercial, industrial, and transportation sectors. Friction tapes’ cloth-based backing offers exceptional flexibility, enabling secure wrapping around irregular, angled, or confined surfaces without creating air gaps that could compromise insulation performance.

Their proven ability to withstand challenging operating conditions ranging from high-vibration machinery and outdoor utility wiring to high-voltage equipment in power generation plants has positioned them as a trusted choice among electricians, OEMs, and maintenance teams worldwide. In addition, the adhesive properties are engineered to remain stable across varying temperatures, moisture exposure, and mechanical stress, which is particularly critical for environments where operational continuity is non-negotiable.

High Tack Adhesion Strength Segment Leads for Secure, Long-Lasting Bonds

The high tack adhesion strength segment is projected to account for 51.2% of the adhesion strength category by 2025, reflecting its dominant role in applications that demand secure, long-lasting bonds even under challenging operating conditions. High tack friction tapes are valued for their ability to deliver instant and aggressive adhesion, gripping firmly to a wide variety of surfaces including rough, porous, or dusty substrates without the need for extensive surface preparation. This immediate bond formation is a critical advantage in time-sensitive maintenance and assembly tasks where reliability is non-negotiable.

In demanding environments such as heavy industrial machinery, automotive assembly lines, and outdoor electrical installations, adhesives are constantly subjected to vibration, thermal cycling, and environmental exposure including moisture, UV radiation, and particulate contamination. High tack formulations ensure that protective wraps, cable bundles, and insulation layers remain firmly in place despite these stressors, significantly reducing the risk of system failures, downtime, or costly rework.

What are the Drivers, Restraints, and Key Trends of the Friction Tape Market?

Limited weather resistance and competition from advanced insulation materials constrain market growth, even as demand rises in electrical, automotive, and heavy industrial applications for durable, non-slip adhesive tapes that provide mechanical protection and enhanced grip.

Durability and Multi-functionality Driving Adoption in Electrical and Industrial Sectors

Friction tape remains a preferred solution in electrical wiring, automotive harnessing, and heavy equipment maintenance due to its strong adhesion, abrasion resistance, and ability to provide both insulation and mechanical grip. In electrical work, it serves as a protective overwrap for splices and terminals, adding an extra layer of wear resistance. In automotive and machinery applications, its textured surface helps secure connections and reduce slippage under vibration or load stress.

Weathering Limitations and Rising Alternatives in Specialty Applications

Despite its robust performance in many settings, friction tape is less suited for prolonged exposure to moisture, UV radiation, or extreme temperatures. Over time, its rubber-based adhesive can degrade, losing tackiness and leaving residue. In applications requiring long-term dielectric performance or flame resistance, alternatives such as PVC insulation tape, self-fusing silicone tape, and specialized polymer-based wraps are gaining preference.

Material Innovation and Niche Performance-focused Variants Emerging

A key trend in the friction tape market is the development of enhanced formulations with improved weather resistance, higher dielectric strength, and eco-friendlier adhesives. Manufacturers are introducing blends that resist drying and cracking while maintaining strong adhesion on varied surfaces.
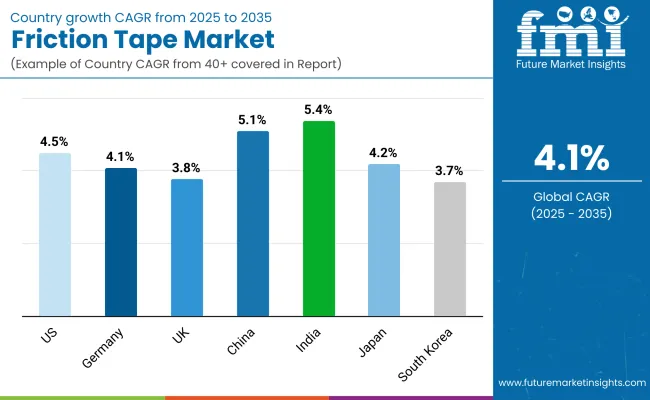
Analysis of Friction Tape Market by Key Countries

Friction Tape Market By Country

The global friction tape market is witnessing steady growth, driven by rising demand for electrical insulation, automotive harness protection, and industrial sealing applications. The shift toward high-performance, flame-retardant, and eco-friendly adhesive formulations is pushing innovation in the sector.

Asia-Pacific countries such as India and China are leading the growth momentum, fueled by large-scale infrastructure expansion, vehicle production, and electrification projects. In contrast, developed economies including the USA, UK, and Germany are focused on upgrading tape performance for safety compliance, vibration resistance, and sustainability goals. Manufacturers are increasingly adopting advanced coating, calendaring, and recyclable material technologies to meet regulatory and industry-specific requirements.

Sales Outlook for Friction Tape Market in the United States

The friction tape market in the United States is poised for steady expansion, projected to grow at a CAGR of 4.5% between 2025 and 2035. This growth trajectory is anchored in rising demand from electrical contractors, automotive OEMs, and industrial maintenance service providers who increasingly prioritize insulation, bundling, and abrasion protection for wiring and cabling systems.

Upgraded safety codes and sustainability mandates are encouraging manufacturers to launch flame-retardant, moisture-resistant, and eco-friendly grades, thereby aligning with evolving regulatory frameworks. Adoption is also being spurred by modernization projects in industrial facilities, urban infrastructure upgrades, and vehicle electrification programs.

  • Electrical maintenance crews are employing friction tapes for high-voltage cable insulation, splice protection, and emergency field repairs, ensuring extended operational life of power systems.
  • Automotive plants are integrating abrasion-resistant grades for engine bay wiring harnesses, enhancing both mechanical protection and vibration dampening.
  • Industrial operators are incorporating sustainable adhesive formulations into preventive maintenance programs, aligning with corporate ESG goals.

Growth and Expansion Outlook for Friction Tape Market in Germany

Germany’s friction tape market is forecast to advance at a CAGR of 4.1%, supported by its globally renowned automotive industry, robust renewable energy infrastructure, and precision-driven manufacturing base. Compliance with EU safety standards and the country’s engineering excellence are driving the demand for premium-grade tapes that offer superior adhesion, durability, and resistance to environmental wear.

Manufacturers are focusing on recyclable backings and solvent-free adhesive technologies to align with Germany’s leadership in circular economy initiatives. The adoption curve is being accelerated by investments in offshore wind farms, e-mobility, and automated production lines.

  • Wind farm maintenance teams are utilizing moisture-sealed friction tapes for turbine cable terminations to mitigate corrosion risk.
  • Automotive assembly plants are applying high-adhesion tapes for vibration control in harness systems, critical to EV performance.
  • Local manufacturers are promoting recyclable and low-carbon footprint tape variants to meet policy-driven sustainability targets.

Growth and Expansion Outlook for Friction Tape Market in the United Kingdom

The United Kingdom’s friction tape market is anticipated to grow at a CAGR of 3.8% during 2025-2035, with demand emerging from construction, electrical retrofits, and the marine and defense sectors. Urban regeneration programs, electrification of transport systems, and naval infrastructure upgrades are creating new application avenues. Product innovation is centering on high-temperature, corrosion-resistant, and flame-retardant tapes to meet the harsh operational environments of marine vessels, industrial plants, and military assets. Government-backed safety codes and green building initiatives are also shaping procurement patterns.

  • Marine engineering companies are bundling cables on offshore platforms using weather-resistant tapes.
  • Construction contractors are adopting flame-resistant grades for safe indoor wiring in both residential and commercial retrofits.
  • Defense suppliers are incorporating friction tapes into field repair kits, ensuring reliability during mission-critical operations.

Sales Outlook for Friction Tape Market in China

China’s friction tape market is projected to witness the fastest industrial-scale adoption in Asia, with a CAGR of 5.1% driven by rapid manufacturing expansion, automotive production growth, and large-scale electrification projects. Local manufacturers are scaling production capacity through advanced coating and extrusion technologies, targeting both domestic and export markets.

Government investments in smart grid infrastructure, renewable energy, and high-speed rail are expanding tape usage across multiple verticals. In parallel, EV manufacturing hubs are pushing demand for high-voltage insulation tapes that meet UL and IEC compliance standards.

  • EV assembly plants are applying specialized high-voltage insulation tapes for battery and motor wiring systems.
  • Heavy equipment manufacturers are selecting moisture-resistant variants for outdoor and mining machinery installations.
  • OEMs are adhering to international standards to facilitate penetration into North American and European markets.

Growth and Expansion Outlook for Friction Tape Market in India

India’s friction tape market is forecast to record the highest CAGR among major economies, 5.4% between 2025 and 2035, propelled by power grid modernization, rural electrification drives, and expanding automotive harness production. Government-led infrastructure schemes and the shift toward e-mobility are widening usage in both utilities and transport.

SMEs in the country are leveraging cost-effective raw materials and enhanced tensile strength designs to cater to large-scale domestic and export orders. This is complemented by the Make in India initiative, which supports local manufacturing of industrial consumables.

  • Utility companies are deploying friction tapes for transformer wiring and overhead cable jointing.
  • Automotive component suppliers are using heat-resistant grades in engine compartments to improve harness longevity.
  • SMEs are innovating low-cost yet durable tape options to serve high-volume demand from regional contractors.

Growth and Expansion Outlook for Friction Tape Market in Japan

Japan’s friction tape market is expected to rise at a CAGR of 4.2%, driven by electronics assembly, railway maintenance, and industrial machinery production. Compact roll designs and biodegradable adhesives are gaining traction to meet Japan’s emphasis on space efficiency and environmental stewardship. Rail and manufacturing sectors value high-friction, vibration-resistant grades for their precision and long-term durability.

  • Electronics manufacturing plants are adopting anti-static friction tapes for PCB assembly in clean environments.
  • Railway operators are applying vibration-dampening tapes for cable bundling in rolling stock and stations.
  • Tape manufacturers are investing in biodegradable adhesive technologies to meet national sustainability objectives.

Opportunity Analysis of the South Korea Friction Tape Market

South Korea’s friction tape market is projected to expand at a CAGR of 3.7%, anchored in shipbuilding, semiconductor fabrication, and industrial automation sectors. The country’s focus on high-value manufacturing is creating opportunities for premium-grade tapes with anti-static, high-adhesion, and abrasion-resistant properties. Shipyards, electronics cleanrooms, and smart factories are major end-users, driving the development of specialized products for each sector’s unique demands.
  • Shipbuilding facilities are integrating friction tapes for marine cable insulation to combat saltwater-induced degradation.
  • Semiconductor fabs are deploying anti-static tapes to control electrostatic discharge in cleanroom operations.
  • Smart manufacturing plants are investing in automated tape applicators for precision assembly and operational efficiency.

Competitive Landscape of Friction Tape Market

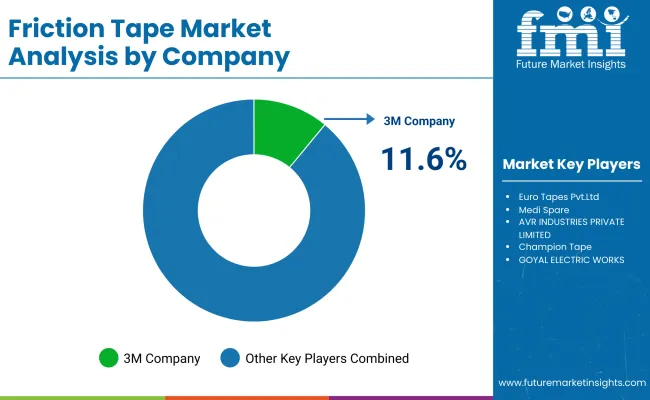
Friction Tape Market By Company

The friction tape market is moderately fragmented, with global adhesive leaders, electrical insulation specialists, and regionally focused tape manufacturers competing across automotive, electrical, and industrial maintenance sectors.

Global players such as 3M Company hold significant market share, driven by high-tensile cloth backings, abrasion resistance, and consistent electrical insulation performance. Their strategies increasingly emphasize heat-resistant formulations, solvent-free adhesives, and compliance with ASTM and IEC safety standards for wiring and harness applications.

Established mid-sized players including Euro Tapes Pvt. Ltd., AVR Industries Private Limited, and Champion Tape are expanding adoption through industrial-grade friction tapes designed for mechanical grip, bundling, and wire protection in automotive and heavy equipment manufacturing. These companies focus on durability under high-friction conditions, strong adhesion to irregular surfaces, and compatibility with both indoor and outdoor use.

Key Development of Friction Tape Market

  • Jul 24, 2025, In a display of artistic innovation and athletic homage, 3M unveiled "Shimmering Victory,” a captivating art installation honoring the 2024 3M Open Champion, Jhonattan Vegas.

Friction Tape Market Key Companies

  • Euro Tapes Pvt.Ltd.
  • Medi Spare
  • AVR INDUSTRIES PRIVATE LIMITED
  • Champion Tape
  • GOYAL ELECTRIC WORKS
  • 3M Company

Scope Of Report

Item Value
Quantitative Units USD 1.2 Billion
By Material Cotton Cloth, Rubber-resin Blend, and Non-woven Fabric
By Application Electrical Insulation, Grip Enhancement, Sports Equipment, and Tool Wrapping
By Adhesion Strength Low Tack, Medium Tack, and High Tack
By End-Use Industry Electrical, Automotive, Industrial Maintenance, and Sports
Key Companies Profiled Euro Tapes Pvt. Ltd., Medi Spare, AVR Industries Private Limited, Champion Tape, Goyal Electric Works, and 3M Company
Additional Attributes Increasing demand for high-tensile friction tapes in electrical insulation and automotive harness applications, growing use in sports equipment for improved grip performance, adoption in industrial maintenance for tool and machinery wrapping, rising preference for cotton cloth-based tapes for durability, development of rubber-resin blends with enhanced adhesion, expanding use in low-tack variants for temporary applications, regulatory focus on safety compliance in electrical repairs, high demand from emerging markets in Asia-Pacific, customization in colors and widths for sports and branding, and replacement-driven demand in mature industrial hubs of North America and Europe

Key Segments

By Material:

  • Cotton Cloth
  • Rubber-resin Blend
  • Non-woven Fabric

By Application:

  • Electrical Insulation
  • Grip Enhancement
  • Sports Equipment
  • Tool Wrapping

By Adhesion Strength:

  • Low Tack
  • Medium Tack
  • High Tack

By End-Use Industry:

  • Electrical
  • Automotive
  • Industrial Maintenance
  • Sports

By Region:

  • North America
  • Europe
  • Asia-Pacific
  • Latin America
  • Middle East & Africa

Table of Content

  1. Executive Summary
    • Global Market Outlook
    • Demand-side Trends
    • Supply-side Trends
    • Technology Roadmap Analysis
    • Analysis and Recommendations
  2. Market Overview
    • Market Coverage / Taxonomy
    • Market Definition / Scope / Limitations
  3. Market Background
    • Market Dynamics
      • Drivers
      • Restraints
      • Opportunity
      • Trends
    • Scenario Forecast
      • Demand in Optimistic Scenario
      • Demand in Likely Scenario
      • Demand in Conservative Scenario
    • Opportunity Map Analysis
    • Product Life Cycle Analysis
    • Supply Chain Analysis
      • Supply Side Participants and their Roles
        • Producers
        • Mid-Level Participants (Traders/ Agents/ Brokers)
        • Wholesalers and Distributors
      • Value Added and Value Created at Node in the Supply Chain
      • List of Raw Material Suppliers
      • List of Existing and Potential Buyer’s
    • Investment Feasibility Matrix
    • Value Chain Analysis
      • Profit Margin Analysis
      • Wholesalers and Distributors
      • Retailers
    • PESTLE and Porter’s Analysis
    • Regulatory Landscape
      • By Key Regions
      • By Key Countries
    • Regional Parent Market Outlook
    • Production and Consumption Statistics
    • Import and Export Statistics
  4. Global Market Analysis 2020 to 2024 and Forecast, 2025 to 2035
    • Historical Market Size Value (USD Million) & Volume (Units) Analysis, 2020 to 2024
    • Current and Future Market Size Value (USD Million) & Volume (Units) Projections, 2025 to 2035
      • Y-o-Y Growth Trend Analysis
      • Absolute $ Opportunity Analysis
  5. Global Market Pricing Analysis 2020 to 2024 and Forecast 2025 to 2035
  6. Global Market Analysis 2020 to 2024 and Forecast 2025 to 2035, By Material
    • Introduction / Key Findings
    • Historical Market Size Value (USD Million) & Volume (Units) Analysis By Material, 2020 to 2024
    • Current and Future Market Size Value (USD Million) & Volume (Units) Analysis and Forecast By Material, 2025 to 2035
      • Cotton Cloth
      • Rubber-resin Blend
      • Non-woven Fabric
    • Y-o-Y Growth Trend Analysis By Material, 2020 to 2024
    • Absolute $ Opportunity Analysis By Material, 2025 to 2035
  7. Global Market Analysis 2020 to 2024 and Forecast 2025 to 2035, By Application
    • Introduction / Key Findings
    • Historical Market Size Value (USD Million) & Volume (Units) Analysis By Application, 2020 to 2024
    • Current and Future Market Size Value (USD Million) & Volume (Units) Analysis and Forecast By Application, 2025 to 2035
      • Electrical Insulation
      • Grip Enhancement
      • Sports Equipment
      • Tool Wrapping
    • Y-o-Y Growth Trend Analysis By Application, 2020 to 2024
    • Absolute $ Opportunity Analysis By Application, 2025 to 2035
  8. Global Market Analysis 2020 to 2024 and Forecast 2025 to 2035, By Adhesion Strength
    • Introduction / Key Findings
    • Historical Market Size Value (USD Million) & Volume (Units) Analysis By Adhesion Strength, 2020 to 2024
    • Current and Future Market Size Value (USD Million) & Volume (Units) Analysis and Forecast By Adhesion Strength, 2025 to 2035
      • Low Tack
      • Medium Tack
      • High Tack
    • Y-o-Y Growth Trend Analysis By Adhesion Strength, 2020 to 2024
    • Absolute $ Opportunity Analysis By Adhesion Strength, 2025 to 2035
  9. Global Market Analysis 2020 to 2024 and Forecast 2025 to 2035, By End-Use Industry
    • Introduction / Key Findings
    • Historical Market Size Value (USD Million) & Volume (Units) Analysis By End-Use Industry, 2020 to 2024
    • Current and Future Market Size Value (USD Million) & Volume (Units) Analysis and Forecast By End-Use Industry, 2025 to 2035
      • Electrical
      • Automotive
      • Industrial Maintenance
      • Sports
    • Y-o-Y Growth Trend Analysis By End-Use Industry, 2020 to 2024
    • Absolute $ Opportunity Analysis By End-Use Industry, 2025 to 2035
  10. Global Market Analysis 2020 to 2024 and Forecast 2025 to 2035, By Region
    • Introduction
    • Historical Market Size Value (USD Million) & Volume (Units) Analysis By Region, 2020 to 2024
    • Current Market Size Value (USD Million) & Volume (Units) Analysis and Forecast By Region, 2025 to 2035
      • North America
      • Latin America
      • Europe
      • East Asia
      • South Asia
      • Oceania
      • MEA
    • Market Attractiveness Analysis By Region
  11. North America Market Analysis 2020 to 2024 and Forecast 2025 to 2035, By Country
    • Historical Market Size Value (USD Million) & Volume (Units) Trend Analysis By Market Taxonomy, 2020 to 2024
    • Market Size Value (USD Million) & Volume (Units) Forecast By Market Taxonomy, 2025 to 2035
      • By Country
        • USA
        • Canada
      • By Material
      • By Application
      • By Adhesion Strength
      • By End-Use Industry
    • Market Attractiveness Analysis
      • By Country
      • By Material
      • By Application
      • By Adhesion Strength
      • By End-Use Industry
    • Key Takeaways
  12. Latin America Market Analysis 2020 to 2024 and Forecast 2025 to 2035, By Country
    • Historical Market Size Value (USD Million) & Volume (Units) Trend Analysis By Market Taxonomy, 2020 to 2024
    • Market Size Value (USD Million) & Volume (Units) Forecast By Market Taxonomy, 2025 to 2035
      • By Country
        • Brazil
        • Mexico
        • Argentina
        • Chile
        • Peru
        • Rest of Latin America
      • By Material
      • By Application
      • By Adhesion Strength
      • By End-Use Industry
    • Market Attractiveness Analysis
      • By Country
      • By Material
      • By Application
      • By Adhesion Strength
      • By End-Use Industry
    • Key Takeaways
  13. Europe Market Analysis 2020 to 2024 and Forecast 2025 to 2035, By Country
    • Historical Market Size Value (USD Million) & Volume (Units) Trend Analysis By Market Taxonomy, 2020 to 2024
    • Market Size Value (USD Million) & Volume (Units) Forecast By Market Taxonomy, 2025 to 2035
      • By Country
        • Germany
        • Italy
        • France
        • UK
        • Spain
        • Russia
        • BENELUX
        • Rest of Europe
      • By Material
      • By Application
      • By Adhesion Strength
      • By End-Use Industry
    • Market Attractiveness Analysis
      • By Country
      • By Material
      • By Application
      • By Adhesion Strength
      • By End-Use Industry
    • Key Takeaways
  14. East Asia Market Analysis 2020 to 2024 and Forecast 2025 to 2035, By Country
    • Historical Market Size Value (USD Million) & Volume (Units) Trend Analysis By Market Taxonomy, 2020 to 2024
    • Market Size Value (USD Million) & Volume (Units) Forecast By Market Taxonomy, 2025 to 2035
      • By Country
        • China
        • Japan
        • South Korea
      • By Material
      • By Application
      • By Adhesion Strength
      • By End-Use Industry
    • Market Attractiveness Analysis
      • By Country
      • By Material
      • By Application
      • By Adhesion Strength
      • By End-Use Industry
    • Key Takeaways
  15. South Asia Market Analysis 2020 to 2024 and Forecast 2025 to 2035, By Country
    • Historical Market Size Value (USD Million) & Volume (Units) Trend Analysis By Market Taxonomy, 2020 to 2024
    • Market Size Value (USD Million) & Volume (Units) Forecast By Market Taxonomy, 2025 to 2035
      • By Country
        • India
        • Thailand
        • Malaysia
        • Indonesia
        • Rest of South Asia
      • By Material
      • By Application
      • By Adhesion Strength
      • By End-Use Industry
    • Market Attractiveness Analysis
      • By Country
      • By Material
      • By Application
      • By Adhesion Strength
      • By End-Use Industry
    • Key Takeaways
  16. Oceania Market Analysis 2020 to 2024 and Forecast 2025 to 2035, By Country
    • Historical Market Size Value (USD Million) & Volume (Units) Trend Analysis By Market Taxonomy, 2020 to 2024
    • Market Size Value (USD Million) & Volume (Units) Forecast By Market Taxonomy, 2025 to 2035
      • By Country
        • Australia
        • New Zealand
      • By Material
      • By Application
      • By Adhesion Strength
      • By End-Use Industry
    • Market Attractiveness Analysis
      • By Country
      • By Material
      • By Application
      • By Adhesion Strength
      • By End-Use Industry
    • Key Takeaways
  17. MEA Market Analysis 2020 to 2024 and Forecast 2025 to 2035, By Country
    • Historical Market Size Value (USD Million) & Volume (Units) Trend Analysis By Market Taxonomy, 2020 to 2024
    • Market Size Value (USD Million) & Volume (Units) Forecast By Market Taxonomy, 2025 to 2035
      • By Country
        • GCC
        • Rest of MEA
      • By Material
      • By Application
      • By Adhesion Strength
      • By End-Use Industry
    • Market Attractiveness Analysis
      • By Country
      • By Material
      • By Application
      • By Adhesion Strength
      • By End-Use Industry
    • Key Takeaways
  18. Key Countries Market Analysis
    • USA
      • Pricing Analysis
      • Market Share Analysis, 2024
        • By Material
        • By Application
        • By Adhesion Strength
        • By End-Use Industry
    • Canada
      • Pricing Analysis
      • Market Share Analysis, 2024
        • By Material
        • By Application
        • By Adhesion Strength
        • By End-Use Industry
    • Brazil
      • Pricing Analysis
      • Market Share Analysis, 2024
        • By Material
        • By Application
        • By Adhesion Strength
        • By End-Use Industry
    • Mexico
      • Pricing Analysis
      • Market Share Analysis, 2024
        • By Material
        • By Application
        • By Adhesion Strength
        • By End-Use Industry
    • Argentina
      • Pricing Analysis
      • Market Share Analysis, 2024
        • By Material
        • By Application
        • By Adhesion Strength
        • By End-Use Industry
  19. Market Structure Analysis
    • Competition Dashboard
    • Competition Benchmarking
    • Market Share Analysis of Top Players
      • By Regional
      • By Material
      • By Application
      • By Adhesion Strength
      • By End-Use Industry
  20. Competition Analysis
    • Competition Deep Dive
      • Euro Tapes Pvt.Ltd.
        • Overview
        • Product Portfolio
        • Profitability by Market Segments (Product/Age /Sales Channel/Region)
        • Sales Footprint
        • Strategy Overview
          • Marketing Strategy
          • Product Strategy
          • Channel Strategy
      • Medi Spare
        • Overview
        • Product Portfolio
        • Profitability by Market Segments (Product/Age /Sales Channel/Region)
        • Sales Footprint
        • Strategy Overview
          • Marketing Strategy
          • Product Strategy
          • Channel Strategy
      • AVR INDUSTRIES PRIVATE LIMITED
        • Overview
        • Product Portfolio
        • Profitability by Market Segments (Product/Age /Sales Channel/Region)
        • Sales Footprint
        • Strategy Overview
          • Marketing Strategy
          • Product Strategy
          • Channel Strategy
      • Champion Tape
        • Overview
        • Product Portfolio
        • Profitability by Market Segments (Product/Age /Sales Channel/Region)
        • Sales Footprint
        • Strategy Overview
          • Marketing Strategy
          • Product Strategy
          • Channel Strategy
      • GOYAL ELECTRIC WORKS
        • Overview
        • Product Portfolio
        • Profitability by Market Segments (Product/Age /Sales Channel/Region)
        • Sales Footprint
        • Strategy Overview
          • Marketing Strategy
          • Product Strategy
          • Channel Strategy
      • 3M Company
        • Overview
        • Product Portfolio
        • Profitability by Market Segments (Product/Age /Sales Channel/Region)
        • Sales Footprint
        • Strategy Overview
          • Marketing Strategy
          • Product Strategy
          • Channel Strategy
  21. Assumptions & Acronyms Used
  22. Research Methodology

List of Tables

  • Table 1: Global Market Value (USD Million) Forecast by Region, 2020-2035
  • Table 2: Global Market Volume (Units) Forecast by Region, 2020-2035
  • Table 3: Global Market Value (USD Million) Forecast By Material, 2020-2035
  • Table 4: Global Market Volume (Units) Forecast By Material, 2020-2035
  • Table 5: Global Market Value (USD Million) Forecast By Application, 2020-2035
  • Table 6: Global Market Volume (Units) Forecast By Application, 2020-2035
  • Table 7: Global Market Value (USD Million) Forecast By Adhesion Strength, 2020-2035
  • Table 8: Global Market Volume (Units) Forecast By Adhesion Strength, 2020-2035
  • Table 9: Global Market Value (USD Million) Forecast By End-Use Industry, 2020-2035
  • Table 10: Global Market Volume (Units) Forecast By End-Use Industry, 2020-2035
  • Table 11: North America Market Value (USD Million) Forecast by Country, 2020-2035
  • Table 12: North America Market Volume (Units) Forecast by Country, 2020-2035
  • Table 13: North America Market Value (USD Million) Forecast By Material, 2020-2035
  • Table 14: North America Market Volume (Units) Forecast By Material, 2020-2035
  • Table 15: North America Market Value (USD Million) Forecast By Application, 2020-2035
  • Table 16: North America Market Volume (Units) Forecast By Application, 2020-2035
  • Table 17: North America Market Value (USD Million) Forecast By Adhesion Strength, 2020-2035
  • Table 18: North America Market Volume (Units) Forecast By Adhesion Strength, 2020-2035
  • Table 19: North America Market Value (USD Million) Forecast By End-Use Industry, 2020-2035
  • Table 20: North America Market Volume (Units) Forecast By End-Use Industry, 2020-2035
  • Table 21: Latin America Market Value (USD Million) Forecast by Country, 2020-2035
  • Table 22: Latin America Market Volume (Units) Forecast by Country, 2020-2035
  • Table 23: Latin America Market Value (USD Million) Forecast By Material, 2020-2035
  • Table 24: Latin America Market Volume (Units) Forecast By Material, 2020-2035
  • Table 25: Latin America Market Value (USD Million) Forecast By Application, 2020-2035
  • Table 26: Latin America Market Volume (Units) Forecast By Application, 2020-2035
  • Table 27: Latin America Market Value (USD Million) Forecast By Adhesion Strength, 2020-2035
  • Table 28: Latin America Market Volume (Units) Forecast By Adhesion Strength, 2020-2035
  • Table 29: Latin America Market Value (USD Million) Forecast By End-Use Industry, 2020-2035
  • Table 30: Latin America Market Volume (Units) Forecast By End-Use Industry, 2020-2035
  • Table 31: Europe Market Value (USD Million) Forecast by Country, 2020-2035
  • Table 32: Europe Market Volume (Units) Forecast by Country, 2020-2035
  • Table 33: Europe Market Value (USD Million) Forecast By Material, 2020-2035
  • Table 34: Europe Market Volume (Units) Forecast By Material, 2020-2035
  • Table 35: Europe Market Value (USD Million) Forecast By Application, 2020-2035
  • Table 36: Europe Market Volume (Units) Forecast By Application, 2020-2035
  • Table 37: Europe Market Value (USD Million) Forecast By Adhesion Strength, 2020-2035
  • Table 38: Europe Market Volume (Units) Forecast By Adhesion Strength, 2020-2035
  • Table 39: Europe Market Value (USD Million) Forecast By End-Use Industry, 2020-2035
  • Table 40: Europe Market Volume (Units) Forecast By End-Use Industry, 2020-2035
  • Table 41: East Asia Market Value (USD Million) Forecast by Country, 2020-2035
  • Table 42: East Asia Market Volume (Units) Forecast by Country, 2020-2035
  • Table 43: East Asia Market Value (USD Million) Forecast By Material, 2020-2035
  • Table 44: East Asia Market Volume (Units) Forecast By Material, 2020-2035
  • Table 45: East Asia Market Value (USD Million) Forecast By Application, 2020-2035
  • Table 46: East Asia Market Volume (Units) Forecast By Application, 2020-2035
  • Table 47: East Asia Market Value (USD Million) Forecast By Adhesion Strength, 2020-2035
  • Table 48: East Asia Market Volume (Units) Forecast By Adhesion Strength, 2020-2035
  • Table 49: East Asia Market Value (USD Million) Forecast By End-Use Industry, 2020-2035
  • Table 50: East Asia Market Volume (Units) Forecast By End-Use Industry, 2020-2035
  • Table 51: South Asia Market Value (USD Million) Forecast by Country, 2020-2035
  • Table 52: South Asia Market Volume (Units) Forecast by Country, 2020-2035
  • Table 53: South Asia Market Value (USD Million) Forecast By Material, 2020-2035
  • Table 54: South Asia Market Volume (Units) Forecast By Material, 2020-2035
  • Table 55: South Asia Market Value (USD Million) Forecast By Application, 2020-2035
  • Table 56: South Asia Market Volume (Units) Forecast By Application, 2020-2035
  • Table 57: South Asia Market Value (USD Million) Forecast By Adhesion Strength, 2020-2035
  • Table 58: South Asia Market Volume (Units) Forecast By Adhesion Strength, 2020-2035
  • Table 59: South Asia Market Value (USD Million) Forecast By End-Use Industry, 2020-2035
  • Table 60: South Asia Market Volume (Units) Forecast By End-Use Industry, 2020-2035
  • Table 61: Oceania Market Value (USD Million) Forecast by Country, 2020-2035
  • Table 62: Oceania Market Volume (Units) Forecast by Country, 2020-2035
  • Table 63: Oceania Market Value (USD Million) Forecast By Material, 2020-2035
  • Table 64: Oceania Market Volume (Units) Forecast By Material, 2020-2035
  • Table 65: Oceania Market Value (USD Million) Forecast By Application, 2020-2035
  • Table 66: Oceania Market Volume (Units) Forecast By Application, 2020-2035
  • Table 67: Oceania Market Value (USD Million) Forecast By Adhesion Strength, 2020-2035
  • Table 68: Oceania Market Volume (Units) Forecast By Adhesion Strength, 2020-2035
  • Table 69: Oceania Market Value (USD Million) Forecast By End-Use Industry, 2020-2035
  • Table 70: Oceania Market Volume (Units) Forecast By End-Use Industry, 2020-2035
  • Table 71: MEA Market Value (USD Million) Forecast by Country, 2020-2035
  • Table 72: MEA Market Volume (Units) Forecast by Country, 2020-2035
  • Table 73: MEA Market Value (USD Million) Forecast By Material, 2020-2035
  • Table 74: MEA Market Volume (Units) Forecast By Material, 2020-2035
  • Table 75: MEA Market Value (USD Million) Forecast By Application, 2020-2035
  • Table 76: MEA Market Volume (Units) Forecast By Application, 2020-2035
  • Table 77: MEA Market Value (USD Million) Forecast By Adhesion Strength, 2020-2035
  • Table 78: MEA Market Volume (Units) Forecast By Adhesion Strength, 2020-2035
  • Table 79: MEA Market Value (USD Million) Forecast By End-Use Industry, 2020-2035
  • Table 80: MEA Market Volume (Units) Forecast By End-Use Industry, 2020-2035

List of Figures

  • Figure 1: Global Market Volume (Units) Forecast 2020-2035
  • Figure 2: Global Market Pricing Analysis
  • Figure 3: Global Market Value (USD Million) Forecast 2020-2035
  • Figure 4: Global Market Value Share and BPS Analysis By Material, 2025 and 2035
  • Figure 5: Global Market Y-o-Y Growth Comparison By Material, 2025-2035
  • Figure 6: Global Market Attractiveness Analysis By Material
  • Figure 7: Global Market Value Share and BPS Analysis By Application, 2025 and 2035
  • Figure 8: Global Market Y-o-Y Growth Comparison By Application, 2025-2035
  • Figure 9: Global Market Attractiveness Analysis By Application
  • Figure 10: Global Market Value Share and BPS Analysis By Adhesion Strength, 2025 and 2035
  • Figure 11: Global Market Y-o-Y Growth Comparison By Adhesion Strength, 2025-2035
  • Figure 12: Global Market Attractiveness Analysis By Adhesion Strength
  • Figure 13: Global Market Value Share and BPS Analysis By End-Use Industry, 2025 and 2035
  • Figure 14: Global Market Y-o-Y Growth Comparison By End-Use Industry, 2025-2035
  • Figure 15: Global Market Attractiveness Analysis By End-Use Industry
  • Figure 16: Global Market Value (USD Million) Share and BPS Analysis by Region, 2025 and 2035
  • Figure 17: Global Market Y-o-Y Growth Comparison by Region, 2025-2035
  • Figure 18: Global Market Attractiveness Analysis by Region
  • Figure 19: North America Market Incremental $ Opportunity, 2025-2035
  • Figure 20: Latin America Market Incremental $ Opportunity, 2025-2035
  • Figure 21: Europe Market Incremental $ Opportunity, 2025-2035
  • Figure 22: East Asia Market Incremental $ Opportunity, 2025-2035
  • Figure 23: South Asia Market Incremental $ Opportunity, 2025-2035
  • Figure 24: Oceania Market Incremental $ Opportunity, 2025-2035
  • Figure 25: MEA Market Incremental $ Opportunity, 2025-2035
  • Figure 26: North America Market Value Share and BPS Analysis by Country, 2025 and 2035
  • Figure 27: North America Market Value Share and BPS Analysis By Material, 2025 and 2035
  • Figure 28: North America Market Y-o-Y Growth Comparison By Material, 2025-2035
  • Figure 29: North America Market Attractiveness Analysis By Material
  • Figure 30: North America Market Value Share and BPS Analysis By Application, 2025 and 2035
  • Figure 31: North America Market Y-o-Y Growth Comparison By Application, 2025-2035
  • Figure 32: North America Market Attractiveness Analysis By Application
  • Figure 33: North America Market Value Share and BPS Analysis By Adhesion Strength, 2025 and 2035
  • Figure 34: North America Market Y-o-Y Growth Comparison By Adhesion Strength, 2025-2035
  • Figure 35: North America Market Attractiveness Analysis By Adhesion Strength
  • Figure 36: North America Market Value Share and BPS Analysis By End-Use Industry, 2025 and 2035
  • Figure 37: North America Market Y-o-Y Growth Comparison By End-Use Industry, 2025-2035
  • Figure 38: North America Market Attractiveness Analysis By End-Use Industry
  • Figure 39: Latin America Market Value Share and BPS Analysis by Country, 2025 and 2035
  • Figure 40: Latin America Market Value Share and BPS Analysis By Material, 2025 and 2035
  • Figure 41: Latin America Market Y-o-Y Growth Comparison By Material, 2025-2035
  • Figure 42: Latin America Market Attractiveness Analysis By Material
  • Figure 43: Latin America Market Value Share and BPS Analysis By Application, 2025 and 2035
  • Figure 44: Latin America Market Y-o-Y Growth Comparison By Application, 2025-2035
  • Figure 45: Latin America Market Attractiveness Analysis By Application
  • Figure 46: Latin America Market Value Share and BPS Analysis By Adhesion Strength, 2025 and 2035
  • Figure 47: Latin America Market Y-o-Y Growth Comparison By Adhesion Strength, 2025-2035
  • Figure 48: Latin America Market Attractiveness Analysis By Adhesion Strength
  • Figure 49: Latin America Market Value Share and BPS Analysis By End-Use Industry, 2025 and 2035
  • Figure 50: Latin America Market Y-o-Y Growth Comparison By End-Use Industry, 2025-2035
  • Figure 51: Latin America Market Attractiveness Analysis By End-Use Industry
  • Figure 52: Europe Market Value Share and BPS Analysis by Country, 2025 and 2035
  • Figure 53: Europe Market Value Share and BPS Analysis By Material, 2025 and 2035
  • Figure 54: Europe Market Y-o-Y Growth Comparison By Material, 2025-2035
  • Figure 55: Europe Market Attractiveness Analysis By Material
  • Figure 56: Europe Market Value Share and BPS Analysis By Application, 2025 and 2035
  • Figure 57: Europe Market Y-o-Y Growth Comparison By Application, 2025-2035
  • Figure 58: Europe Market Attractiveness Analysis By Application
  • Figure 59: Europe Market Value Share and BPS Analysis By Adhesion Strength, 2025 and 2035
  • Figure 60: Europe Market Y-o-Y Growth Comparison By Adhesion Strength, 2025-2035
  • Figure 61: Europe Market Attractiveness Analysis By Adhesion Strength
  • Figure 62: Europe Market Value Share and BPS Analysis By End-Use Industry, 2025 and 2035
  • Figure 63: Europe Market Y-o-Y Growth Comparison By End-Use Industry, 2025-2035
  • Figure 64: Europe Market Attractiveness Analysis By End-Use Industry
  • Figure 65: East Asia Market Value Share and BPS Analysis by Country, 2025 and 2035
  • Figure 66: East Asia Market Value Share and BPS Analysis By Material, 2025 and 2035
  • Figure 67: East Asia Market Y-o-Y Growth Comparison By Material, 2025-2035
  • Figure 68: East Asia Market Attractiveness Analysis By Material
  • Figure 69: East Asia Market Value Share and BPS Analysis By Application, 2025 and 2035
  • Figure 70: East Asia Market Y-o-Y Growth Comparison By Application, 2025-2035
  • Figure 71: East Asia Market Attractiveness Analysis By Application
  • Figure 72: East Asia Market Value Share and BPS Analysis By Adhesion Strength, 2025 and 2035
  • Figure 73: East Asia Market Y-o-Y Growth Comparison By Adhesion Strength, 2025-2035
  • Figure 74: East Asia Market Attractiveness Analysis By Adhesion Strength
  • Figure 75: East Asia Market Value Share and BPS Analysis By End-Use Industry, 2025 and 2035
  • Figure 76: East Asia Market Y-o-Y Growth Comparison By End-Use Industry, 2025-2035
  • Figure 77: East Asia Market Attractiveness Analysis By End-Use Industry
  • Figure 78: South Asia Market Value Share and BPS Analysis by Country, 2025 and 2035
  • Figure 79: South Asia Market Value Share and BPS Analysis By Material, 2025 and 2035
  • Figure 80: South Asia Market Y-o-Y Growth Comparison By Material, 2025-2035
  • Figure 81: South Asia Market Attractiveness Analysis By Material
  • Figure 82: South Asia Market Value Share and BPS Analysis By Application, 2025 and 2035
  • Figure 83: South Asia Market Y-o-Y Growth Comparison By Application, 2025-2035
  • Figure 84: South Asia Market Attractiveness Analysis By Application
  • Figure 85: South Asia Market Value Share and BPS Analysis By Adhesion Strength, 2025 and 2035
  • Figure 86: South Asia Market Y-o-Y Growth Comparison By Adhesion Strength, 2025-2035
  • Figure 87: South Asia Market Attractiveness Analysis By Adhesion Strength
  • Figure 88: South Asia Market Value Share and BPS Analysis By End-Use Industry, 2025 and 2035
  • Figure 89: South Asia Market Y-o-Y Growth Comparison By End-Use Industry, 2025-2035
  • Figure 90: South Asia Market Attractiveness Analysis By End-Use Industry
  • Figure 91: Oceania Market Value Share and BPS Analysis by Country, 2025 and 2035
  • Figure 92: Oceania Market Value Share and BPS Analysis By Material, 2025 and 2035
  • Figure 93: Oceania Market Y-o-Y Growth Comparison By Material, 2025-2035
  • Figure 94: Oceania Market Attractiveness Analysis By Material
  • Figure 95: Oceania Market Value Share and BPS Analysis By Application, 2025 and 2035
  • Figure 96: Oceania Market Y-o-Y Growth Comparison By Application, 2025-2035
  • Figure 97: Oceania Market Attractiveness Analysis By Application
  • Figure 98: Oceania Market Value Share and BPS Analysis By Adhesion Strength, 2025 and 2035
  • Figure 99: Oceania Market Y-o-Y Growth Comparison By Adhesion Strength, 2025-2035
  • Figure 100: Oceania Market Attractiveness Analysis By Adhesion Strength
  • Figure 101: Oceania Market Value Share and BPS Analysis By End-Use Industry, 2025 and 2035
  • Figure 102: Oceania Market Y-o-Y Growth Comparison By End-Use Industry, 2025-2035
  • Figure 103: Oceania Market Attractiveness Analysis By End-Use Industry
  • Figure 104: MEA Market Value Share and BPS Analysis by Country, 2025 and 2035
  • Figure 105: MEA Market Value Share and BPS Analysis By Material, 2025 and 2035
  • Figure 106: MEA Market Y-o-Y Growth Comparison By Material, 2025-2035
  • Figure 107: MEA Market Attractiveness Analysis By Material
  • Figure 108: MEA Market Value Share and BPS Analysis By Application, 2025 and 2035
  • Figure 109: MEA Market Y-o-Y Growth Comparison By Application, 2025-2035
  • Figure 110: MEA Market Attractiveness Analysis By Application
  • Figure 111: MEA Market Value Share and BPS Analysis By Adhesion Strength, 2025 and 2035
  • Figure 112: MEA Market Y-o-Y Growth Comparison By Adhesion Strength, 2025-2035
  • Figure 113: MEA Market Attractiveness Analysis By Adhesion Strength
  • Figure 114: MEA Market Value Share and BPS Analysis By End-Use Industry, 2025 and 2035
  • Figure 115: MEA Market Y-o-Y Growth Comparison By End-Use Industry, 2025-2035
  • Figure 116: MEA Market Attractiveness Analysis By End-Use Industry
  • Figure 117: Global Market - Tier Structure Analysis
  • Figure 118: Global Market - Company Share Analysis

Frequently Asked Questions

How big is the friction tape market in 2025?

The global friction tape market is estimated to be valued at USD 1.2 billion in 2025.

What will be the size of the friction tape market in 2035?

The market size for the friction tape market is projected to reach USD 1.7 billion by 2035.

How much will be the friction tape market growth between 2025 and 2035?

The friction tape market is expected to grow at a CAGR of 4.1% between 2025 and 2035.

What are the key material segments in the friction tape market?

The key material segments in the friction tape market include cotton cloth, fiberglass, and synthetic fabric.

Which material segment is expected to contribute significant share in the friction tape market in 2025?

In terms of material, the cotton cloth segment is expected to account for the highest share of 47.8% in the friction tape market in 2025.

Explore Similar Insights

Future Market Insights

Friction Tape Market