Methodology

Game IP Licensed Peripherals Market Forecast and Outlook 2025 to 2035

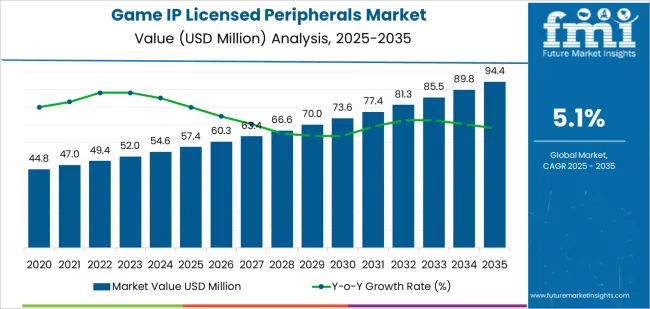
The global game IP licensed peripherals market is valued at USD 57.4 million in 2025 and is projected to reach USD 94.3 million by 2035, reflecting a CAGR of 5.1%. A breakpoint analysis reveals that the market enters a period of more rapid growth between 2025 and 2030, driven by increased consumer demand for officially licensed gaming peripherals tied to popular game franchises. This period is marked by higher-than-average growth rates as gamers seek to enhance their experience with branded controllers, headsets, and other in-game accessories. The release of new game titles and the expansion of online gaming communities further accelerate the market’s momentum during this phase.

After 2030, the market experiences a moderation phase where growth begins to slow slightly, reflecting the saturation of game peripherals tied to the most prominent franchises. While licensing deals continue to generate steady demand, new IP-driven product launches tend to be more cyclical, occurring in alignment with new game releases and special events. This shift from rapid adoption to steady demand causes the market to experience periodic growth surges linked to major game releases or new technology introductions. Despite this moderation, the ongoing interest in high-quality, immersive gaming peripherals ensures that the market maintains a positive, though slower, growth trajectory.
Quick Stats for Game IP Licensed Peripherals Market

  • Game IP Licensed Peripherals Market Value (2025): USD 57.4 million
  • Game IP Licensed Peripherals Market Forecast Value (2035): USD 94.3 million
  • Game IP Licensed Peripherals Market Forecast CAGR: 5.1%
  • Leading Product Category in Game IP Licensed Peripherals Market: Toys (33.0%)
  • Key Growth Regions in Game IP Licensed Peripherals Market: East Asia, North America, Europe
  • Top Players in Game IP Licensed Peripherals Market: Tencent, Microsoft, Nintendo, SONY, NetEase, Disney, Nexon, Ubisoft, miHoYo, Square Enix, Razer, Logitech G, Fangamer, McFarlane Toys

Game Ip Licensed Peripherals Market Market Value Analysis

What is the Growth Forecast for the Game IP Licensed Peripherals Market through 2035?

Between 2025 and 2030, the Game IP Licensed Peripherals Market expands from USD 57.4 million to USD 73.6 million, generating a compound absolute gain of USD 16.2 million. Annual additions increase progressively from USD 2.6 million in 2025–2026 to USD 3.6 million in 2029–2030 indicating a steady compounding pattern. This acceleration is supported by rising global demand for IP-branded controllers, keyboards, headsets, and collectible gaming accessories. Franchise-based merchandising, boosted by new game launches and esports-driven visibility, strengthens year-over-year uplifts. The compounding trend also reflects improved licensing penetration across online marketplaces and retail chains that scale distribution of themed peripherals.

From 2030 to 2035, the market advances from USD 73.6 million to USD 94.3 million, producing a compound absolute gain of USD 20.7 million, surpassing the earlier period. Annual increases grow to the USD 3.7–4.5 million range as publishers expand cross-media IP ecosystems and limited-edition peripherals become more commercially impactful. Broader global participation in gaming communities and higher collector demand amplify cumulative growth. Over the decade, total compounded absolute expansion reaches USD 36.9 million, demonstrating a consistent upward trajectory fueled by the maturing monetization structure of game-licensed peripheral categories.

Game IP Licensed Peripherals Market Key Takeaways

Metric Value
Market Value (2025) USD 57.4 million
Market Forecast Value (2035) USD 94.3 million
Forecast CAGR (2025–2035) 5.1%

Why Is the Game IP Licensed Peripherals Market Growing Across Global Consumer and Gaming Ecosystems?

Demand for game IP licensed peripherals is rising as publishers, hardware makers, and merchandise partners capitalize on strong fan engagement across console, PC, and mobile franchises. Licensed peripherals including controllers, headsets, keyboards, mice, themed cases, figures, and décor extend the value of game worlds beyond digital play. Publishers coordinate licensing programs to capture demand tied to new releases, esports events, and long-running live-service titles with durable fan bases. Manufacturers refine sculpting, color-matching, and branding workflows to ensure visual accuracy and compliance with IP guidelines. As global streaming exposure introduces franchises to wider audiences, licensed peripherals gain traction in regions where physical merchandise previously had limited distribution. Expanding retail partnerships and direct-to-consumer channels further strengthen commercial viability.

Market expansion is also driven by collector culture, limited-edition drops, and premium peripherals targeted at competitive players seeking both performance and franchise affinity. Hardware makers integrate game-specific lighting profiles, haptic feedback cues, and branded UI elements to enhance user immersion. Logistics improvements support coordinated global launches, reducing stockouts during peak release cycles. Rights holders invest in anti-counterfeiting measures and supply-chain audits as unauthorized replicas remain a persistent risk. Although licensing costs and production lead times can constrain smaller brands, continued growth in esports, cross-media adaptations, and community-driven marketing reinforces long-term demand for game IP licensed peripherals across retail, specialty merchandise, and online marketplaces.

How Do Product Categories and Sales Channels Shape Segmentation in the Game IP Licensed Peripherals Market?

The game IP licensed peripherals market is segmented by type, application, and region. By type, the market includes toys, clothing accessories, PC game peripherals, books and posters, and others. Based on application, it is categorized into online, retail, and specialty stores. Regionally, the market is segmented into North America, Europe, East Asia, South Asia, Latin America, and the Middle East & Africa. These segments reflect different consumer preferences, gaming culture, and regional retail dynamics that drive the demand for licensed game merchandise.
What Factors Support the Leading Position of Toys in Game IP Licensed Peripherals?

Game Ip Licensed Peripherals Market Analysis By Type

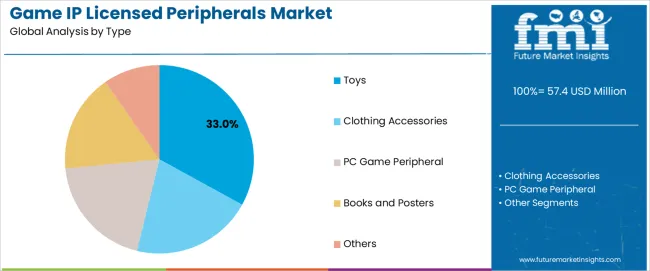
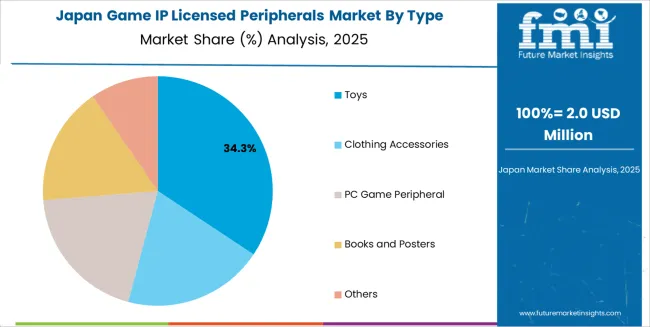
The toys segment accounts for approximately 33.0% of the global game IP licensed peripherals market in 2025, making it the leading type category. This position is driven by the strong, established connection between video games and character-based toy merchandising. Popular game franchises often extend their intellectual property into action figures, plush toys, model kits, and collectible items, which appeal to both younger audiences and collectors. The demand for game-related toys is fueled by franchises with strong fan bases that actively seek physical representations of in-game characters or items.

Manufacturers produce a wide range of toys that align with gaming franchises, ensuring availability through both mass-market retailers and specialized outlets. Adoption is particularly strong in North America and East Asia, where major game titles generate high levels of fan engagement and merchandise sales. The segment maintains its lead because toys offer an accessible way for consumers to interact with their favorite games beyond the screen, providing long-lasting appeal and the ability to generate ongoing sales through multiple game releases or franchise spin-offs.
Why Does Online Sales Represent the Largest Application Share in This Market?

Game Ip Licensed Peripherals Market Analysis By Application

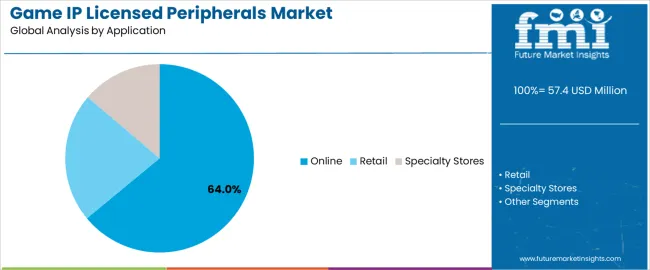
The online segment represents about 64.0% of the total game IP licensed peripherals market in 2025, making it the dominant application category. This position is primarily due to the growing consumer preference for online shopping, where gamers can easily access a broad range of licensed peripherals that might not be available in local retail stores. Online platforms enable fans to purchase limited-edition items, exclusive merchandise, and new releases quickly, often coordinating these purchases with the launch of new games or expansions.

Adoption is particularly strong in North America, Europe, and East Asia, where e-commerce infrastructure supports the high demand for gaming peripherals. Online sales also provide access to global markets, offering consumers from regions without large physical retail networks the opportunity to buy game-related products. Additionally, the online model allows for targeted marketing and promotions tied to game releases or specific gaming events, enhancing product visibility. The online category retains its leading position because it offers consumers convenience, wider selection, and timely availability that align with the frequent product releases in the gaming industry.

What are the Key Trends, Drivers, and Restraints in the Game IP Licensed Peripherals Market?

The game IP licensed peripherals market is expanding as video game franchises leverage their intellectual properties (IP) to extend brand reach into physical products such as accessories, collectibles and themed hardware. These peripherals ranging from branded headsets, controllers, figurines and lifestyle merchandise allow publishers and license holders to monetise dedicated fan bases beyond game software. Growth is supported by increasing consumer interest in gaming culture, esports, content creator tie ins and global rollout of popular titles. However, adoption is moderated by licensing complexity, saturation risk and manufacturing/logistics issues. Peripheral makers are focusing on high quality materials, limited edition drops and region specific licensing strategies to appeal to gamer audiences.

How is growth of gaming culture and IP driven fandom boosting demand for licensed peripherals?

Demand is driven by the rise of gaming as a mainstream entertainment medium and the increasing value of game IPs beyond the software itself. Fans often seek merchandise and hardware bearing their favourite titles, characters or esports teams, which creates strong pull for licensed peripherals. Peripherals linked to major launches, streamer collaborations or esports events amplify this effect, turning limited editions and collector type items into high visibility offerings. As games release globally and fandoms diversify, peripheral makers that can secure official licensing and deliver items attuned to game aesthetics capture incremental revenue.

What factors are restraining expansion of the game IP licensed peripherals segment?

Several factors limit rapid growth. Licensing costs and royalty structures may reduce margins for manufacturers, particularly when working with high value IPs. Production of peripherals tied to a specific game may require timely coordination with game release schedules—mistiming can reduce relevance. Quality concerns (e.g., product durability, compatibility) or over saturation of branded items may erode brand value. Regulatory and import/export complexities in some regions also challenge global distribution. Taken together, these constraints mean that only well licensed, high quality peripheral offerings are likely to succeed in competitive markets.

What trends are shaping the evolution of licensed game IP peripherals?

Key trends include limited edition drops linked to major game launches or events, increased collaboration between peripheral brands and game developers for co designed accessories, and growth of lifestyle oriented gaming hardware (e.g., fashion forward headsets, themed controllers). Digital integration is also rising: peripherals now include companion apps, RGB lighting tied to in game events and collector numbering for added appeal. Regional localization such as region specific aesthetics, characters or packaging helps reach diverse markets. As the gaming ecosystem grows, peripheral makers are shifting toward omni channel distribution, direct to consumer models and influencer driven launches to heighten engagement and exclusivity.
What is the Analysis of the Game IP Licensed Peripherals Market by Key Country?

Game Ip Licensed Peripherals Market Cagr Analysis By Country

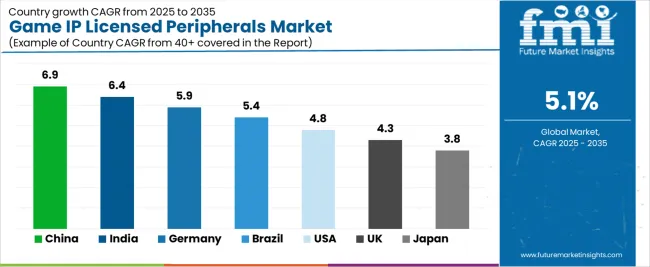
Country CAGR (%)
China 6.9%
India 6.4%
Germany 5.9%
Brazil 5.4%
USA 4.8%
UK 4.3%
Japan 3.8%

The Game IP Licensed Peripherals Market is growing steadily across global regions, with China leading at a 6.9% CAGR through 2035, driven by an expansive gaming ecosystem, increasing eSports popularity, and strong demand for licensed peripherals among gaming communities. India follows at 6.4%, supported by a growing gaming population, increased digital gaming adoption, and expanding eCommerce platforms for game-related products. Germany records 5.9%, reflecting a strong gaming culture, high-quality product manufacturing, and robust licensing agreements between developers and peripheral makers. Brazil grows at 5.4%, benefiting from a growing gaming audience, improved internet access, and increased demand for affordable, quality peripherals. The USA, at 4.8%, remains a mature market emphasizing high-end, immersive gaming peripherals and exclusive IP collaborations, while the UK (4.3%) and Japan (3.8%) focus on collector’s editions, advanced tech peripherals, and localized IP partnerships.

How Is Gaming Expansion Driving Peripheral Demand in China?

China is projected to grow at a CAGR of 6.9% through 2035 in the game IP licensed peripherals market. Rapid growth in gaming, esports, and live-streaming platforms boosts demand for specialized peripherals. Manufacturers supply high-performance controllers, custom keypads, and headsets licensed to popular game franchises. Retailers focus on offering bundled hardware packages featuring exclusive game content. Service providers support product localisation, custom branding, and regional licensing agreements for global and domestic releases. The market benefits from gaming hardware collaborations, exclusive content partnerships, and increasing mobile gaming in urban centres.

  • High-performance controllers support competitive gaming across multiple genres.
  • Custom keypads and headsets enhance player immersion and ergonomic comfort.
  • Regional licensing agreements increase availability of exclusive gaming peripherals.
  • Bundled packages drive cross-marketing and consumer interest across platforms.

Why Is Mobile Gaming Growth Supporting India’s Market?

India is projected to grow at a CAGR of 6.4% through 2035 in the game IP licensed peripherals market. Rapid mobile gaming adoption and growing esports participation drive demand for licensed peripherals that enhance gameplay. Manufacturers provide gaming-focused smartphones, Bluetooth controllers, and wireless headsets designed for mobile games. Retailers support bundled offers, pairing peripherals with gaming apps, exclusive game skins, or downloadable content. The market grows as regional developers collaborate with peripheral makers to create country-specific versions of popular gaming franchises. Online gaming tournaments further fuel the need for performance-enhancing equipment across mobile and console platforms.
  • Bluetooth controllers enable wireless, seamless gameplay across mobile devices.
  • Wireless headsets improve immersion and communication in multiplayer games.
  • Bundled offers include exclusive content to attract mobile gamers.
  • Regional developer collaborations expand availability of localised peripherals.

How Are High-Tech Standards Influencing Germany's Market?

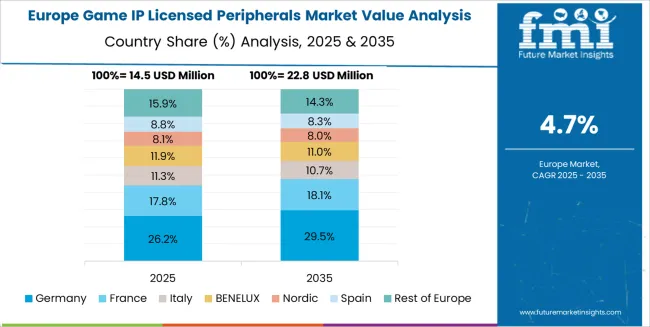
Game Ip Licensed Peripherals Market Europe Country Market Share Analysis, 2025 & 2035

Germany is projected to grow at a CAGR of 5.9% through 2035 in the game IP licensed peripherals market. Demand for high-end gaming systems and peripherals for esports, VR, and AR applications is increasing. Manufacturers provide licensed, premium controllers, gaming chairs, and VR-compatible devices, ensuring compatibility with industry-leading gaming titles. Retailers emphasise ergonomic, high-durability designs for extended play sessions, often offering customizations for gaming setups. The market is bolstered by licensing agreements between peripheral manufacturers and game developers, creating exclusive products tied to popular franchises. Growth also aligns with the rise of gaming conventions and global esports events in Europe.

  • Premium controllers enhance competitive gaming experience with ergonomic designs.
  • VR-compatible peripherals support immersive, cutting-edge gaming technology.
  • Customization options improve user comfort and game setup flexibility.
  • Licensing agreements drive demand for exclusive franchise-themed peripherals.

Why Are Regional Retail Strategies Supporting Brazil’s Market?

Brazil is projected to grow at a CAGR of 5.4% through 2035 in the game IP licensed peripherals market. Increasing consumer interest in gaming and esports propels demand for peripherals linked to popular games and franchises. Local retailers offer exclusive peripherals tailored to Brazilian players, often bundling them with gaming systems and exclusive in-game content. Manufacturers focus on producing durable, cost-effective products suitable for regional climate conditions. Esports tournaments and online gaming communities also drive peripheral sales, as players seek performance-enhancing equipment and exclusive gaming experiences linked to tournaments and brand partnerships.
  • Exclusive peripherals are bundled with popular games to attract players.
  • Cost-effective products provide access to high-quality gaming gear for all levels.
  • Bundled offers attract consumers seeking exclusive in-game content.
  • Esports tournament growth drives demand for performance-enhancing equipment.

How Is Console Gaming Supporting Peripheral Demand in the USA?

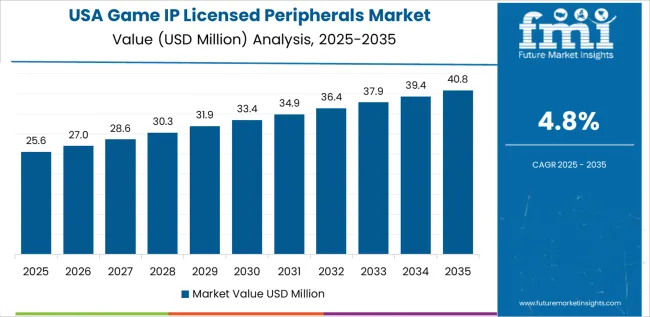
Game Ip Licensed Peripherals Market Country Value Analysis

USA is projected to grow at a CAGR of 4.8% through 2035 in the game IP licensed peripherals market. Console gaming continues to drive the demand for high-quality, licensed peripherals such as controllers, headsets, and custom-designed accessories. Manufacturers focus on ergonomic, long-lasting equipment designed for competitive gamers and streamers. Retailers bundle gaming peripherals with exclusive game releases, offering loyalty rewards to drive sales. The rise of cloud gaming and the adoption of next-gen consoles further fuels demand for performance-enhancing accessories. The market benefits from ongoing partnerships between developers and peripheral manufacturers for exclusive product releases.

  • High-quality controllers enhance console gaming performance and user comfort.
  • Custom accessories cater to competitive gamers and streamers.
  • Cloud gaming adoption increases demand for portable, versatile peripherals.
  • Game developers partner with manufacturers for exclusive product releases.

Why Are Digital Content Platforms Supporting the UK Market?

UK is projected to grow at a CAGR of 4.3% through 2035 in the game IP licensed peripherals market. The expansion of digital content platforms, such as streaming services, and the rise of esports increase demand for licensed peripherals that cater to gamers' needs. Manufacturers provide controllers, gaming mice, and headsets tailored to competitive gaming and live streaming. Retailers highlight bundles offering exclusive game-related content, offering added value to players. The market benefits from sponsorships and partnerships between major gaming brands, peripheral manufacturers, and esports leagues, driving product exclusivity and performance upgrades across regional markets.
  • Gaming mice and controllers enhance gameplay precision in competitive settings.
  • Streaming-specific peripherals cater to rising demand for live gaming broadcasts.
  • Exclusive game content bundled with peripherals increases player engagement.
  • Partnerships with esports leagues drive demand for professional-grade equipment.

How Are Esports and VR Driving Demand in Japan?

Game Ip Licensed Peripherals Market Japan Market Share Analysis By Type

Japan is projected to grow at a CAGR of 3.8% through 2035 in the game IP licensed peripherals market. Esports tournaments, VR gaming, and the increasing popularity of mobile gaming drive demand for specialized peripherals that provide high-level performance. Manufacturers provide VR-compatible controllers, immersive headsets, and haptic feedback devices designed for gaming and simulation experiences. Retailers focus on offering ergonomic, high-durability gaming products suited to long play sessions. Regional game developers create exclusive products, bundling peripherals with popular titles, which stimulates consumer interest. Growth is further driven by Japan’s leading role in esports and mobile gaming sectors.
  • VR-compatible controllers support immersive gaming and simulation experiences.
  • Haptic feedback devices enhance user interaction in virtual environments.
  • Esports tournaments drive demand for professional-grade gaming peripherals.
  • Exclusive product bundles create consumer engagement with new game releases.

How Competitive Is the Global Game IP Licensed Peripherals Market and What Defines Its Strategic Landscape?

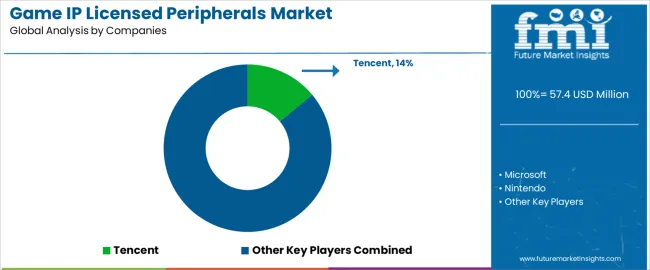
Game Ip Licensed Peripherals Market Analysis By Company

The global game IP licensed peripherals market is highly competitive, shaped by leading gaming, hardware, and entertainment companies that integrate popular game franchises into a wide range of consumer products. Tencent, Microsoft, Nintendo, and SONY dominate the market by offering branded peripherals such as custom controllers, headsets, and gaming accessories that enhance the gaming experience for their respective fanbases. These companies leverage their game IPs to produce exclusive, high-demand merchandise tied to franchises like League of Legends, Xbox, PlayStation exclusives, and Nintendo’s iconic series, creating strong brand loyalty and high-profit potential. NetEase and Disney also contribute to the market, expanding their product lines by licensing popular gaming IPs to create specialized peripherals and interactive toys for a global audience.

Nexon, Ubisoft, miHoYo, and Square Enix further fuel the market with licensed peripherals related to hit franchises like Overwatch, Genshin Impact, and Final Fantasy, integrating character-driven designs into products such as gaming chairs, keyboards, and figurines. Razer and Logitech G lead the specialized gaming peripherals sector, providing high-performance accessories like gaming mice, headsets, and keypads that are co-branded with gaming IPs, ensuring enhanced gaming experiences. Fangamer and McFarlane Toys expand the market through niche collectible peripherals like action figures and art prints, targeting dedicated fanbases. Competition is driven by the popularity of licensed IPs, product performance, and unique designs, with strategic differentiation relying on exclusive collaborations, limited-edition releases, and seamless integration between game titles and peripheral products.

Key Players in the Game IP Licensed Peripherals Market

  • Tencent
  • Microsoft
  • Nintendo
  • SONY
  • NetEase
  • Disney
  • Nexon
  • Ubisoft
  • miHoYo
  • Square Enix
  • Razer
  • Logitech G
  • Fangamer
  • McFarlane Toys

Report Scope for Game IP Licensed Peripherals Market

Items Values
Quantitative Units (2025) USD million
Type Toys, Clothing Accessories, PC Game Peripherals, Books and Posters, Others
Application Online, Retail, Specialty Stores
Regions Covered East Asia, Europe, North America, South Asia, Latin America, Middle East & Africa
Countries Covered China, India, Germany, Brazil, USA, UK, Japan, and 40+ additional countries
Key Companies Profiled Tencent, Microsoft, Nintendo, SONY, NetEase, Disney, Nexon, Ubisoft, miHoYo, Square Enix, Razer, Logitech G, Fangamer, McFarlane Toys
Additional Attributes Dollar sales by type and application categories, regional adoption trends, licensing agreements, competitive landscape with gaming companies and peripheral makers, high-tech standards, and premium product adoption, fan culture, licensing cycles and localization trends.

Game IP Licensed Peripherals Market Segmentation

Type:

  • Toys
  • Clothing Accessories
  • PC Game Peripheral
  • Books and Posters
  • Others

Application:

  • Online
  • Retail
  • Specialty Stores

Region:

  • East Asia
    • China
    • Japan
    • South Korea
    • Taiwan
    • Rest of East Asia
  • Europe
    • Germany
    • UK
    • France
    • Italy
    • Spain
    • Switzerland
    • Nordic
    • BENELUX
    • Rest of Europe
  • North America
    • USA
    • Canada
    • Mexico
  • South Asia
    • India
    • Pakistan
    • Bangladesh
    • Rest of South Asia
  • Latin America
    • Brazil
    • Argentina
    • Chile
    • Rest of Latin America
  • Middle East & Africa
    • Kingdom of Saudi Arabia
    • Other GCC Countries
    • Turkey
    • South Africa
    • Other African Union
    • Rest of Middle East & Africa
  • Eastern Europe
    • Russia
    • Poland
    • Czech Republic
    • Rest of Eastern Europe

Frequently Asked Questions

How big is the game ip licensed peripherals market in 2025?

The global game ip licensed peripherals market is estimated to be valued at USD 57.4 million in 2025.

What will be the size of game ip licensed peripherals market in 2035?

The market size for the game ip licensed peripherals market is projected to reach USD 94.4 million by 2035.

How much will be the game ip licensed peripherals market growth between 2025 and 2035?

The game ip licensed peripherals market is expected to grow at a 5.1% CAGR between 2025 and 2035.

What are the key product types in the game ip licensed peripherals market?

The key product types in game ip licensed peripherals market are toys, clothing accessories, pc game peripheral, books and posters and others.

Which application segment to contribute significant share in the game ip licensed peripherals market in 2025?

In terms of application, online segment to command 64.0% share in the game ip licensed peripherals market in 2025.

Table of Content

  1. Executive Summary
    • Global Market Outlook
    • Demand to side Trends
    • Supply to side Trends
    • Technology Roadmap Analysis
    • Analysis and Recommendations
  2. Market Overview
    • Market Coverage / Taxonomy
    • Market Definition / Scope / Limitations
  3. Market Background
    • Market Dynamics
      • Drivers
      • Restraints
      • Opportunity
      • Trends
    • Scenario Forecast
      • Demand in Optimistic Scenario
      • Demand in Likely Scenario
      • Demand in Conservative Scenario
    • Opportunity Map Analysis
    • Product Life Cycle Analysis
    • Supply Chain Analysis
    • Investment Feasibility Matrix
    • Value Chain Analysis
    • PESTLE and Porter’s Analysis
    • Regulatory Landscape
    • Regional Parent Market Outlook
    • Production and Consumption Statistics
    • Import and Export Statistics
  4. Global Market Analysis 2020 to 2024 and Forecast, 2025 to 2035
    • Historical Market Size Value (USD Million) Analysis, 2020 to 2024
    • Current and Future Market Size Value (USD Million) Projections, 2025 to 2035
      • Y to o to Y Growth Trend Analysis
      • Absolute $ Opportunity Analysis
  5. Global Market Pricing Analysis 2020 to 2024 and Forecast 2025 to 2035
  6. Global Market Analysis 2020 to 2024 and Forecast 2025 to 2035, By Type
    • Introduction / Key Findings
    • Historical Market Size Value (USD Million) Analysis By Type , 2020 to 2024
    • Current and Future Market Size Value (USD Million) Analysis and Forecast By Type , 2025 to 2035
      • Toys
      • Clothing Accessories
      • PC Game Peripheral
      • Books and Posters
      • Others
    • Y to o to Y Growth Trend Analysis By Type , 2020 to 2024
    • Absolute $ Opportunity Analysis By Type , 2025 to 2035
  7. Global Market Analysis 2020 to 2024 and Forecast 2025 to 2035, By Application
    • Introduction / Key Findings
    • Historical Market Size Value (USD Million) Analysis By Application, 2020 to 2024
    • Current and Future Market Size Value (USD Million) Analysis and Forecast By Application, 2025 to 2035
      • Online
      • Retail
      • Specialty Stores
    • Y to o to Y Growth Trend Analysis By Application, 2020 to 2024
    • Absolute $ Opportunity Analysis By Application, 2025 to 2035
  8. Global Market Analysis 2020 to 2024 and Forecast 2025 to 2035, By Region
    • Introduction
    • Historical Market Size Value (USD Million) Analysis By Region, 2020 to 2024
    • Current Market Size Value (USD Million) Analysis and Forecast By Region, 2025 to 2035
      • North America
      • Latin America
      • Western Europe
      • Eastern Europe
      • East Asia
      • South Asia and Pacific
      • Middle East & Africa
    • Market Attractiveness Analysis By Region
  9. North America Market Analysis 2020 to 2024 and Forecast 2025 to 2035, By Country
    • Historical Market Size Value (USD Million) Trend Analysis By Market Taxonomy, 2020 to 2024
    • Market Size Value (USD Million) Forecast By Market Taxonomy, 2025 to 2035
      • By Country
        • USA
        • Canada
        • Mexico
      • By Type
      • By Application
    • Market Attractiveness Analysis
      • By Country
      • By Type
      • By Application
    • Key Takeaways
  10. Latin America Market Analysis 2020 to 2024 and Forecast 2025 to 2035, By Country
    • Historical Market Size Value (USD Million) Trend Analysis By Market Taxonomy, 2020 to 2024
    • Market Size Value (USD Million) Forecast By Market Taxonomy, 2025 to 2035
      • By Country
        • Brazil
        • Chile
        • Rest of Latin America
      • By Type
      • By Application
    • Market Attractiveness Analysis
      • By Country
      • By Type
      • By Application
    • Key Takeaways
  11. Western Europe Market Analysis 2020 to 2024 and Forecast 2025 to 2035, By Country
    • Historical Market Size Value (USD Million) Trend Analysis By Market Taxonomy, 2020 to 2024
    • Market Size Value (USD Million) Forecast By Market Taxonomy, 2025 to 2035
      • By Country
        • Germany
        • UK
        • Italy
        • Spain
        • France
        • Nordic
        • BENELUX
        • Rest of Western Europe
      • By Type
      • By Application
    • Market Attractiveness Analysis
      • By Country
      • By Type
      • By Application
    • Key Takeaways
  12. Eastern Europe Market Analysis 2020 to 2024 and Forecast 2025 to 2035, By Country
    • Historical Market Size Value (USD Million) Trend Analysis By Market Taxonomy, 2020 to 2024
    • Market Size Value (USD Million) Forecast By Market Taxonomy, 2025 to 2035
      • By Country
        • Russia
        • Poland
        • Hungary
        • Balkan & Baltic
        • Rest of Eastern Europe
      • By Type
      • By Application
    • Market Attractiveness Analysis
      • By Country
      • By Type
      • By Application
    • Key Takeaways
  13. East Asia Market Analysis 2020 to 2024 and Forecast 2025 to 2035, By Country
    • Historical Market Size Value (USD Million) Trend Analysis By Market Taxonomy, 2020 to 2024
    • Market Size Value (USD Million) Forecast By Market Taxonomy, 2025 to 2035
      • By Country
        • China
        • Japan
        • South Korea
      • By Type
      • By Application
    • Market Attractiveness Analysis
      • By Country
      • By Type
      • By Application
    • Key Takeaways
  14. South Asia and Pacific Market Analysis 2020 to 2024 and Forecast 2025 to 2035, By Country
    • Historical Market Size Value (USD Million) Trend Analysis By Market Taxonomy, 2020 to 2024
    • Market Size Value (USD Million) Forecast By Market Taxonomy, 2025 to 2035
      • By Country
        • India
        • ASEAN
        • Australia & New Zealand
        • Rest of South Asia and Pacific
      • By Type
      • By Application
    • Market Attractiveness Analysis
      • By Country
      • By Type
      • By Application
    • Key Takeaways
  15. Middle East & Africa Market Analysis 2020 to 2024 and Forecast 2025 to 2035, By Country
    • Historical Market Size Value (USD Million) Trend Analysis By Market Taxonomy, 2020 to 2024
    • Market Size Value (USD Million) Forecast By Market Taxonomy, 2025 to 2035
      • By Country
        • Kingdom of Saudi Arabia
        • Other GCC Countries
        • Turkiye
        • South Africa
        • Other African Union
        • Rest of Middle East & Africa
      • By Type
      • By Application
    • Market Attractiveness Analysis
      • By Country
      • By Type
      • By Application
    • Key Takeaways
  16. Key Countries Market Analysis
    • USA
      • Pricing Analysis
      • Market Share Analysis, 2024
        • By Type
        • By Application
    • Canada
      • Pricing Analysis
      • Market Share Analysis, 2024
        • By Type
        • By Application
    • Mexico
      • Pricing Analysis
      • Market Share Analysis, 2024
        • By Type
        • By Application
    • Brazil
      • Pricing Analysis
      • Market Share Analysis, 2024
        • By Type
        • By Application
    • Chile
      • Pricing Analysis
      • Market Share Analysis, 2024
        • By Type
        • By Application
    • Germany
      • Pricing Analysis
      • Market Share Analysis, 2024
        • By Type
        • By Application
    • UK
      • Pricing Analysis
      • Market Share Analysis, 2024
        • By Type
        • By Application
    • Italy
      • Pricing Analysis
      • Market Share Analysis, 2024
        • By Type
        • By Application
    • Spain
      • Pricing Analysis
      • Market Share Analysis, 2024
        • By Type
        • By Application
    • France
      • Pricing Analysis
      • Market Share Analysis, 2024
        • By Type
        • By Application
    • India
      • Pricing Analysis
      • Market Share Analysis, 2024
        • By Type
        • By Application
    • ASEAN
      • Pricing Analysis
      • Market Share Analysis, 2024
        • By Type
        • By Application
    • Australia & New Zealand
      • Pricing Analysis
      • Market Share Analysis, 2024
        • By Type
        • By Application
    • China
      • Pricing Analysis
      • Market Share Analysis, 2024
        • By Type
        • By Application
    • Japan
      • Pricing Analysis
      • Market Share Analysis, 2024
        • By Type
        • By Application
    • South Korea
      • Pricing Analysis
      • Market Share Analysis, 2024
        • By Type
        • By Application
    • Russia
      • Pricing Analysis
      • Market Share Analysis, 2024
        • By Type
        • By Application
    • Poland
      • Pricing Analysis
      • Market Share Analysis, 2024
        • By Type
        • By Application
    • Hungary
      • Pricing Analysis
      • Market Share Analysis, 2024
        • By Type
        • By Application
    • Kingdom of Saudi Arabia
      • Pricing Analysis
      • Market Share Analysis, 2024
        • By Type
        • By Application
    • Turkiye
      • Pricing Analysis
      • Market Share Analysis, 2024
        • By Type
        • By Application
    • South Africa
      • Pricing Analysis
      • Market Share Analysis, 2024
        • By Type
        • By Application
  17. Market Structure Analysis
    • Competition Dashboard
    • Competition Benchmarking
    • Market Share Analysis of Top Players
      • By Regional
      • By Type
      • By Application
  18. Competition Analysis
    • Competition Deep Dive
      • Tencent
        • Overview
        • Product Portfolio
        • Profitability by Market Segments (Product/Age /Sales Channel/Region)
        • Sales Footprint
        • Strategy Overview
          • Marketing Strategy
          • Product Strategy
          • Channel Strategy
      • Microsoft
      • Nintendo
      • SONY
      • NetEase
      • Disney
      • Nexon
      • Ubisoft
      • miHoYo
      • Square Enix
      • Razer
      • Logitech G
      • Fangamer
      • McFarlane Toys
  19. Assumptions & Acronyms Used
  20. Research Methodology

List of Tables

  • Table 1: Global Market Value (USD Million) Forecast by Region, 2020 to 2035
  • Table 2: Global Market Value (USD Million) Forecast by Type , 2020 to 2035
  • Table 3: Global Market Value (USD Million) Forecast by Application, 2020 to 2035
  • Table 4: North America Market Value (USD Million) Forecast by Country, 2020 to 2035
  • Table 5: North America Market Value (USD Million) Forecast by Type , 2020 to 2035
  • Table 6: North America Market Value (USD Million) Forecast by Application, 2020 to 2035
  • Table 7: Latin America Market Value (USD Million) Forecast by Country, 2020 to 2035
  • Table 8: Latin America Market Value (USD Million) Forecast by Type , 2020 to 2035
  • Table 9: Latin America Market Value (USD Million) Forecast by Application, 2020 to 2035
  • Table 10: Western Europe Market Value (USD Million) Forecast by Country, 2020 to 2035
  • Table 11: Western Europe Market Value (USD Million) Forecast by Type , 2020 to 2035
  • Table 12: Western Europe Market Value (USD Million) Forecast by Application, 2020 to 2035
  • Table 13: Eastern Europe Market Value (USD Million) Forecast by Country, 2020 to 2035
  • Table 14: Eastern Europe Market Value (USD Million) Forecast by Type , 2020 to 2035
  • Table 15: Eastern Europe Market Value (USD Million) Forecast by Application, 2020 to 2035
  • Table 16: East Asia Market Value (USD Million) Forecast by Country, 2020 to 2035
  • Table 17: East Asia Market Value (USD Million) Forecast by Type , 2020 to 2035
  • Table 18: East Asia Market Value (USD Million) Forecast by Application, 2020 to 2035
  • Table 19: South Asia and Pacific Market Value (USD Million) Forecast by Country, 2020 to 2035
  • Table 20: South Asia and Pacific Market Value (USD Million) Forecast by Type , 2020 to 2035
  • Table 21: South Asia and Pacific Market Value (USD Million) Forecast by Application, 2020 to 2035
  • Table 22: Middle East & Africa Market Value (USD Million) Forecast by Country, 2020 to 2035
  • Table 23: Middle East & Africa Market Value (USD Million) Forecast by Type , 2020 to 2035
  • Table 24: Middle East & Africa Market Value (USD Million) Forecast by Application, 2020 to 2035

List of Figures

  • Figure 1: Global Market Pricing Analysis
  • Figure 2: Global Market Value (USD Million) Forecast 2020-2035
  • Figure 3: Global Market Value Share and BPS Analysis by Type , 2025 and 2035
  • Figure 4: Global Market Y-o-Y Growth Comparison by Type , 2025-2035
  • Figure 5: Global Market Attractiveness Analysis by Type
  • Figure 6: Global Market Value Share and BPS Analysis by Application, 2025 and 2035
  • Figure 7: Global Market Y-o-Y Growth Comparison by Application, 2025-2035
  • Figure 8: Global Market Attractiveness Analysis by Application
  • Figure 9: Global Market Value (USD Million) Share and BPS Analysis by Region, 2025 and 2035
  • Figure 10: Global Market Y-o-Y Growth Comparison by Region, 2025-2035
  • Figure 11: Global Market Attractiveness Analysis by Region
  • Figure 12: North America Market Incremental Dollar Opportunity, 2025-2035
  • Figure 13: Latin America Market Incremental Dollar Opportunity, 2025-2035
  • Figure 14: Western Europe Market Incremental Dollar Opportunity, 2025-2035
  • Figure 15: Eastern Europe Market Incremental Dollar Opportunity, 2025-2035
  • Figure 16: East Asia Market Incremental Dollar Opportunity, 2025-2035
  • Figure 17: South Asia and Pacific Market Incremental Dollar Opportunity, 2025-2035
  • Figure 18: Middle East & Africa Market Incremental Dollar Opportunity, 2025-2035
  • Figure 19: North America Market Value Share and BPS Analysis by Country, 2025 and 2035
  • Figure 20: North America Market Value Share and BPS Analysis by Type , 2025 and 2035
  • Figure 21: North America Market Y-o-Y Growth Comparison by Type , 2025-2035
  • Figure 22: North America Market Attractiveness Analysis by Type
  • Figure 23: North America Market Value Share and BPS Analysis by Application, 2025 and 2035
  • Figure 24: North America Market Y-o-Y Growth Comparison by Application, 2025-2035
  • Figure 25: North America Market Attractiveness Analysis by Application
  • Figure 26: Latin America Market Value Share and BPS Analysis by Country, 2025 and 2035
  • Figure 27: Latin America Market Value Share and BPS Analysis by Type , 2025 and 2035
  • Figure 28: Latin America Market Y-o-Y Growth Comparison by Type , 2025-2035
  • Figure 29: Latin America Market Attractiveness Analysis by Type
  • Figure 30: Latin America Market Value Share and BPS Analysis by Application, 2025 and 2035
  • Figure 31: Latin America Market Y-o-Y Growth Comparison by Application, 2025-2035
  • Figure 32: Latin America Market Attractiveness Analysis by Application
  • Figure 33: Western Europe Market Value Share and BPS Analysis by Country, 2025 and 2035
  • Figure 34: Western Europe Market Value Share and BPS Analysis by Type , 2025 and 2035
  • Figure 35: Western Europe Market Y-o-Y Growth Comparison by Type , 2025-2035
  • Figure 36: Western Europe Market Attractiveness Analysis by Type
  • Figure 37: Western Europe Market Value Share and BPS Analysis by Application, 2025 and 2035
  • Figure 38: Western Europe Market Y-o-Y Growth Comparison by Application, 2025-2035
  • Figure 39: Western Europe Market Attractiveness Analysis by Application
  • Figure 40: Eastern Europe Market Value Share and BPS Analysis by Country, 2025 and 2035
  • Figure 41: Eastern Europe Market Value Share and BPS Analysis by Type , 2025 and 2035
  • Figure 42: Eastern Europe Market Y-o-Y Growth Comparison by Type , 2025-2035
  • Figure 43: Eastern Europe Market Attractiveness Analysis by Type
  • Figure 44: Eastern Europe Market Value Share and BPS Analysis by Application, 2025 and 2035
  • Figure 45: Eastern Europe Market Y-o-Y Growth Comparison by Application, 2025-2035
  • Figure 46: Eastern Europe Market Attractiveness Analysis by Application
  • Figure 47: East Asia Market Value Share and BPS Analysis by Country, 2025 and 2035
  • Figure 48: East Asia Market Value Share and BPS Analysis by Type , 2025 and 2035
  • Figure 49: East Asia Market Y-o-Y Growth Comparison by Type , 2025-2035
  • Figure 50: East Asia Market Attractiveness Analysis by Type
  • Figure 51: East Asia Market Value Share and BPS Analysis by Application, 2025 and 2035
  • Figure 52: East Asia Market Y-o-Y Growth Comparison by Application, 2025-2035
  • Figure 53: East Asia Market Attractiveness Analysis by Application
  • Figure 54: South Asia and Pacific Market Value Share and BPS Analysis by Country, 2025 and 2035
  • Figure 55: South Asia and Pacific Market Value Share and BPS Analysis by Type , 2025 and 2035
  • Figure 56: South Asia and Pacific Market Y-o-Y Growth Comparison by Type , 2025-2035
  • Figure 57: South Asia and Pacific Market Attractiveness Analysis by Type
  • Figure 58: South Asia and Pacific Market Value Share and BPS Analysis by Application, 2025 and 2035
  • Figure 59: South Asia and Pacific Market Y-o-Y Growth Comparison by Application, 2025-2035
  • Figure 60: South Asia and Pacific Market Attractiveness Analysis by Application
  • Figure 61: Middle East & Africa Market Value Share and BPS Analysis by Country, 2025 and 2035
  • Figure 62: Middle East & Africa Market Value Share and BPS Analysis by Type , 2025 and 2035
  • Figure 63: Middle East & Africa Market Y-o-Y Growth Comparison by Type , 2025-2035
  • Figure 64: Middle East & Africa Market Attractiveness Analysis by Type
  • Figure 65: Middle East & Africa Market Value Share and BPS Analysis by Application, 2025 and 2035
  • Figure 66: Middle East & Africa Market Y-o-Y Growth Comparison by Application, 2025-2035
  • Figure 67: Middle East & Africa Market Attractiveness Analysis by Application
  • Figure 68: Global Market - Tier Structure Analysis
  • Figure 69: Global Market - Company Share Analysis
Dashboard
Dashboard
Dashboard
Dashboard
Dashboard
Dashboard

Our Research Products

Full Research Suite

The "Full Research Suite" delivers actionable market intel, deep dives on markets or technologies, so clients act faster, cut risk, and unlock growth.

Competitor Leaderboard Report

The Leaderboard benchmarks and ranks top vendors, classifying them as Established Leaders, Leading Challengers, or Disruptors & Challengers.

Future Leaders Index

Locates where complements amplify value and substitutes erode it, forecasting net impact by horizon

Market Data & Forecasts

We deliver granular, decision-grade intel: market sizing, 5-year forecasts, pricing, adoption, usage, revenue, and operational KPIs—plus competitor tracking, regulation, and value chains—across 60 countries broadly.

Market Focus Report

Spot the shifts before they hit your P&L. We track inflection points, adoption curves, pricing moves, and ecosystem plays to show where demand is heading, why it is changing, and what to do next across high-growth markets and disruptive tech

Survey Report

Real-time reads of user behavior. We track shifting priorities, perceptions of today’s and next-gen services, and provider experience, then pace how fast tech moves from trial to adoption, blending buyer, consumer, and channel inputs with social signals (#WhySwitch, #UX).

Bespoke Reports

Partner with our analyst team to build a custom report designed around your business priorities. From analysing market trends to assessing competitors or crafting bespoke datasets, we tailor insights to your needs.

Supplier Intelligence

Discovery & Profiling

Capacity & Footprint

Performance & Risk

Compliance & Governance

Commercial Readiness

Who Supplies Whom

Scorecards & Shortlists

Playbooks & Docs

Category Intelligence

Definition & Scope

Demand & Use Cases

Cost Drivers

Market Structure

Supply Chain Map

Trade & Policy

Operating Norms

Deliverables

Buyer Intelligence

Account Basics

Spend & Scope

Procurement Model

Vendor Requirements

Terms & Policies

Entry Strategy

Pain Points & Triggers

Outputs

Pricing Analysis

Benchmarks

Trends

Should-Cost

Indexation

Landed Cost

Commercial Terms

Deliverables

Brand Analysis

Positioning & Value Prop

Share & Presence

Customer Evidence

Go-to-Market

Digital & Reputation

Compliance & Trust

KPIs & Gaps

Outputs

Full Research Suite comprises of:

Market outlook & trends analysis

Market outlook & trends analysis

Interviews & case studies

Interviews & case studies

Strategic recommendations

Strategic recommendations

Vendor profiles & capabilities analysis

Vendor profiles & capabilities analysis

5-year forecasts

5-year forecasts

8 regions and 60+ country-level data splits

8 regions and 60+ country-level data splits

Market segment data splits

Market segment data splits

12 months of continuous data updates

12 months of continuous data updates

DELIVERED AS:

PDF EXCEL ONLINE

Full Research Suite


$2000

$3500

$5000

Buy Report Now
Similar Industry Reports

Similar Industry Reports

Game Creation Service Platform Market

Game Creation Service Platform Market Size and Share Forecast Outlook 2025 to 2035

Game Consoles Market

Game Consoles Market Size and Share Forecast Outlook 2025 to 2035

Games and Puzzles Market

Games and Puzzles Market is segmented by Type, Licensing, Distribution Channel and Region through 2025 to 2035.

Ligament Augmentation Market

Ligament Augmentation Market Insights - Size, Share & Forecast 2025 to 2035

Video Game Market
Video Game Market

Video Game Market Size and Share Forecast Outlook 2025 to 2035

Board Games Market
Board Games Market

Board Games Market Size and Share Forecast Outlook 2025 to 2035

Serious Game Market
Serious Game Market

Serious Game Market Trends - Growth, Demand & Forecast 2025 to 2035

Connected Game Console Market

Connected Game Console Market Analysis by Product Type, Application, and Region through 2035

 eSports & Games Streaming Market
eSports & Games Streaming Market

eSports & Games Streaming Market – Trends & Forecast 2023-2033

Traditional Toys and Games Market

Traditional Toys and Games Market Size and Share Forecast Outlook 2025 to 2035

IP TCG Market
IP TCG Market

IP TCG Market Size and Share Forecast Outlook 2025 to 2035

IPM Motors Market
IPM Motors Market

IPM Motors Market Size and Share Forecast Outlook 2025 to 2035

IP Pop Toy Market
IP Pop Toy Market

IP Pop Toy Market Size and Share Forecast Outlook 2025 to 2035

IP PBX Market
IP PBX Market

IP PBX Market Analysis - Size, Share, and Forecast 2025 to 2035

IP Camera Market
IP Camera Market

IP Camera Market Trends – Growth, Demand & Forecast 2025 to 2035

IP-MPLS VPN Services Market

IP-MPLS VPN Services Market Insights – Trends & Forecast 2025 to 2035

IP Centrex Platforms Market

IP Centrex Platforms Market

IP Multimedia Subsystem (IMS) Market

IP Multimedia Subsystem Market Report – Forecast 2016-2026

RIP Color Management Software Market

RIP Color Management Software Market Size and Share Forecast Outlook 2025 to 2035

SIP Speakers Market
SIP Speakers Market

SIP Speakers Market Size and Share Forecast Outlook 2025 to 2035

Future Market Insights

Game IP Licensed Peripherals Market

Chat With MaRIA

Chat With

MaRIA

Hi There, I am MaRIA, Your Market Research Intelligence Assistant. How may I help you?