Global Traditional Toys and Games Market Snapshot (2023 to 2033)

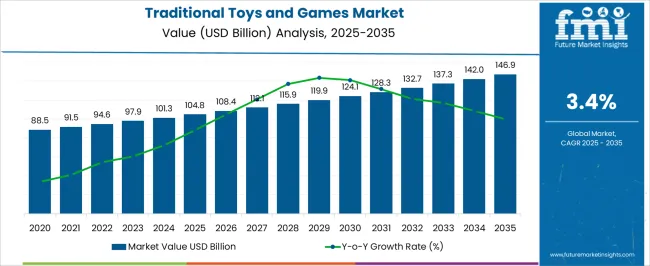
The anticipated size of the global traditional toys and games market in 2022 was valued at USD 93,847.9 million. One of the main factors boosting the global rise in the traditional toy sector is the increased acceptance of building toys among the adult children to improve their ability to learn. It is thus likely to have produced USD 139,013 million by 2033, alongside a CAGR of 3.6% from 2023 to 2033.

Demand for conventional toys and games is picking up as parents become increasingly aware about the cognitive benefits of building toys. While mobile-based gaming is expected to enjoy the limelight, increasing availability of traditional toys via online channels will continue supporting the traditional toys and games market growth.

The majority of millennials are increasingly drawn to buying miniatures, puzzles, as well as action figures based on their favorite comic book heroes along with cartoon characters. Millennials' shopping habits are being influenced by depictions of these characters in films, television shows, novels, and comic books because they want to own these distinctive items.

Leading toy companies are leveraging this development by focusing on the interests and memories of the target market to forge deeper emotional ties. By building a theme around well-known characters and themes from the 1980s and 1990s, toy manufacturers are selling toys and games that transport the audience back in time. Such factors are mostly responsible for propelling the growth all throughout the world during the forecast period.

Report Attribute Details
Estimated Market Value (2022) USD 93,847.9 million
Expected Market Value (2023) USD 97,601.8 million
Projected Forecast Value (2033) USD 139,013 million
Anticipated Growth Rate (2023 to 2033) 3.6% CAGR

Global Traditional Toys and Games Market Historical Analysis (2018 to 2022) Vs. Forecast Outlook (2023 to 2033)

Sales of traditional games and toys increased at a 3.3% CAGR between 2018 and 2022, finds FMI. Demand for traditional games and toys for at-home entertainment increased at a significant pace due to the lockdown restrictions imposed to curb the COVID-19 outbreak.

Manufacturers actively shifted towards online sales channels to keep sales of traditional toys and games afloat as physical stores were temporarily shut down. The global traditional toys and games market registered year-over-year growth by 2.3% between 2021 and 2022. Conventional toys are games are often crucial to support early childhood education in classrooms.

Teachers use traditional toys such as puzzles, construction sets, and other educational toys to stimulate play and cognitive development. These toys also help keeping children engaged and boost their curiosity and ability to explore and grasp knowledge about new shapes and elements.

Educational institutes across the globe are focusing on mental and physical learning. Educational toys are gaining traction, especially in preschools, kindergarten and middle school. This is expected to propel demand for traditional toys and games. A huge chunk of the millennial population is getting keen on obtaining traditional toys, figurines and puzzles as collectibles. This factor is encouraging manufacturers to re-launch traditional games, featuring legendary characters inspired by pop culture.

As per the traditional toys and games industry analysis, sales in the market is expected to grow at a 3.6% CAGR through 2033 on the back of the aforementioned trends.

What is primarily Driving the Global Market for Traditional Toys and Games?

Cognitive Benefits of Traditional Toys and Games Driving Sales

Cognitive development in children involves thinking skills, the ability to process information and a basic understanding of how the world works. Toys and games naturally offer opportunities for children to practice different thinking skills, such as cause and effect, imitation, symbolic thinking and problem solving.

For instance, when a teacher guides children how to use simple objects like pots and pans as drumming instruments, they imitate the teacher and make a sound of their own. Offering opportunities like this allows children to practice imitation, understand cause and effect and to discover new elements. Sensory play helps stimulate a child’s senses, develops hand-eye coordination and encourages interaction. Problem solving toys such as light-up mats, stackers and blocks and others help children figure out cause and effect, and boost their confidence through trial and error while promoting movement.

Themed playsets, construction sets and dolls help children develop their recognition skills. These toys also assist with language development by reinforcing the names of colors and shapes. Consumers, especially millennial parents, are widely recognizing the need for traditional toys and games for the development of their children’s cognitive abilities. These toys are being used not only in schools but also at homes, preschools, playpens, and babysitting facilities. Sales of traditional toys and games are expected to propel at a remarkably over the forecast period.

Pop Culture to Influence Spurring Demand for Traditional Toys and Games

Millennials are largely getting inclined towards purchasing figurines, puzzles and action figures of their favorite cartoon characters and superheroes. Depiction of these characters in movies, television shows, books, and comics are influencing purchasing decisions of millennials, as they want to have these unique collectibles in their collection.

Leading toy brands are capitalizing on this trend by honing in on the target audience’s memories and interests to develop stronger and emotional connections. Toy makers are realizing the significance of a visual language that connects to the experience of their past. They are offering toys and games that take the audience down the memory lane, by creating a theme around popular themes and characters from the 80s and 90s.

Millennials seek toys and games that feature pop culture references, which include Legos, Transformers, Star Wars and Strawberry Shortcake for their kids as parents who grew up in the 80s. Watching these shows and buying these toys connects millennials to their past and gives them a hint of nostalgia. These consumers also want their kids to have a similar experience as a mean to establish a shared memory.

For brands and marketers, it can lead to brand loyalty and increased sales. Apart from this, popular movies such as harry Potter, Shrek, Toy Story and Cars have rocked the box office as well as retail shelves with interesting tie-in figurines and games. In 2020, Leading pop culture consumer products and toys company Funko launched ‘Marvel Battleworld: Mystery of the Thanostones’, a micro table gaming system. The company collaborated with animation production and comics house Marvel to engage their younger fans and adults with a new range of products and animation collaboration.

Collecting such toys, puzzles and figurines is a trending hobby among millennials, young adults, and children under the age group 11 to 14. Sales of traditional toys and games are expected to soar in the forthcoming years, opines FMI.

Category-wise Insights

Which Product Type will gain Popularity in the Coming Years?

Demand for Construction Games is Anticipated to Gain Momentum

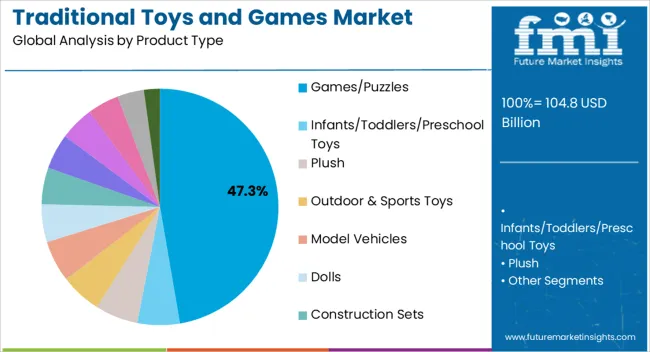
Based on product type, sales of construction games are expected to gain traction over the assessment period, as per FMI. The construction games acquired a 17.2% market share in 2022. Construction games are popular among kids and young adults as they require creativity and decision making regarding the placement of objects and components.

Leading toy makers such as Lego and Hasbro have launched a myriad of construction games in the past that are still popular among individuals. Hasbro’s Jenga is a crowd favorite, and many similar toys and games are gaining attention of consumers as they can be played in a group or alone.

Which Material is Most Preferred in the Traditional Toys and Games Market?

The Plastic Materials is the Most Sought-after Material Globally

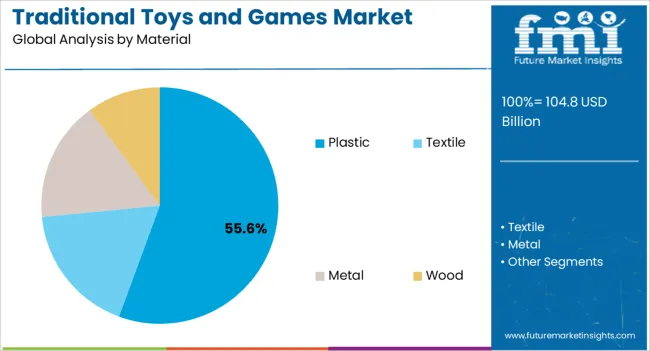
In terms of material type, plastic is expected to emerge as the most preferred material for manufacturing toys and games. Plastic has been used in the toy manufacturing industry for many years due to factors such as low costs, ease of molding, and the possibility of producing complex shapes and forms.

Manufacturers operating in the traditional toys and games market are also focusing on research development to launch toys made form biodegradable plastic. Manufacturer are also using biodegradable plastics for packaging of games and toys to reduce carbon footprint.

Which Age Group Will Account for Maximum Sales of Traditional Toys and Games?

The 3 to 4 years Age Group is likely to be More Attracted towards these Games

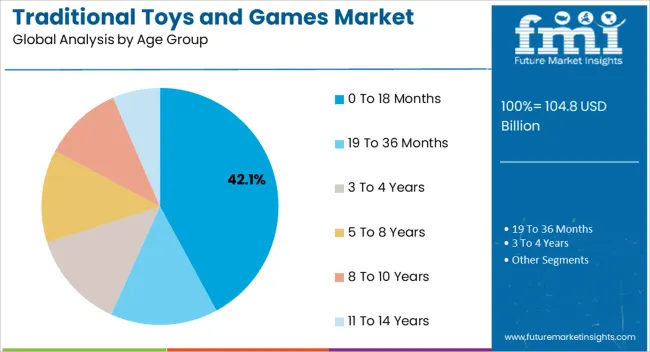
Sales of traditional toys and games for the age group 3 to 4 years are expected to gain traction over the assessment period, finds FMI. Demand for traditional toys and games for education purposed is increasing for children in this age group, which will continue providing tailwinds to sales of the same over the assessment period.

3 to 4 year olds are in their early stages of mental and physical development. Educational toys and games facilitate the development of cognitive abilities and decision making in children, which in turn will continue propelling sales of traditional toys and games through 2033.

Which Sales Channel Will Remain Highly Sought-After?

The Hypermarkets/Supermarkets Sales Channel is Likely to be Highly Preferred by the Consumers

In terms of sales channels, the hypermarkets/ supermarkets is expected to expand at a steady pace over the assessment period. The hypermarket/supermarket sales gained a 25.6% market share in 2022. Growth in this segment is attributable to availability of a wide range of toys and games, along with convenience of choice, a wide array of things to choose from and payment options.

To keep themselves entertained at home, consumers were actively buying games and toys through this sales channels. This trend is predicted to continue in the forthcoming years, augmenting growth of the traditional toys and games market over the forecast period.

Region-wise Analysis

What is driving the United States Traditional Toys and Games Market?

The Urge to Indulge the Kinds in Various Activities is Likely to Boost the Market Growth

In 2022, sales of traditional games and toys increased due to lockdown restrictions. Consumers were increasingly purchasing dolls, puzzles and model vehicles to keep their children engaged and entertained. Sales of traditional toys and games among adults also grew at a significant pace, as home-bound individuals wanted to pass time.

The United States will continue exhibiting high demand for traditional toys and games over the forecast period. The country accounted for a 16.4% market share in 2022. As per the study, sales of traditional toys and games in North America are slated to grow at a 2% CAGR through 2033.

Licensing and branding of traditional toys and games with popular franchise is also a key factor driving sales in the United States market. For instance, one of the most popular toy makers in the world, Hasbro, has licensed its toys and games with Transformers and Back to the Future that transform the DeLorean car featured in the movie just like a transformer.

Hasbro launched a unique product that grabbed the attention of kids as well as millennials by combining both of these elements from these famous movies. These developments are indicative of lucrative growth prospects for players operating in the traditional toys market in the United States.

How Will Sales Fare in the United Kingdom Traditional Toys and Games Market?

Rising Trend towards Digitalization of Traditional Toys might Enhance Sales

Demand for traditional toys and games in the United Kingdom is expected to grow at a steady pace, on the back of growing trend of ‘home-entertainment’. As per FMI, the traditional toys and games market in Europe is forecast to expand at a 4.7% CAGR over the assessment period.

Digitalization of traditional toys and games is also expected to fuel growth of the market in the United Kingdom. Rapid adoption of smartphones, tablets, gaming consoles and other smart devices is broadening the scope for sales of toys and games through online channels. Brands are also using technologies such as virtual reality (VR) and artificial intelligence (AI) to attract consumers’ attention.

LEGO VIDIYO, for instance, is a music video making toy that enables children to star in their own music videos alongside Lego sets and mini figurines. These product developments are combining digital and physical worlds through connective technology, which is likely to gain traction in the forthcoming years. Demand for traditional toys and games is expected to remain high owing to the above-mentioned factors in the United Kingdom through 2033.

Why is China Traditional Toys and Games Market Considered Attractive?

Increasing Consumer trend towards Collectibles is likely to propel Growth

Growing preference for eCommerce for purchasing traditional toys and games in China is expected to place it as an attractive market with a 7.1% CAGR during the assessment period. Even after the resumption of trade activities in China, consumers are buying essentials and non-essential commodities through online channels.

Rising trend of collectibles is also fueling sales of traditional toys and games in China. Consumers are seeking limited edition games, action figures, toys and puzzles to expand their collection, which in turn is spurring demand for the same. This trend is expected to continue over the forecast period.
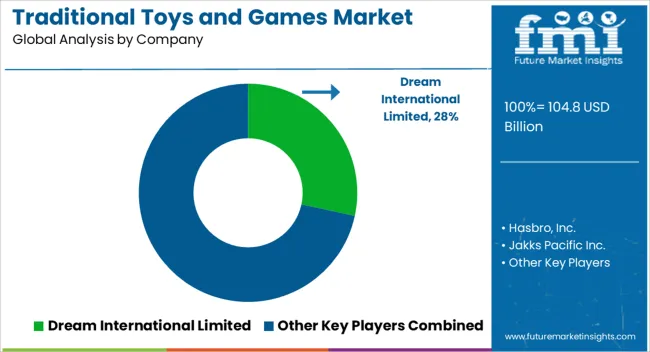
Market Competition

The top traditional toys and games producers are focusing on expanding their product portfolio by launching new products through online sales channels. Apart from this, leading companies in the traditional toys and games market are aiming at strengthening their global footprint through mergers, strategic collaborations, and acquisitions. For instance:

The key players in this market include:

  • Dream International Limited
  • Hasbro, Inc.
  • Jakks Pacific Inc.
  • Mattel, Inc.
  • Lego A/S
  • BANDAI NAMCO Holdings Inc.
  • LeapFrog Enterprises, Inc.
  • Spin Master Corp
  • Tomy Co., Ltd.
  • Playmates Toys Limited
  • Games Workshop Group PLC
  • Kids Ii Inc.
  • Madame Alexander Doll Company LLC
  • Mega Brands Inc.
  • Melissa & Doug Inc.
  • Funskool (India) Limited
  • Funko LLC
  • K'NEX Brands, L.P.
  • Ravensburger AG
  • MGA Entertainment, Inc.

Some of the products being launched by the key players are:

  • In November 2021, Mattel Inc., a global leader in kids’ toys and games, which also comprises many sub-brands of children’s toys, and one of the most popular ones being Barbie dolls, celebrated Hispanic Heritage month by releasing a Celia Cruz Doll. Known as the ‘Queen of Salsa’, Celia Cruz was one of the most popular Latin artist in the 20th century.
  • In November 2021, Lego A/S launched the Ultimate Collector Series Star Wars AT-AT, comprising 6,785 pieces in total. The new collectible is meant for children as well as millennials who are keen on investing in unique toys and games.
  • The India Toy Show, India's first virtual toy show, was hosted from February 27 to March 2, 2022, and according to toy company, Funskool India, it included 15 new conventional Indian toys and games. Kho-Kho, Chaturanga, Kabaddi, and Gilli Danda, along with other traditional Indian outdoor activities, have been transformed by Funskool into board games. The company has also produced puzzles that feature Panchatantra stories and legendary Indian characters.
  • Hasbro, Inc., a pioneer in play and entertainment worldwide, declared that it will continue to implement its purpose-driven branding blueprint approach in 2022 with a broad range of new content and merchandise across its renowned portfolio. Hasbro introduced all-new entertainment as well as product innovations in a number of popular franchise categories, such as action franchises like Transformers and Power Rangers, sports action franchises led by NERF, arts and crafts franchises like the Play-Doh, gaming franchises like Dungeons & Dragons, Clue, Magic: The Gathering, and Monopoly, as well as preschool franchises like Peppa Pig along with PJ Masks.

Report Scope

Report Attribute Details
Growth Rate CAGR of 3.6% from 2022 to 2032
Market value in 2023 USD 97,601.8 million
Market value in 2033 USD 139,013 million
Base Year for Estimation 2022
Historical Data 2018 to 2022
Forecast Period 2023 to 2033
Quantitative Units USD million for value
Report Coverage Revenue Forecast, Volume Forecast, Company Ranking, Competitive Landscape, Growth Factors, Trends, and Pricing Analysis
Segments Covered Product Type, Material, Age Group, Sales Channel, Region
Regions Covered North America; Latin America; Europe; Asia Pacific; Middle East and Africa
Key Countries Profiled United States, Canada, Mexico, Brazil, Germany, United Kingdom, France, Spain, Italy, Japan, China, Singapore, Thailand, Indonesia, Israel, GCC Countries, South Africa, Australia, New Zealand
Key Companies Profiled Dream International Limited; Hasbro, Inc.; Jakks Pacific Inc.; Mattel, Inc.; Lego A/S; BANDAI NAMCO Holdings Inc.; LeapFrog Enterprises, Inc.; Spin Master Corp; Tomy Co., Ltd.; Playmates Toys Limited; Games Workshop Group PLC; Kids Ii Inc.; Madame Alexander Doll Company LLC; Mega Brands Inc.; Melissa & Doug Inc.; Funskool (India) Limited; Funko LLC; K'NEX Brands, L.P.; Ravensburger AG; MGA Entertainment, Inc.
Customization & Pricing Available on Request

Key Segments Profiled in the Global Traditional Toys and Games Market

By Product Type:

  • Games/Puzzles
  • Infants/Toddlers/Preschool Toys
  • Plush
  • Outdoor & Sports Toys
  • Model Vehicles
  • Dolls
  • Construction sets
  • Art and Crafts
  • Remote control toys
  • Educational toys
  • Dress up and role play
  • Ride on Vehicles

By Material:

  • Plastic
  • Textile
  • Metal
  • Wood

By Age Group:

  • 0 to 18 months
  • 19 to 36 months
  • 3 to 4 years
  • 5 to 8 years
  • 8 to 10 years
  • 11 to 14 years

By Sales Channel:

  • Hyper/Supermarket
  • Online
  • Franchised Outlets
  • Departmental Stores
  • Others

By Region:

  • North America
  • Latin America
  • Europe
  • Asia Pacific
  • Middle East and Africa

Table of Content

  • 1. Executive Summary
  • 2. Market Overview
  • 3. Market Background
  • 4. Global Market Analysis 2018 to 2022 and Forecast, 2023 to 2033
  • 5. Global Market Analysis 2018 to 2022 and Forecast 2023 to 2033, By Product Type
    • 5.1. Games/Puzzles
    • 5.2. Infants/Toddlers/Preschool Toys
    • 5.3. Plush
    • 5.4. Outdoor & Sports Toys
    • 5.5. Model Vehicles
    • 5.6. Dolls
    • 5.7. Construction sets
    • 5.8. Art and Crafts
    • 5.9. Remote control toys
    • 5.10. Educational toys
    • 5.11. Dress up and role play
    • 5.12. Ride on vehicles
  • 6. Global Market Analysis 2018 to 2022 and Forecast 2023 to 2033, By Material
    • 6.1. Plastic
    • 6.2. Textile
    • 6.3. Metal
    • 6.4. Wood
  • 7. Global Market Analysis 2018 to 2022 and Forecast 2023 to 2033, By Age Group
    • 7.1. 0-18 months
    • 7.2. 19-36 months
    • 7.3. 3-4 years
    • 7.4. 5-8 years
    • 7.5. 8-10 years
    • 7.6. 11-14 years
  • 8. Global Market Analysis 2018 to 2022 and Forecast 2023 to 2033, By Sales Channel
    • 8.1. Hyper/Supermarkets
    • 8.2. Online
    • 8.3. Franchised Outlets
    • 8.4. Departmental Stores
    • 8.5. Others
  • 9. Global Market Analysis 2018 to 2022 and Forecast 2023 to 2033, By Region
    • 9.1. North America
    • 9.2. Latin America
    • 9.3. Europe
    • 9.4. Asia Pacific
    • 9.5. Middle East & Africa
  • 10. North America Market Analysis 2018 to 2022 and Forecast 2023 to 2033, By Country
  • 11. Latin America Market Analysis 2018 to 2022 and Forecast 2023 to 2033, By Country
  • 12. Europe Market Analysis 2018 to 2022 and Forecast 2023 to 2033, By Country
  • 13. Asia Pacific Market Analysis 2018 to 2022 and Forecast 2023 to 2033, By Country
  • 14. MEA Market Analysis 2018 to 2022 and Forecast 2023 to 2033, By Country
  • 15. Key Countries Market Analysis
  • 16. Market Structure Analysis
  • 17. Competition Analysis
    • 17.1. Dream International Limited
    • 17.2. Hasbro, Inc.
    • 17.3. Jakks Pacific Inc.
    • 17.4. Mattel, Inc.
    • 17.5. MGA Entertainment, Inc.
    • 17.6. BANDAI NAMCO Holdings Inc.
    • 17.7. LeapFrog Enterprises, Inc.
    • 17.8. Spin Master Corp
    • 17.9. Tomy Co., Ltd.
    • 17.10. Playmates Toys Limited
    • 17.11. Games Workshop Group PLC
    • 17.12. Kids Ii Inc.
    • 17.13. Madame Alexander Doll Company LLC
    • 17.14. Mega Brands Inc.
    • 17.15. Melissa & Doug Inc.
    • 17.16. Funskool (India) Limited
    • 17.17. Funko LLC
    • 17.18. K'NEX Brands, L.P.
    • 17.19. Ravensburger AG
    • 17.20. Lego A/S
  • 18. Assumptions & Acronyms Used
  • 19. Research Methodology

List of Tables

Table 1: Global Market Value (US$ Million) Forecast by Region, 2018 to 2033

Table 2: Global Market Volume (Units) Forecast by Region, 2018 to 2033

Table 3: Global Market Value (US$ Million) Forecast by Product Type, 2018 to 2033

Table 4: Global Market Volume (Units) Forecast by Product Type, 2018 to 2033

Table 5: Global Market Value (US$ Million) Forecast by Material, 2018 to 2033

Table 6: Global Market Volume (Units) Forecast by Material, 2018 to 2033

Table 7: Global Market Value (US$ Million) Forecast by Age Group, 2018 to 2033

Table 8: Global Market Volume (Units) Forecast by Age Group, 2018 to 2033

Table 9: Global Market Value (US$ Million) Forecast by Sales Channel, 2018 to 2033

Table 10: Global Market Volume (Units) Forecast by Sales Channel, 2018 to 2033

Table 11: North America Market Value (US$ Million) Forecast by Country, 2018 to 2033

Table 12: North America Market Volume (Units) Forecast by Country, 2018 to 2033

Table 13: North America Market Value (US$ Million) Forecast by Product Type, 2018 to 2033

Table 14: North America Market Volume (Units) Forecast by Product Type, 2018 to 2033

Table 15: North America Market Value (US$ Million) Forecast by Material, 2018 to 2033

Table 16: North America Market Volume (Units) Forecast by Material, 2018 to 2033

Table 17: North America Market Value (US$ Million) Forecast by Age Group, 2018 to 2033

Table 18: North America Market Volume (Units) Forecast by Age Group, 2018 to 2033

Table 19: North America Market Value (US$ Million) Forecast by Sales Channel, 2018 to 2033

Table 20: North America Market Volume (Units) Forecast by Sales Channel, 2018 to 2033

Table 21: Latin America Market Value (US$ Million) Forecast by Country, 2018 to 2033

Table 22: Latin America Market Volume (Units) Forecast by Country, 2018 to 2033

Table 23: Latin America Market Value (US$ Million) Forecast by Product Type, 2018 to 2033

Table 24: Latin America Market Volume (Units) Forecast by Product Type, 2018 to 2033

Table 25: Latin America Market Value (US$ Million) Forecast by Material, 2018 to 2033

Table 26: Latin America Market Volume (Units) Forecast by Material, 2018 to 2033

Table 27: Latin America Market Value (US$ Million) Forecast by Age Group, 2018 to 2033

Table 28: Latin America Market Volume (Units) Forecast by Age Group, 2018 to 2033

Table 29: Latin America Market Value (US$ Million) Forecast by Sales Channel, 2018 to 2033

Table 30: Latin America Market Volume (Units) Forecast by Sales Channel, 2018 to 2033

Table 31: Europe Market Value (US$ Million) Forecast by Country, 2018 to 2033

Table 32: Europe Market Volume (Units) Forecast by Country, 2018 to 2033

Table 33: Europe Market Value (US$ Million) Forecast by Product Type, 2018 to 2033

Table 34: Europe Market Volume (Units) Forecast by Product Type, 2018 to 2033

Table 35: Europe Market Value (US$ Million) Forecast by Material, 2018 to 2033

Table 36: Europe Market Volume (Units) Forecast by Material, 2018 to 2033

Table 37: Europe Market Value (US$ Million) Forecast by Age Group, 2018 to 2033

Table 38: Europe Market Volume (Units) Forecast by Age Group, 2018 to 2033

Table 39: Europe Market Value (US$ Million) Forecast by Sales Channel, 2018 to 2033

Table 40: Europe Market Volume (Units) Forecast by Sales Channel, 2018 to 2033

Table 41: Asia Pacific Market Value (US$ Million) Forecast by Country, 2018 to 2033

Table 42: Asia Pacific Market Volume (Units) Forecast by Country, 2018 to 2033

Table 43: Asia Pacific Market Value (US$ Million) Forecast by Product Type, 2018 to 2033

Table 44: Asia Pacific Market Volume (Units) Forecast by Product Type, 2018 to 2033

Table 45: Asia Pacific Market Value (US$ Million) Forecast by Material, 2018 to 2033

Table 46: Asia Pacific Market Volume (Units) Forecast by Material, 2018 to 2033

Table 47: Asia Pacific Market Value (US$ Million) Forecast by Age Group, 2018 to 2033

Table 48: Asia Pacific Market Volume (Units) Forecast by Age Group, 2018 to 2033

Table 49: Asia Pacific Market Value (US$ Million) Forecast by Sales Channel, 2018 to 2033

Table 50: Asia Pacific Market Volume (Units) Forecast by Sales Channel, 2018 to 2033

Table 51: MEA Market Value (US$ Million) Forecast by Country, 2018 to 2033

Table 52: MEA Market Volume (Units) Forecast by Country, 2018 to 2033

Table 53: MEA Market Value (US$ Million) Forecast by Product Type, 2018 to 2033

Table 54: MEA Market Volume (Units) Forecast by Product Type, 2018 to 2033

Table 55: MEA Market Value (US$ Million) Forecast by Material, 2018 to 2033

Table 56: MEA Market Volume (Units) Forecast by Material, 2018 to 2033

Table 57: MEA Market Value (US$ Million) Forecast by Age Group, 2018 to 2033

Table 58: MEA Market Volume (Units) Forecast by Age Group, 2018 to 2033

Table 59: MEA Market Value (US$ Million) Forecast by Sales Channel, 2018 to 2033

Table 60: MEA Market Volume (Units) Forecast by Sales Channel, 2018 to 2033

List of Figures

Figure 1: Global Market Value (US$ Million) by Product Type, 2023 to 2033

Figure 2: Global Market Value (US$ Million) by Material, 2023 to 2033

Figure 3: Global Market Value (US$ Million) by Age Group, 2023 to 2033

Figure 4: Global Market Value (US$ Million) by Sales Channel, 2023 to 2033

Figure 5: Global Market Value (US$ Million) by Region, 2023 to 2033

Figure 6: Global Market Value (US$ Million) Analysis by Region, 2018 to 2033

Figure 7: Global Market Volume (Units) Analysis by Region, 2018 to 2033

Figure 8: Global Market Value Share (%) and BPS Analysis by Region, 2023 to 2033

Figure 9: Global Market Y-o-Y Growth (%) Projections by Region, 2023 to 2033

Figure 10: Global Market Value (US$ Million) Analysis by Product Type, 2018 to 2033

Figure 11: Global Market Volume (Units) Analysis by Product Type, 2018 to 2033

Figure 12: Global Market Value Share (%) and BPS Analysis by Product Type, 2023 to 2033

Figure 13: Global Market Y-o-Y Growth (%) Projections by Product Type, 2023 to 2033

Figure 14: Global Market Value (US$ Million) Analysis by Material, 2018 to 2033

Figure 15: Global Market Volume (Units) Analysis by Material, 2018 to 2033

Figure 16: Global Market Value Share (%) and BPS Analysis by Material, 2023 to 2033

Figure 17: Global Market Y-o-Y Growth (%) Projections by Material, 2023 to 2033

Figure 18: Global Market Value (US$ Million) Analysis by Age Group, 2018 to 2033

Figure 19: Global Market Volume (Units) Analysis by Age Group, 2018 to 2033

Figure 20: Global Market Value Share (%) and BPS Analysis by Age Group, 2023 to 2033

Figure 21: Global Market Y-o-Y Growth (%) Projections by Age Group, 2023 to 2033

Figure 22: Global Market Value (US$ Million) Analysis by Sales Channel, 2018 to 2033

Figure 23: Global Market Volume (Units) Analysis by Sales Channel, 2018 to 2033

Figure 24: Global Market Value Share (%) and BPS Analysis by Sales Channel, 2023 to 2033

Figure 25: Global Market Y-o-Y Growth (%) Projections by Sales Channel, 2023 to 2033

Figure 26: Global Market Attractiveness by Product Type, 2023 to 2033

Figure 27: Global Market Attractiveness by Material, 2023 to 2033

Figure 28: Global Market Attractiveness by Age Group, 2023 to 2033

Figure 29: Global Market Attractiveness by Sales Channel, 2023 to 2033

Figure 30: Global Market Attractiveness by Region, 2023 to 2033

Figure 31: North America Market Value (US$ Million) by Product Type, 2023 to 2033

Figure 32: North America Market Value (US$ Million) by Material, 2023 to 2033

Figure 33: North America Market Value (US$ Million) by Age Group, 2023 to 2033

Figure 34: North America Market Value (US$ Million) by Sales Channel, 2023 to 2033

Figure 35: North America Market Value (US$ Million) by Country, 2023 to 2033

Figure 36: North America Market Value (US$ Million) Analysis by Country, 2018 to 2033

Figure 37: North America Market Volume (Units) Analysis by Country, 2018 to 2033

Figure 38: North America Market Value Share (%) and BPS Analysis by Country, 2023 to 2033

Figure 39: North America Market Y-o-Y Growth (%) Projections by Country, 2023 to 2033

Figure 40: North America Market Value (US$ Million) Analysis by Product Type, 2018 to 2033

Figure 41: North America Market Volume (Units) Analysis by Product Type, 2018 to 2033

Figure 42: North America Market Value Share (%) and BPS Analysis by Product Type, 2023 to 2033

Figure 43: North America Market Y-o-Y Growth (%) Projections by Product Type, 2023 to 2033

Figure 44: North America Market Value (US$ Million) Analysis by Material, 2018 to 2033

Figure 45: North America Market Volume (Units) Analysis by Material, 2018 to 2033

Figure 46: North America Market Value Share (%) and BPS Analysis by Material, 2023 to 2033

Figure 47: North America Market Y-o-Y Growth (%) Projections by Material, 2023 to 2033

Figure 48: North America Market Value (US$ Million) Analysis by Age Group, 2018 to 2033

Figure 49: North America Market Volume (Units) Analysis by Age Group, 2018 to 2033

Figure 50: North America Market Value Share (%) and BPS Analysis by Age Group, 2023 to 2033

Figure 51: North America Market Y-o-Y Growth (%) Projections by Age Group, 2023 to 2033

Figure 52: North America Market Value (US$ Million) Analysis by Sales Channel, 2018 to 2033

Figure 53: North America Market Volume (Units) Analysis by Sales Channel, 2018 to 2033

Figure 54: North America Market Value Share (%) and BPS Analysis by Sales Channel, 2023 to 2033

Figure 55: North America Market Y-o-Y Growth (%) Projections by Sales Channel, 2023 to 2033

Figure 56: North America Market Attractiveness by Product Type, 2023 to 2033

Figure 57: North America Market Attractiveness by Material, 2023 to 2033

Figure 58: North America Market Attractiveness by Age Group, 2023 to 2033

Figure 59: North America Market Attractiveness by Sales Channel, 2023 to 2033

Figure 60: North America Market Attractiveness by Country, 2023 to 2033

Figure 61: Latin America Market Value (US$ Million) by Product Type, 2023 to 2033

Figure 62: Latin America Market Value (US$ Million) by Material, 2023 to 2033

Figure 63: Latin America Market Value (US$ Million) by Age Group, 2023 to 2033

Figure 64: Latin America Market Value (US$ Million) by Sales Channel, 2023 to 2033

Figure 65: Latin America Market Value (US$ Million) by Country, 2023 to 2033

Figure 66: Latin America Market Value (US$ Million) Analysis by Country, 2018 to 2033

Figure 67: Latin America Market Volume (Units) Analysis by Country, 2018 to 2033

Figure 68: Latin America Market Value Share (%) and BPS Analysis by Country, 2023 to 2033

Figure 69: Latin America Market Y-o-Y Growth (%) Projections by Country, 2023 to 2033

Figure 70: Latin America Market Value (US$ Million) Analysis by Product Type, 2018 to 2033

Figure 71: Latin America Market Volume (Units) Analysis by Product Type, 2018 to 2033

Figure 72: Latin America Market Value Share (%) and BPS Analysis by Product Type, 2023 to 2033

Figure 73: Latin America Market Y-o-Y Growth (%) Projections by Product Type, 2023 to 2033

Figure 74: Latin America Market Value (US$ Million) Analysis by Material, 2018 to 2033

Figure 75: Latin America Market Volume (Units) Analysis by Material, 2018 to 2033

Figure 76: Latin America Market Value Share (%) and BPS Analysis by Material, 2023 to 2033

Figure 77: Latin America Market Y-o-Y Growth (%) Projections by Material, 2023 to 2033

Figure 78: Latin America Market Value (US$ Million) Analysis by Age Group, 2018 to 2033

Figure 79: Latin America Market Volume (Units) Analysis by Age Group, 2018 to 2033

Figure 80: Latin America Market Value Share (%) and BPS Analysis by Age Group, 2023 to 2033

Figure 81: Latin America Market Y-o-Y Growth (%) Projections by Age Group, 2023 to 2033

Figure 82: Latin America Market Value (US$ Million) Analysis by Sales Channel, 2018 to 2033

Figure 83: Latin America Market Volume (Units) Analysis by Sales Channel, 2018 to 2033

Figure 84: Latin America Market Value Share (%) and BPS Analysis by Sales Channel, 2023 to 2033

Figure 85: Latin America Market Y-o-Y Growth (%) Projections by Sales Channel, 2023 to 2033

Figure 86: Latin America Market Attractiveness by Product Type, 2023 to 2033

Figure 87: Latin America Market Attractiveness by Material, 2023 to 2033

Figure 88: Latin America Market Attractiveness by Age Group, 2023 to 2033

Figure 89: Latin America Market Attractiveness by Sales Channel, 2023 to 2033

Figure 90: Latin America Market Attractiveness by Country, 2023 to 2033

Figure 91: Europe Market Value (US$ Million) by Product Type, 2023 to 2033

Figure 92: Europe Market Value (US$ Million) by Material, 2023 to 2033

Figure 93: Europe Market Value (US$ Million) by Age Group, 2023 to 2033

Figure 94: Europe Market Value (US$ Million) by Sales Channel, 2023 to 2033

Figure 95: Europe Market Value (US$ Million) by Country, 2023 to 2033

Figure 96: Europe Market Value (US$ Million) Analysis by Country, 2018 to 2033

Figure 97: Europe Market Volume (Units) Analysis by Country, 2018 to 2033

Figure 98: Europe Market Value Share (%) and BPS Analysis by Country, 2023 to 2033

Figure 99: Europe Market Y-o-Y Growth (%) Projections by Country, 2023 to 2033

Figure 100: Europe Market Value (US$ Million) Analysis by Product Type, 2018 to 2033

Figure 101: Europe Market Volume (Units) Analysis by Product Type, 2018 to 2033

Figure 102: Europe Market Value Share (%) and BPS Analysis by Product Type, 2023 to 2033

Figure 103: Europe Market Y-o-Y Growth (%) Projections by Product Type, 2023 to 2033

Figure 104: Europe Market Value (US$ Million) Analysis by Material, 2018 to 2033

Figure 105: Europe Market Volume (Units) Analysis by Material, 2018 to 2033

Figure 106: Europe Market Value Share (%) and BPS Analysis by Material, 2023 to 2033

Figure 107: Europe Market Y-o-Y Growth (%) Projections by Material, 2023 to 2033

Figure 108: Europe Market Value (US$ Million) Analysis by Age Group, 2018 to 2033

Figure 109: Europe Market Volume (Units) Analysis by Age Group, 2018 to 2033

Figure 110: Europe Market Value Share (%) and BPS Analysis by Age Group, 2023 to 2033

Figure 111: Europe Market Y-o-Y Growth (%) Projections by Age Group, 2023 to 2033

Figure 112: Europe Market Value (US$ Million) Analysis by Sales Channel, 2018 to 2033

Figure 113: Europe Market Volume (Units) Analysis by Sales Channel, 2018 to 2033

Figure 114: Europe Market Value Share (%) and BPS Analysis by Sales Channel, 2023 to 2033

Figure 115: Europe Market Y-o-Y Growth (%) Projections by Sales Channel, 2023 to 2033

Figure 116: Europe Market Attractiveness by Product Type, 2023 to 2033

Figure 117: Europe Market Attractiveness by Material, 2023 to 2033

Figure 118: Europe Market Attractiveness by Age Group, 2023 to 2033

Figure 119: Europe Market Attractiveness by Sales Channel, 2023 to 2033

Figure 120: Europe Market Attractiveness by Country, 2023 to 2033

Figure 121: Asia Pacific Market Value (US$ Million) by Product Type, 2023 to 2033

Figure 122: Asia Pacific Market Value (US$ Million) by Material, 2023 to 2033

Figure 123: Asia Pacific Market Value (US$ Million) by Age Group, 2023 to 2033

Figure 124: Asia Pacific Market Value (US$ Million) by Sales Channel, 2023 to 2033

Figure 125: Asia Pacific Market Value (US$ Million) by Country, 2023 to 2033

Figure 126: Asia Pacific Market Value (US$ Million) Analysis by Country, 2018 to 2033

Figure 127: Asia Pacific Market Volume (Units) Analysis by Country, 2018 to 2033

Figure 128: Asia Pacific Market Value Share (%) and BPS Analysis by Country, 2023 to 2033

Figure 129: Asia Pacific Market Y-o-Y Growth (%) Projections by Country, 2023 to 2033

Figure 130: Asia Pacific Market Value (US$ Million) Analysis by Product Type, 2018 to 2033

Figure 131: Asia Pacific Market Volume (Units) Analysis by Product Type, 2018 to 2033

Figure 132: Asia Pacific Market Value Share (%) and BPS Analysis by Product Type, 2023 to 2033

Figure 133: Asia Pacific Market Y-o-Y Growth (%) Projections by Product Type, 2023 to 2033

Figure 134: Asia Pacific Market Value (US$ Million) Analysis by Material, 2018 to 2033

Figure 135: Asia Pacific Market Volume (Units) Analysis by Material, 2018 to 2033

Figure 136: Asia Pacific Market Value Share (%) and BPS Analysis by Material, 2023 to 2033

Figure 137: Asia Pacific Market Y-o-Y Growth (%) Projections by Material, 2023 to 2033

Figure 138: Asia Pacific Market Value (US$ Million) Analysis by Age Group, 2018 to 2033

Figure 139: Asia Pacific Market Volume (Units) Analysis by Age Group, 2018 to 2033

Figure 140: Asia Pacific Market Value Share (%) and BPS Analysis by Age Group, 2023 to 2033

Figure 141: Asia Pacific Market Y-o-Y Growth (%) Projections by Age Group, 2023 to 2033

Figure 142: Asia Pacific Market Value (US$ Million) Analysis by Sales Channel, 2018 to 2033

Figure 143: Asia Pacific Market Volume (Units) Analysis by Sales Channel, 2018 to 2033

Figure 144: Asia Pacific Market Value Share (%) and BPS Analysis by Sales Channel, 2023 to 2033

Figure 145: Asia Pacific Market Y-o-Y Growth (%) Projections by Sales Channel, 2023 to 2033

Figure 146: Asia Pacific Market Attractiveness by Product Type, 2023 to 2033

Figure 147: Asia Pacific Market Attractiveness by Material, 2023 to 2033

Figure 148: Asia Pacific Market Attractiveness by Age Group, 2023 to 2033

Figure 149: Asia Pacific Market Attractiveness by Sales Channel, 2023 to 2033

Figure 150: Asia Pacific Market Attractiveness by Country, 2023 to 2033

Figure 151: MEA Market Value (US$ Million) by Product Type, 2023 to 2033

Figure 152: MEA Market Value (US$ Million) by Material, 2023 to 2033

Figure 153: MEA Market Value (US$ Million) by Age Group, 2023 to 2033

Figure 154: MEA Market Value (US$ Million) by Sales Channel, 2023 to 2033

Figure 155: MEA Market Value (US$ Million) by Country, 2023 to 2033

Figure 156: MEA Market Value (US$ Million) Analysis by Country, 2018 to 2033

Figure 157: MEA Market Volume (Units) Analysis by Country, 2018 to 2033

Figure 158: MEA Market Value Share (%) and BPS Analysis by Country, 2023 to 2033

Figure 159: MEA Market Y-o-Y Growth (%) Projections by Country, 2023 to 2033

Figure 160: MEA Market Value (US$ Million) Analysis by Product Type, 2018 to 2033

Figure 161: MEA Market Volume (Units) Analysis by Product Type, 2018 to 2033

Figure 162: MEA Market Value Share (%) and BPS Analysis by Product Type, 2023 to 2033

Figure 163: MEA Market Y-o-Y Growth (%) Projections by Product Type, 2023 to 2033

Figure 164: MEA Market Value (US$ Million) Analysis by Material, 2018 to 2033

Figure 165: MEA Market Volume (Units) Analysis by Material, 2018 to 2033

Figure 166: MEA Market Value Share (%) and BPS Analysis by Material, 2023 to 2033

Figure 167: MEA Market Y-o-Y Growth (%) Projections by Material, 2023 to 2033

Figure 168: MEA Market Value (US$ Million) Analysis by Age Group, 2018 to 2033

Figure 169: MEA Market Volume (Units) Analysis by Age Group, 2018 to 2033

Figure 170: MEA Market Value Share (%) and BPS Analysis by Age Group, 2023 to 2033

Figure 171: MEA Market Y-o-Y Growth (%) Projections by Age Group, 2023 to 2033

Figure 172: MEA Market Value (US$ Million) Analysis by Sales Channel, 2018 to 2033

Figure 173: MEA Market Volume (Units) Analysis by Sales Channel, 2018 to 2033

Figure 174: MEA Market Value Share (%) and BPS Analysis by Sales Channel, 2023 to 2033

Figure 175: MEA Market Y-o-Y Growth (%) Projections by Sales Channel, 2023 to 2033

Figure 176: MEA Market Attractiveness by Product Type, 2023 to 2033

Figure 177: MEA Market Attractiveness by Material, 2023 to 2033

Figure 178: MEA Market Attractiveness by Age Group, 2023 to 2033

Figure 179: MEA Market Attractiveness by Sales Channel, 2023 to 2033

Figure 180: MEA Market Attractiveness by Country, 2023 to 2033

Frequently Asked Questions

What is the Traditional Toys and Games Market CAGR for 2033?

The traditional toys and games market CAGR 2033 is 3.6%.

What is the Current Traditional Toys and Games Market Size?

The market is estimated to secure a size of USD 97,601.8 million in 2023.

What is the Projected Size of the Market for 2033?

The projected value of the market for 2033 is USD 139,013 million.

How Key Players are Developing the Traditional Toys and Games Market?

Key players are developing the market by introducing innovative products.

Why is the Global Traditional Toys and Games Market Gaining Momentum?

Due to the increasing demand for educational and sustainable toys.

Explore Similar Insights

Future Market Insights

Traditional Toys and Games Market