Garcinia Cambogia Extract Market Size and Share Forecast Outlook 2025 to 2035

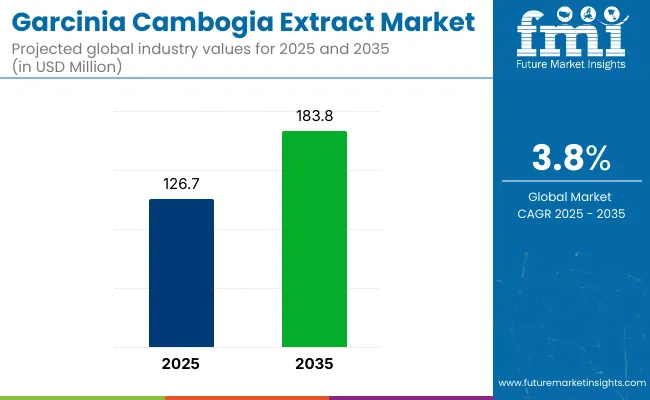
The garcinia cambogia extract is projected to grow from USD 126.7 million in 2025, and an outlook of USD 183.8 million has been projected for 2035 under a 3.8% CAGR during the forecast period.
Quick Stats of Garcinia Cambogia Extract Market

  • Market Value (2025): USD 126.7 million
  • Forecast Value (2035): USD 183.8 million
  • Forecast CAGR (2025 to 2035): 3.8%
  • Leading Segment in 2025: Capsules (64.3% share)
  • Key Growth Region: Asia Pacific (India is the fastest growing market with 5.8% CAGR)
  • Key Players: Power up health, Nature Wise, BioGanix, Naturabest, Top Secret Nutrition, NOW Foods, Global Health Ideas, Natrol, St.Botanica, Jiaherb, Inc., NutraValley Biotech, Inc.

Garcinia Cambogia Extract Market

The trajectory has been underpinned by steady ingredient adoption in weight-management formulations across North America, Europe, and emerging Asian nutraceutical hubs. Crossing the USD 100 million threshold three years ago established volume scale that now supports cost efficiencies in extraction and purification.

Currency-adjusted exports continued to trend upward despite sporadic shipping bottlenecks, while online specialist retailers bolstered unit throughput with targeted promotions during peak dieting seasons. Profitability has been maintained through portfolio premiumisation and disciplined control of hydroxycitric-acid potency specifications.

The industry accounts for 3.1% of the functional food ingredients market, 2.6% of the dietary supplements market, and 4.4% within botanical extracts, owing to its widespread use as a natural appetite suppressant. In the weight management ingredients segment, its share reaches around 6.7%, driven by high HCA content promoting fat metabolism. Within the broader nutraceuticals market, it holds a modest 1.9% share due to the vast ingredient diversity in that category.

Its concentration is strongest where botanical extracts intersect with slimming supplements. Demand for stimulant-free weight control, clean-label formulations, and tropical-source ingredients has elevated its position among botanicals, though competition from berberine, CLA, and green tea extract continues to moderate its advance beyond niche supplement channels.

The principal demand driver has been the global prevalence of obesity and metabolic-syndrome comorbidities, which has triggered proactive weight-control behaviour among adults aged twenty-five to fifty-four. In that demographic, over-the-counter nutraceuticals based on plant derivatives have been preferred over stimulant-centric thermogenics.

Clinical evidence indicating that hydroxycitric acid may inhibit ATP-citrate lyase has been circulated broadly in fitness podcasts and practitioner webinars, cultivating trust. Parallel to health motivations, the extract has been perceived as a natural adjunct to intermittent-fasting and ketogenic protocols. Regulatory scrutiny has been intensifying; however, compliance has been managed through third-party testing and dossier submission to authorities such as the United States Food and Drug Administration and the European Food Safety Authority, turning quality assurance into a branding asset.

Analyzing Garcinia Cambogia Extract Market by Top Investment Segments

Capsule delivery is preferred for products owing to dosage accuracy, long shelf life, and user familiarity that suit both e-commerce and pharmacy outlets. Online stores are favored as the chief distribution route, with global reach, extensive SKU visibility, influencer promotion, and rapid listing agility boosting consumer trust and repeat purchases. These choices reveal a clear alignment with portable supplementation formats and digitally driven retail behavior.

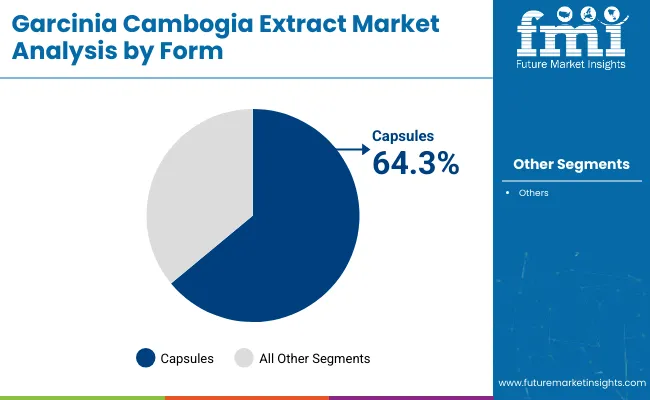
Capsules Is Expected to dominate the Form with an 64.3% Share

Capsules dominate the garcinia cambogia extract market, accounting for an estimated 64.3% share in 2025. This form offers convenient dosage control, extended shelf stability, and compatibility with standardized hydroxycitric acid concentrations, which are critical for regulatory compliance and consumer trust.
  • Capsule-based delivery has also been favored by supplement brands aiming to market clean-label, non-GMO, and vegan-certified products, particularly in Western retail formats.
  • Portability and familiarity among users accustomed to pill formats further reinforce its dominance in both e-commerce and pharmacy-led channels.
  • Unlike liquids or powders, capsules require no mixing or measuring, making them ideal for on-the-go consumers and first-time users.

Garcinia Cambogia Extract Market Analysis By Form

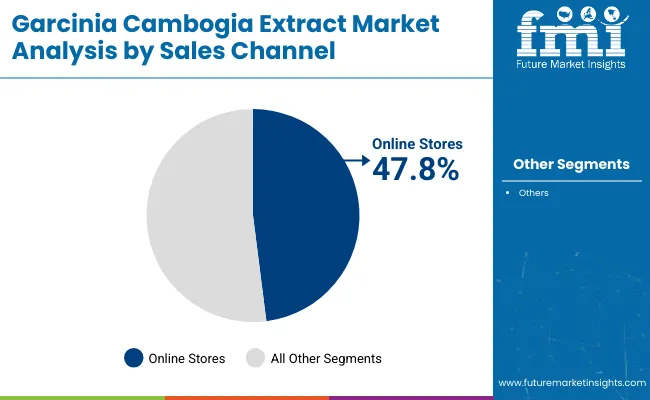
By Sales Channel, Online Stores Accounts for Over 47.8% Share

Online stores are expected to lead sales of garcinia cambogia extract in 2025, capturing nearly 47.8% of total revenue in 2025.
  • E-commerce platforms have provided global access, brand variety, and ease of product comparison, which have boosted consumer confidence in direct purchases.
  • The dominance of Amazon, iHerb, and company-owned online portals has facilitated frequent promotions, subscription models, and influencer-driven marketing, accelerating adoption across millennial and Gen Z demographics.
  • Search engine visibility and consumer reviews play a major role in brand discovery, making digital platforms a preferred route for supplement launches. Regulatory leniency in online listings compared to retail shelf placement also allows faster time-to-market for reformulations and trending ingredient blends, further reinforcing e-commerce's leadership in channel share.

Garcinia Cambogia Extract Market Analysis By Sales Channel

Top Garcinia Cambogia Extract Market Dynamics

Rising obesity rates and demand for botanical, non-stimulant solutions are driving long-term adoption of products. Online retail growth and stricter regulations are reshaping sales channels and manufacturing practices.

Weight Management Demand and Botanical Preference Drive Adoption

Growth has been largely driven by lifestyle-related health concerns, particularly the rising incidence of obesity and metabolic disorders. The preference for stimulant-free botanical supplements has elevated garcinia cambogia extract as a favored option in weight management protocols. Consumers are actively seeking non-synthetic solutions that align with label transparency and digestive comfort. Its compatibility with ketogenic and intermittent fasting routines has further widened the appeal.

  • Rising obesity and weight-control demand sustain long-term intake
  • Preference for botanical, non-stimulant ingredients encourages repeat use
  • Integration with trending diet patterns expands consumer base

E-Commerce Expansion and Evolving Regulatory Landscape

The shift toward online retail and evolving e-commerce dynamics continues to redefine sales performance. Market accessibility has been amplified through third-party platforms, while social media and health influencers enhance brand reach. Growing regulatory scrutiny is pushing manufacturers toward third-party testing, ingredient standardization, and GMP-certified operations, driving consumer trust but raising compliance costs.
  • Digital platforms increase visibility and lower geographic barriers
  • Influencer marketing reshapes consumer engagement and trial rates
  • Regulatory tightening enforces quality controls and shifts market entry strategy

Analysis of Top Countries Exporting and Supplying Garcinia Cambogia Extract Globally

Country Wise Analysis Of Garcinia Cambogia Extract Market

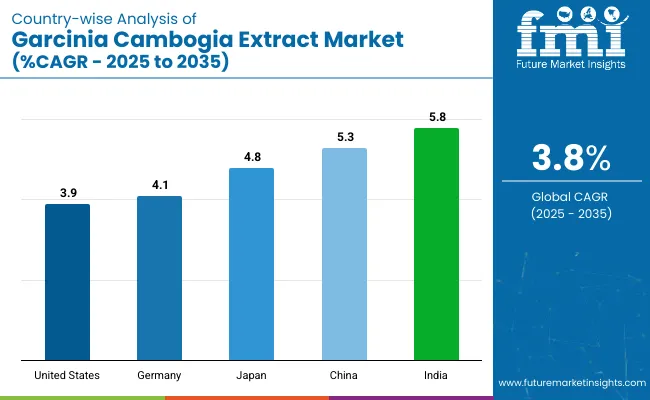
Countries CAGR (2025 to 2035)
United States 3.9%
Germany 4.1%
Japan 4.8%
China 5.3%
India 5.8%

The garcinia cambogia extract industry, projected to expand at a global CAGR of 3.8% from 2025 to 2035, presents varied growth trajectories across key nations. India, a BRICS member, is advancing at a 5.8% CAGR, driven by increased use of Ayurvedic positioning and sachet-format supplements across e-pharmacy and modern retail.

China, also part of the BRICS group, is registering a 5.3% CAGR as social-commerce livestreaming pushes cross-border sales of high-HCA capsules and powders. Japan, an OECD country, shows a 4.8% CAGR with ready-to-drink formats benefiting from FOSHU-backed approvals in midlife dietary management.

Germany, another OECD member, is expected to see a 4.1% CAGR as clean-label botanical formats are promoted in pharmacy-linked wellness programs. The United States, also in the OECD group, follows with a 3.9% CAGR, supported by regulated, GMP-certified capsules available through high-traffic e-commerce portals. While OECD markets maintain regulated growth with quality controls, BRICS economies are scaling faster on the back of retail digitization and herbal acceptance.

The report includes insights across 40+ countries, with the above five markets serving as core reference points.

Demand Outlook for Garcinia Cambogia Extract in the United States

The USA garcinia cambogia extract market is expected to grow at 3.9% CAGR during the forecast period. Rising prevalence of overweight adults, now topping 70% of the population, has been prompting physicians and fitness coaches to recommend non-stimulant botanical aids over caffeine-heavy thermogenics. Capsules standardized to 60% hydroxycitric acid (HCA) have been granted wide shelf presence because cGMP-audited plants in Utah, California, and New Jersey supply retailers with consistent potency certificates.

Subscription bundles on Amazon and iHerb have been incentivizing repeat orders through tiered pricing, while coupon-driven loyalty programs push higher unit throughput. Privacy-minded consumers prefer discreet doorstep delivery, reinforcing the channel’s hold on nearly half of national revenue.

Marketing claims must pass Federal Trade Commission scrutiny, yet brands use peer-reviewed citations to defend efficacy, fostering credibility among dietitians. Companion stacks that combine garcinia cambogia with CLA or apple-cider-vinegar gummies are being featured in influencer videos, driving incremental trial without breaching dosage caps under FDA dietary-supplement regulations.

  • Growing obesity prevalence drives physician-guided usage
  • cGMP supply chain maintains label accuracy and trust
  • Subscription e-commerce secures predictable reorder volumes

Opportunity Analysis of Garcinia Cambogia Extract in Germany

The German garcinia cambogia extract market is estimated to grow at 4.1% CAGR from 2025 to 2035. Germany’s statutory health insurers permit partial reimbursement for weight-management counseling, and pharmacists routinely position botanical supplements beside glucomannan and glucomate tablets. Demand has been shaped by consumer insistence on TÜV-certified raw-material testing, encouraging importers to secure certified organic fruit from Kerala and Sri Lanka.

Brick-and-click pharmacy chains such as DocMorris and Shop-Apotheke showcase HCA titration data, aligning with rigorous Bundesinstitut für Arzneimittel und Medizinprodukte (BfArM) labeling guidance. Low-sugar lifestyle shifts have sparked companionship between garcinia cambogia and keto-friendly snack lines in drugstores.

Marketing is being conducted in passive-voice educational formats on compliance-approved social media channels, avoiding overstated claims. Public health agencies highlight plant-derived options to reduce reliance on synthetic appetite suppressants, reinforcing demand while keeping daily doses within the 1,500 mg advisory ceiling established by the Federal Institute for Risk Assessment.

  • TÜV and organic seals reassure ingredient safety
  • Pharmacy e-tailers merge clinical content with quick delivery
  • Keto snack pairings expand cross-merchandising prospects

Sales Analysis of Garcinia Cambogia Extract in China

The Chinese garcinia cambogia extract market is projected to grow at 5.3% CAGR during the forecast period. Social-commerce livestreams on Douyin and Kuaishou are amplifying cross-border sales of garcinia cambogia capsules formulated in the United States and Australia, with bonded-warehouse logistics shortening delivery windows to forty-eight hours in Tier-1 cities. Domestic producers in Hunan and Guangxi have upgraded spray-drying lines to meet ISO 22000 audits demanded by leading pharmacy app JD Health, securing “Blue-Hat” registration for single-ingredient HCA products.

Rising disposable spending among young professionals has accelerated trial, yet compliance with State Administration for Market Regulation rules requires non-therapeutic language, funneling brands toward peer-reviewed efficacy citations. Companion blends featuring berberine and green-tea polyphenols are marketed during “618” and “Singles’ Day” events, capitalizing on discount-driven buying frenzies. Offline, Watsons and Ole’ boutiques curate sachet powders that dissolve into bottled water-an appealing format for office workers following portion-controlled meal plans.

  • Livestream promotions ignite real-time bulk ordering
  • Blue-Hat certification ensures lawful functional claims
  • Bonded-warehouse delivery trims cross-border lead times

Demand Analysis for Garcinia Cambogia Extract in Japan

The Japanese garcinia cambogia extract market is anticipated to grow at 4.8% between 2025 and 2035. Functional Food for Specified Health Use (FOSHU) approvals have permitted limited-dose garcinia cambogia inclusion in ready-to-drink beverages and jelly pouches, admired by a middle-aged demographic seeking mild satiety aids. Domestic contract manufacturers in Shizuoka prefecture deliver microencapsulated HCA that withstands thermal filling, enabling shelf-stable convenience-store offerings.

Retailers promote weight-control gummies in “beauty and health” aisles alongside collagen peptides, leveraging QR-coded traceability that links consumers to batch-test certificates. Drugstores such as Matsumoto Kiyoshi rely on pharmacist guidance to recommend daily HCA intake below 2,000 mg, easing safety concerns. Smartphone apps tracking calorie deficits integrate coupon links to endorsed brands, encouraging repeat purchase. Cultural focus on incremental, sustainable shape management, rather than crash dieting, encourages steady demand that aligns with long-term demographic health objectives.

  • FOSHU status legitimizes on-the-go beverage fortification
  • QR traceability boosts confidence in purity and dosage
  • Calorie-tracking apps channel shoppers toward recommended SKUs

In-depth Analysis of Garcinia Cambogia Extract Market in India

The Indian garcinia cambogia extract market is valued at a 5.8% CAGR during the forecast period. Ayurvedic positioning resonates strongly, with garcinia cambogia (Kokum) referenced in classical texts, allowing manufacturers to market herbal legitimacy without prescription hurdles. Domestic extraction hubs in Kerala benefit from abundant fruit availability and low labor costs, supporting sachet and tablet formats priced below INR 10 for rural chemists.

Digital-first pharmacy portals such as PharmEasy bundle garcinia cambogia with diabetes-control packs, tapping into rising metabolic-syndrome awareness. The Food Safety and Standards Authority of India is rolling out nutraceutical labeling norms that mandate disclosure of plant part used, prompting brands to showcase rind-only sourcing for higher HCA yields.

  • Ayurvedic heritage grants cultural acceptance and trust
  • Low-cost sachets widen reach in price-sensitive segments
  • FSSAI labeling norms push suppliers toward higher-quality standards

Leading Garcinia Cambogia Extract Suppliers

The garcinia cambogia extract industry is driven by a blend of legacy nutraceutical brands and emerging players focused on clean-label formulations, standardized HCA potency, and diversified supplement delivery formats. Key companies like Power up Health, Nature Wise, and BioGanix lead with high-potency capsules aimed at weight-conscious consumers across North America and Europe.

Naturabest and Top Secret Nutrition target active-lifestyle users through blended botanical stacks. NOW Foods and Natrol, both GMP-certified, maintain a presence in pharmacy and online channels with verified quality. St.Botanica and NutraValley Biotech, Inc. drive India-based expansion through Ayurvedic branding and e-commerce bundling. Jiaherb, Inc. and Global Health Ideas support ingredient supply and private-label manufacturing, reinforcing B2B integration across global distribution hubs.

Recent Garcinia Cambogia Extract Industry News

Nature Wise has focused on multi-channel marketing and high street retail partnerships to promote its Garcinia Cambogia supplements as weight management solutions. In 2024 and 2025, the company strengthened its presence in specialty health and wellness stores and expanded its online sales channels, capitalizing on the growing preference for plant-based and natural supplement

Leading Players

  • Power up health
  • Nature wise
  • BioGanix
  • Naturabest
  • Top Secret Nutrition
  • NOW Foods
  • Global Health Ideas
  • Natrol
  • St.Botanica
  • Jiaherb, Inc.
  • NutraValley Biotech, Inc.

Report Coverage and Scope Summary

Report Attributes Details
Market Size (2025) USD 126.7 million
Projected Market Size (2035) USD 183.8 million
CAGR (2025 to 2035) 3.8%
Base Year for Estimation 2024
Historical Period 2020 to 2024
Projections Period 2025 to 2035
Quantitative Units USD million for value and volume in metric tons
Form Analyzed (Segment 1) Capsules, Liquid, and Powder.
Sales Channel Analyzed (Segment 2) Supermarkets/Hypermarkets, Convenience Stores, Medical Stores, and Online Stores.
Regions Covered North America, Europe, Asia Pacific, Middle East & Africa, Latin America
Countries Covered United States, Canada, Germany, United Kingdom, France, Italy, Spain, China, Japan, South Korea, India, Australia, Brazil, Mexico, Argentina, Saudi Arabia, UAE, South Africa
Key Players Power up health, Nature Wise, BioGanix, Naturabest, Top Secret Nutrition, NOW Foods, Global Health Ideas, Natrol, St.Botanica, Jiaherb, Inc., NutraValley Biotech, Inc.
Additional Attributes Dollar sales, share by form and channel, regional demand patterns, competitor pricing, HCA concentration trends, regulatory shifts, and future growth forecasts.

Key Garcinia Cambogia Extract Market Segmentation

By Form:

The industry is segmented into capsules, liquid, and powder.

By Sales Channel:

The industry is segmented into supermarkets/hypermarkets, convenience stores, medical stores, and online stores.

By Region:

The industry covers regions including North America, Europe, Asia Pacific, Latin America, and the Middle East & Africa.

Table of Content

  1. Executive Summary
    • Global Market Outlook
    • Demand-side Trends
    • Supply-side Trends
    • Technology Roadmap Analysis
    • Analysis and Recommendations
  2. Market Overview
    • Market Coverage / Taxonomy
    • Market Definition / Scope / Limitations
  3. Market Background
    • Market Dynamics
      • Drivers
      • Restraints
      • Opportunity
      • Trends
    • Scenario Forecast
      • Demand in Optimistic Scenario
      • Demand in Likely Scenario
      • Demand in Conservative Scenario
    • Opportunity Map Analysis
    • Product Life Cycle Analysis
    • Supply Chain Analysis
      • Supply Side Participants and their Roles
        • Producers
        • Mid-Level Participants (Traders/ Agents/ Brokers)
        • Wholesalers and Distributors
      • Value Added and Value Created at Node in the Supply Chain
      • List of Raw Material Suppliers
      • List of Existing and Potential Buyer’s
    • Investment Feasibility Matrix
    • Value Chain Analysis
      • Profit Margin Analysis
      • Wholesalers and Distributors
      • Retailers
    • PESTLE and Porter’s Analysis
    • Regulatory Landscape
      • By Key Regions
      • By Key Countries
    • Regional Parent Market Outlook
    • Production and Consumption Statistics
    • Import and Export Statistics
  4. Global Market Analysis 2020 to 2024 and Forecast, 2025 to 2035
    • Historical Market Size Value (USD Million) & Volume (Metric tons) Analysis, 2020 to 2024
    • Current and Future Market Size Value (USD Million) & Volume (Metric tons) Projections, 2025 to 2035
      • Y-o-Y Growth Trend Analysis
      • Absolute $ Opportunity Analysis
  5. Global Market Pricing Analysis 2020 to 2024 and Forecast 2025 to 2035
  6. Global Market Analysis 2020 to 2024 and Forecast 2025 to 2035, By Form
    • Introduction / Key Findings
    • Historical Market Size Value (USD Million) & Volume (Metric tons) Analysis By Form, 2020 to 2024
    • Current and Future Market Size Value (USD Million) & Volume (Metric tons) Analysis and Forecast By Form, 2025 to 2035
      • Capsule
      • Liquid
      • Powder
    • Y-o-Y Growth Trend Analysis By Form, 2020 to 2024
    • Absolute $ Opportunity Analysis By Form, 2025 to 2035
  7. Global Market Analysis 2020 to 2024 and Forecast 2025 to 2035, By Sales Channel
    • Introduction / Key Findings
    • Historical Market Size Value (USD Million) & Volume (Metric tons) Analysis By Sales Channel, 2020 to 2024
    • Current and Future Market Size Value (USD Million) & Volume (Metric tons) Analysis and Forecast By Sales Channel, 2025 to 2035
      • Supermarkets/Hypermarkets
      • Convenience Stores
      • Medical Stores
      • Online Stores
    • Y-o-Y Growth Trend Analysis By Sales Channel, 2020 to 2024
    • Absolute $ Opportunity Analysis By Sales Channel, 2025 to 2035
  8. Global Market Analysis 2020 to 2024 and Forecast 2025 to 2035, By Region
    • Introduction
    • Historical Market Size Value (USD Million) & Volume (Metric tons) Analysis By Region, 2020 to 2024
    • Current Market Size Value (USD Million) & Volume (Metric tons) Analysis and Forecast By Region, 2025 to 2035
      • North America
      • Latin America
      • Western Europe
      • Eastern Europe
      • East Asia
      • South Asia & Pacific
      • Middle East and Africa
    • Market Attractiveness Analysis By Region
  9. North America Market Analysis 2020 to 2024 and Forecast 2025 to 2035, By Country
    • Historical Market Size Value (USD Million) & Volume (Metric tons) Trend Analysis By Market Taxonomy, 2020 to 2024
    • Market Size Value (USD Million) & Volume (Metric tons) Forecast By Market Taxonomy, 2025 to 2035
      • By Country
        • USA
        • Canada
        • Mexico
      • By Form
      • By Sales Channel
    • Market Attractiveness Analysis
      • By Country
      • By Form
      • By Sales Channel
    • Key Takeaways
  10. Latin America Market Analysis 2020 to 2024 and Forecast 2025 to 2035, By Country
    • Historical Market Size Value (USD Million) & Volume (Metric tons) Trend Analysis By Market Taxonomy, 2020 to 2024
    • Market Size Value (USD Million) & Volume (Metric tons) Forecast By Market Taxonomy, 2025 to 2035
      • By Country
        • Brazil
        • Argentina
        • Rest of LATAM
      • By Form
      • By Sales Channel
    • Market Attractiveness Analysis
      • By Country
      • By Form
      • By Sales Channel
    • Key Takeaways
  11. Western Europe Market Analysis 2020 to 2024 and Forecast 2025 to 2035, By Country
    • Historical Market Size Value (USD Million) & Volume (Metric tons) Trend Analysis By Market Taxonomy, 2020 to 2024
    • Market Size Value (USD Million) & Volume (Metric tons) Forecast By Market Taxonomy, 2025 to 2035
      • By Country
        • Germany
        • Italy
        • France
        • UK
        • Spain
        • BENELUX
        • Nordic
        • Rest of W.Europe
      • By Form
      • By Sales Channel
    • Market Attractiveness Analysis
      • By Country
      • By Form
      • By Sales Channel
    • Key Takeaways
  12. Eastern Europe Market Analysis 2020 to 2024 and Forecast 2025 to 2035, By Country
    • Historical Market Size Value (USD Million) & Volume (Metric tons) Trend Analysis By Market Taxonomy, 2020 to 2024
    • Market Size Value (USD Million) & Volume (Metric tons) Forecast By Market Taxonomy, 2025 to 2035
      • By Country
        • Russia
        • Hungary
        • Poland
        • Balkan & Baltics
        • Rest of E. Europe
      • By Form
      • By Sales Channel
    • Market Attractiveness Analysis
      • By Country
      • By Form
      • By Sales Channel
    • Key Takeaways
  13. East Asia Market Analysis 2020 to 2024 and Forecast 2025 to 2035, By Country
    • Historical Market Size Value (USD Million) & Volume (Metric tons) Trend Analysis By Market Taxonomy, 2020 to 2024
    • Market Size Value (USD Million) & Volume (Metric tons) Forecast By Market Taxonomy, 2025 to 2035
      • By Country
        • China
        • Japan
        • South Korea
      • By Form
      • By Sales Channel
    • Market Attractiveness Analysis
      • By Country
      • By Form
      • By Sales Channel
    • Key Takeaways
  14. South Asia & Pacific Market Analysis 2020 to 2024 and Forecast 2025 to 2035, By Country
    • Historical Market Size Value (USD Million) & Volume (Metric tons) Trend Analysis By Market Taxonomy, 2020 to 2024
    • Market Size Value (USD Million) & Volume (Metric tons) Forecast By Market Taxonomy, 2025 to 2035
      • By Country
        • India
        • Australia & New Zealand
        • ASEAN
        • Rest of SAP
      • By Form
      • By Sales Channel
    • Market Attractiveness Analysis
      • By Country
      • By Form
      • By Sales Channel
    • Key Takeaways
  15. Middle East and Africa Market Analysis 2020 to 2024 and Forecast 2025 to 2035, By Country
    • Historical Market Size Value (USD Million) & Volume (Metric tons) Trend Analysis By Market Taxonomy, 2020 to 2024
    • Market Size Value (USD Million) & Volume (Metric tons) Forecast By Market Taxonomy, 2025 to 2035
      • By Country
        • GCC Countries
        • Northern Africa
        • South Africa
        • Turkiye
        • Rest of MEA
      • By Form
      • By Sales Channel
    • Market Attractiveness Analysis
      • By Country
      • By Form
      • By Sales Channel
    • Key Takeaways
  16. Key Countries Market Analysis
    • USA
      • Pricing Analysis
      • Market Share Analysis, 2024
        • By Form
        • By Sales Channel
    • Canada
      • Pricing Analysis
      • Market Share Analysis, 2024
        • By Form
        • By Sales Channel
    • Brazil
      • Pricing Analysis
      • Market Share Analysis, 2024
        • By Form
        • By Sales Channel
    • Mexico
      • Pricing Analysis
      • Market Share Analysis, 2024
        • By Form
        • By Sales Channel
    • Argentina
      • Pricing Analysis
      • Market Share Analysis, 2024
        • By Form
        • By Sales Channel
  17. Market Structure Analysis
    • Competition Dashboard
    • Competition Benchmarking
    • Market Share Analysis of Top Players
      • By Regional
      • By Form
      • By Sales Channel
  18. Competition Analysis
    • Competition Deep Dive
      • Power up health
        • Overview
        • Product Portfolio
        • Profitability by Market Segments (Product/Age /Sales Channel/Region)
        • Sales Footprint
        • Strategy Overview
          • Marketing Strategy
          • Product Strategy
          • Channel Strategy
      • Nature wise
        • Overview
        • Product Portfolio
        • Profitability by Market Segments (Product/Age /Sales Channel/Region)
        • Sales Footprint
        • Strategy Overview
          • Marketing Strategy
          • Product Strategy
          • Channel Strategy
      • BioGanix
        • Overview
        • Product Portfolio
        • Profitability by Market Segments (Product/Age /Sales Channel/Region)
        • Sales Footprint
        • Strategy Overview
          • Marketing Strategy
          • Product Strategy
          • Channel Strategy
      • Naturabest
        • Overview
        • Product Portfolio
        • Profitability by Market Segments (Product/Age /Sales Channel/Region)
        • Sales Footprint
        • Strategy Overview
          • Marketing Strategy
          • Product Strategy
          • Channel Strategy
      • Top Secret Nutrition
        • Overview
        • Product Portfolio
        • Profitability by Market Segments (Product/Age /Sales Channel/Region)
        • Sales Footprint
        • Strategy Overview
          • Marketing Strategy
          • Product Strategy
          • Channel Strategy
      • NOW Foods
        • Overview
        • Product Portfolio
        • Profitability by Market Segments (Product/Age /Sales Channel/Region)
        • Sales Footprint
        • Strategy Overview
          • Marketing Strategy
          • Product Strategy
          • Channel Strategy
      • Global Health Ideas
        • Overview
        • Product Portfolio
        • Profitability by Market Segments (Product/Age /Sales Channel/Region)
        • Sales Footprint
        • Strategy Overview
          • Marketing Strategy
          • Product Strategy
          • Channel Strategy
      • Natrol
        • Overview
        • Product Portfolio
        • Profitability by Market Segments (Product/Age /Sales Channel/Region)
        • Sales Footprint
        • Strategy Overview
          • Marketing Strategy
          • Product Strategy
          • Channel Strategy
      • St.Botanica
        • Overview
        • Product Portfolio
        • Profitability by Market Segments (Product/Age /Sales Channel/Region)
        • Sales Footprint
        • Strategy Overview
          • Marketing Strategy
          • Product Strategy
          • Channel Strategy
      • Jiaherb, Inc.
        • Overview
        • Product Portfolio
        • Profitability by Market Segments (Product/Age /Sales Channel/Region)
        • Sales Footprint
        • Strategy Overview
          • Marketing Strategy
          • Product Strategy
          • Channel Strategy
      • NutraValley Biotech, Inc.
        • Overview
        • Product Portfolio
        • Profitability by Market Segments (Product/Age /Sales Channel/Region)
        • Sales Footprint
        • Strategy Overview
          • Marketing Strategy
          • Product Strategy
          • Channel Strategy
  19. Assumptions & Acronyms Used
  20. Research Methodology

List of Tables

  • Table 1: Global Market Value (USD Million) Forecast by Region, 2020 to 2035
  • Table 2: Global Market Volume (Metric tons) Forecast by Region, 2020 to 2035
  • Table 3: Global Market Value (USD Million) Forecast by Form, 2020 to 2035
  • Table 4: Global Market Volume (Metric tons) Forecast by Form, 2020 to 2035
  • Table 5: Global Market Value (USD Million) Forecast by Sales Channel, 2020 to 2035
  • Table 6: Global Market Volume (Metric tons) Forecast by Sales Channel, 2020 to 2035
  • Table 7: North America Market Value (USD Million) Forecast by Country, 2020 to 2035
  • Table 8: North America Market Volume (Metric tons) Forecast by Country, 2020 to 2035
  • Table 9: North America Market Value (USD Million) Forecast by Form, 2020 to 2035
  • Table 10: North America Market Volume (Metric tons) Forecast by Form, 2020 to 2035
  • Table 11: North America Market Value (USD Million) Forecast by Sales Channel, 2020 to 2035
  • Table 12: North America Market Volume (Metric tons) Forecast by Sales Channel, 2020 to 2035
  • Table 13: Latin America Market Value (USD Million) Forecast by Country, 2020 to 2035
  • Table 14: Latin America Market Volume (Metric tons) Forecast by Country, 2020 to 2035
  • Table 15: Latin America Market Value (USD Million) Forecast by Form, 2020 to 2035
  • Table 16: Latin America Market Volume (Metric tons) Forecast by Form, 2020 to 2035
  • Table 17: Latin America Market Value (USD Million) Forecast by Sales Channel, 2020 to 2035
  • Table 18: Latin America Market Volume (Metric tons) Forecast by Sales Channel, 2020 to 2035
  • Table 19: Western Europe Market Value (USD Million) Forecast by Country, 2020 to 2035
  • Table 20: Western Europe Market Volume (Metric tons) Forecast by Country, 2020 to 2035
  • Table 21: Western Europe Market Value (USD Million) Forecast by Form, 2020 to 2035
  • Table 22: Western Europe Market Volume (Metric tons) Forecast by Form, 2020 to 2035
  • Table 23: Western Europe Market Value (USD Million) Forecast by Sales Channel, 2020 to 2035
  • Table 24: Western Europe Market Volume (Metric tons) Forecast by Sales Channel, 2020 to 2035
  • Table 25: Eastern Europe Market Value (USD Million) Forecast by Country, 2020 to 2035
  • Table 26: Eastern Europe Market Volume (Metric tons) Forecast by Country, 2020 to 2035
  • Table 27: Eastern Europe Market Value (USD Million) Forecast by Form, 2020 to 2035
  • Table 28: Eastern Europe Market Volume (Metric tons) Forecast by Form, 2020 to 2035
  • Table 29: Eastern Europe Market Value (USD Million) Forecast by Sales Channel, 2020 to 2035
  • Table 30: Eastern Europe Market Volume (Metric tons) Forecast by Sales Channel, 2020 to 2035
  • Table 31: East Asia Market Value (USD Million) Forecast by Country, 2020 to 2035
  • Table 32: East Asia Market Volume (Metric tons) Forecast by Country, 2020 to 2035
  • Table 33: East Asia Market Value (USD Million) Forecast by Form, 2020 to 2035
  • Table 34: East Asia Market Volume (Metric tons) Forecast by Form, 2020 to 2035
  • Table 35: East Asia Market Value (USD Million) Forecast by Sales Channel, 2020 to 2035
  • Table 36: East Asia Market Volume (Metric tons) Forecast by Sales Channel, 2020 to 2035
  • Table 37: South Asia & Pacific Market Value (USD Million) Forecast by Country, 2020 to 2035
  • Table 38: South Asia & Pacific Market Volume (Metric tons) Forecast by Country, 2020 to 2035
  • Table 39: South Asia & Pacific Market Value (USD Million) Forecast by Form, 2020 to 2035
  • Table 40: South Asia & Pacific Market Volume (Metric tons) Forecast by Form, 2020 to 2035
  • Table 41: South Asia & Pacific Market Value (USD Million) Forecast by Sales Channel, 2020 to 2035
  • Table 42: South Asia & Pacific Market Volume (Metric tons) Forecast by Sales Channel, 2020 to 2035
  • Table 43: Middle East and Africa Market Value (USD Million) Forecast by Country, 2020 to 2035
  • Table 44: Middle East and Africa Market Volume (Metric tons) Forecast by Country, 2020 to 2035
  • Table 45: Middle East and Africa Market Value (USD Million) Forecast by Form, 2020 to 2035
  • Table 46: Middle East and Africa Market Volume (Metric tons) Forecast by Form, 2020 to 2035
  • Table 47: Middle East and Africa Market Value (USD Million) Forecast by Sales Channel, 2020 to 2035
  • Table 48: Middle East and Africa Market Volume (Metric tons) Forecast by Sales Channel, 2020 to 2035

List of Figures

  • Figure 1: Global Market Volume (Metric tons) Forecast 2020 to 2035
  • Figure 2: Global Market Pricing Analysis
  • Figure 3: Global Market Value (USD Million) Forecast 2020 to 2035
  • Figure 4: Global Market Value Share and BPS Analysis by Form, 2025 and 2035
  • Figure 5: Global Market Y-o-Y Growth Comparison by Form, 2025 to 2035
  • Figure 6: Global Market Attractiveness Analysis by Form
  • Figure 7: Global Market Value Share and BPS Analysis by Sales Channel, 2025 and 2035
  • Figure 8: Global Market Y-o-Y Growth Comparison by Sales Channel, 2025 to 2035
  • Figure 9: Global Market Attractiveness Analysis by Sales Channel
  • Figure 10: Global Market Value (USD Million) Share and BPS Analysis by Region, 2025 and 2035
  • Figure 11: Global Market Y-o-Y Growth Comparison by Region, 2025 to 2035
  • Figure 12: Global Market Attractiveness Analysis by Region
  • Figure 13: North America Market Incremental $ Opportunity, 2025 to 2035
  • Figure 14: Latin America Market Incremental $ Opportunity, 2025 to 2035
  • Figure 15: Western Europe Market Incremental $ Opportunity, 2025 to 2035
  • Figure 16: Eastern Europe Market Incremental $ Opportunity, 2025 to 2035
  • Figure 17: East Asia Market Incremental $ Opportunity, 2025 to 2035
  • Figure 18: South Asia & Pacific Market Incremental $ Opportunity, 2025 to 2035
  • Figure 19: Middle East and Africa Market Incremental $ Opportunity, 2025 to 2035
  • Figure 20: North America Market Value Share and BPS Analysis by Country, 2025 and 2035
  • Figure 21: North America Market Value Share and BPS Analysis by Form, 2025 and 2035
  • Figure 22: North America Market Y-o-Y Growth Comparison by Form, 2025 to 2035
  • Figure 23: North America Market Attractiveness Analysis by Form
  • Figure 24: North America Market Value Share and BPS Analysis by Sales Channel, 2025 and 2035
  • Figure 25: North America Market Y-o-Y Growth Comparison by Sales Channel, 2025 to 2035
  • Figure 26: North America Market Attractiveness Analysis by Sales Channel
  • Figure 27: Latin America Market Value Share and BPS Analysis by Country, 2025 and 2035
  • Figure 28: Latin America Market Value Share and BPS Analysis by Form, 2025 and 2035
  • Figure 29: Latin America Market Y-o-Y Growth Comparison by Form, 2025 to 2035
  • Figure 30: Latin America Market Attractiveness Analysis by Form
  • Figure 31: Latin America Market Value Share and BPS Analysis by Sales Channel, 2025 and 2035
  • Figure 32: Latin America Market Y-o-Y Growth Comparison by Sales Channel, 2025 to 2035
  • Figure 33: Latin America Market Attractiveness Analysis by Sales Channel
  • Figure 34: Western Europe Market Value Share and BPS Analysis by Country, 2025 and 2035
  • Figure 35: Western Europe Market Value Share and BPS Analysis by Form, 2025 and 2035
  • Figure 36: Western Europe Market Y-o-Y Growth Comparison by Form, 2025 to 2035
  • Figure 37: Western Europe Market Attractiveness Analysis by Form
  • Figure 38: Western Europe Market Value Share and BPS Analysis by Sales Channel, 2025 and 2035
  • Figure 39: Western Europe Market Y-o-Y Growth Comparison by Sales Channel, 2025 to 2035
  • Figure 40: Western Europe Market Attractiveness Analysis by Sales Channel
  • Figure 41: Eastern Europe Market Value Share and BPS Analysis by Country, 2025 and 2035
  • Figure 42: Eastern Europe Market Value Share and BPS Analysis by Form, 2025 and 2035
  • Figure 43: Eastern Europe Market Y-o-Y Growth Comparison by Form, 2025 to 2035
  • Figure 44: Eastern Europe Market Attractiveness Analysis by Form
  • Figure 45: Eastern Europe Market Value Share and BPS Analysis by Sales Channel, 2025 and 2035
  • Figure 46: Eastern Europe Market Y-o-Y Growth Comparison by Sales Channel, 2025 to 2035
  • Figure 47: Eastern Europe Market Attractiveness Analysis by Sales Channel
  • Figure 48: East Asia Market Value Share and BPS Analysis by Country, 2025 and 2035
  • Figure 49: East Asia Market Value Share and BPS Analysis by Form, 2025 and 2035
  • Figure 50: East Asia Market Y-o-Y Growth Comparison by Form, 2025 to 2035
  • Figure 51: East Asia Market Attractiveness Analysis by Form
  • Figure 52: East Asia Market Value Share and BPS Analysis by Sales Channel, 2025 and 2035
  • Figure 53: East Asia Market Y-o-Y Growth Comparison by Sales Channel, 2025 to 2035
  • Figure 54: East Asia Market Attractiveness Analysis by Sales Channel
  • Figure 55: South Asia & Pacific Market Value Share and BPS Analysis by Country, 2025 and 2035
  • Figure 56: South Asia & Pacific Market Value Share and BPS Analysis by Form, 2025 and 2035
  • Figure 57: South Asia & Pacific Market Y-o-Y Growth Comparison by Form, 2025 to 2035
  • Figure 58: South Asia & Pacific Market Attractiveness Analysis by Form
  • Figure 59: South Asia & Pacific Market Value Share and BPS Analysis by Sales Channel, 2025 and 2035
  • Figure 60: South Asia & Pacific Market Y-o-Y Growth Comparison by Sales Channel, 2025 to 2035
  • Figure 61: South Asia & Pacific Market Attractiveness Analysis by Sales Channel
  • Figure 62: Middle East and Africa Market Value Share and BPS Analysis by Country, 2025 and 2035
  • Figure 63: Middle East and Africa Market Value Share and BPS Analysis by Form, 2025 and 2035
  • Figure 64: Middle East and Africa Market Y-o-Y Growth Comparison by Form, 2025 to 2035
  • Figure 65: Middle East and Africa Market Attractiveness Analysis by Form
  • Figure 66: Middle East and Africa Market Value Share and BPS Analysis by Sales Channel, 2025 and 2035
  • Figure 67: Middle East and Africa Market Y-o-Y Growth Comparison by Sales Channel, 2025 to 2035
  • Figure 68: Middle East and Africa Market Attractiveness Analysis by Sales Channel
  • Figure 69: Global Market - Tier Structure Analysis
  • Figure 70: Global Market - Company Share Analysis

Frequently Asked Questions

What is the estimated market size of the garcinia cambogia extract industry in 2025?

The industry is valued at USD 126.7 million in 2025.

What is the projected industry size of the garcinia cambogia extract industry by 2035?

It is forecasted to reach USD 183.8 million by 2035.

What is the expected CAGR for the garcinia cambogia extract industry between 2025 and 2035?

The industry is anticipated to grow at a CAGR of 3.8% during this period.

Which segment is expected to lead the garcinia cambogia extract market in 2025?

Capsules are projected to lead the market with a 64.3% share in 2025.

Which region is expected to witness the highest growth in the garcinia cambogia extract market?

Asia Pacific, particularly India, is expected to be the key growth region with a projected growth rate of 5.8%.

Explore Similar Insights

Future Market Insights

Garcinia Cambogia Extract Market