Glutamic Acid Market Size and Share Forecast Outlook 2025 to 2035

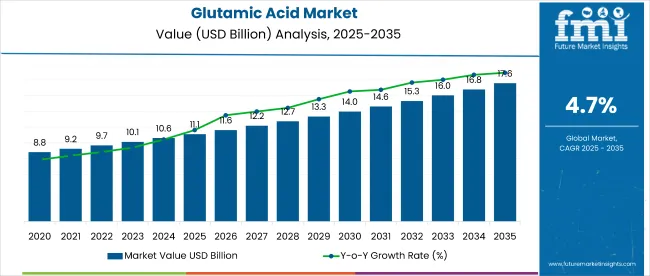
The global glutamic acid market is valued at USD 11.1 billion in 2025 and is expected to reach USD 17.6 billion by 2035, registering a CAGR of 4.7%. Market expansion is driven by increased demand across food and pharmaceutical applications, supported by rising consumer awareness toward nutritional and functional ingredients.
Quick Stats for Glutamic Acid Market

  • Market Value (2025): USD 11.1 billion
  • Forecast Value (2035): USD 17.6 billion
  • Forecast CAGR: 4.7%
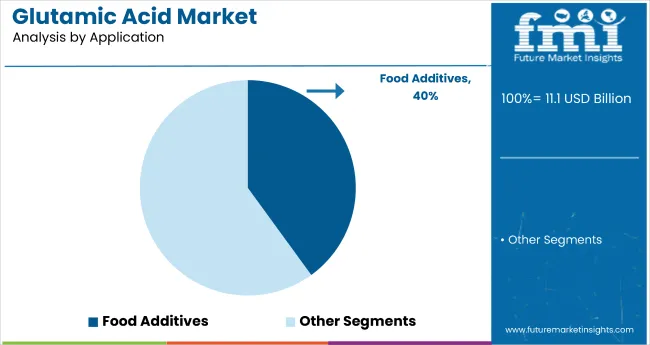
  • Application Leader in 2025: Food Additives (40% Market Share)
  • Key Growth Region: East Asia (Japan is the fastest-growing market with 5.6% CAGR)

Glutamic Acid Market

Metric Value
Market Size(2025) USD 11.1 billion
Market Size(2035) USD 17.6 billion
CAGR (2025 to 2035) 4.7%

Additionally, the proliferation of processed and convenience food products is boosting the need for flavor-enhancing compounds such as glutamic acid in food formulations.

The market holds 12% of the global amino acids market, driven by its role as a key proteinogenic amino acid. Within the functional food ingredients market, it contributes around 8%, owing to its use as a flavor enhancer. In the food additives market, glutamic acid represents nearly 10% of the total value. It holds a smaller 6% share in the pharmaceutical ingredients market and around 7% in animal feed additives, reflecting its broad yet specialized utility across these sectors.

Government regulations impacting the market focus onagencies like the USA FDA, EFSA in Europe, and FSSAI in India enforce strict guidelines to ensure the safe use of glutamic acid as an additive and active ingredient. These rules focus on product safety, labeling transparency, and usage limits.

Increasing concerns over synthetic additives and demand for clean-label products have led to tighter compliance norms. Consequently, manufacturers are shifting toward natural, fermentation-based production methods to align with regulatory requirements and evolving consumer preferences.

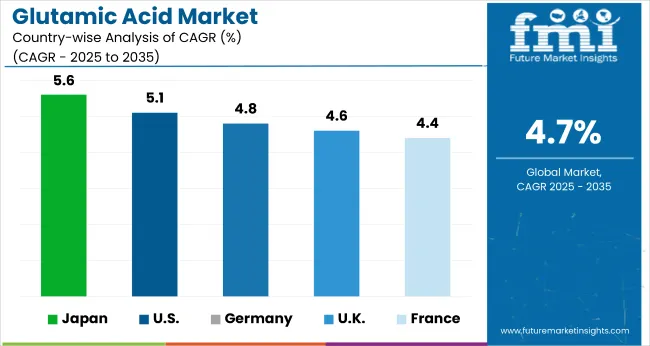
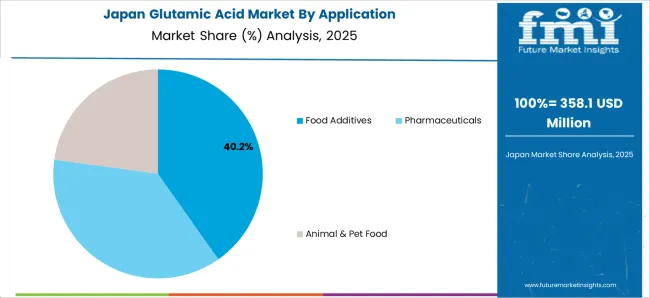
The Japan is projected to be the fastest-growing marketat a CAGR of 5.6% from 2025 to 2035, driven by strong demand for processed foods and pharmaceutical-grade amino acids. Food additives will continue to dominate the application segment, accounting for 40% of total demand. Germany is projected to grow at a CAGR of 4.8% from 2025 to 2035.

Analyzing Glutamic Acid Market by Top Investment Segments

The glutamic acid market is segmented into application and region. By application, the market is segmented into food additives, pharmaceuticals, and animal & pet food. Regionally, the market is classified into North America, Latin America, Europe, Asia Pacific, and the Middle East & Africa (MEA).
Food Additives Lead with the Application Segment with 40% Market Share in 2025

Glutamic Acid Market Analysis By Application

Food additives are projected to lead the application segment with 40% of the market share in 2025. This dominance is driven by the widespread use of glutamic acid as a flavor enhancer in processed foods, rising demand for convenience foods, and increasing consumer preference for umami-rich products across global markets.

  • Glutamic acid is extensively used in its salt form (monosodium glutamate or MSG) to enhance the umami flavor in a wide variety of processed foods, soups, snacks, canned vegetables, and frozen meals.
  • With increasing urbanization and fast-paced lifestyles, demand for ready-to-eat and packaged food has surged, particularly in Asia and North America, boosting glutamic acid consumption.
  • As consumers become more health-conscious, the demand for low-fat and low-sodium foods with enhanced flavor profiles is rising. Glutamic acid helps maintain taste while reducing other additives, making it attractive for food manufacturers.
  • Manufacturers are leveraging naturally fermented glutamic acid to align with clean-label product trends, especially in Europe and North America, ensuring compliance with strict regulatory frameworks.

Top Glutamic Acid Market Dynamics

The market is growing steadily, driven by rising demand for natural flavor enhancers, increasing application in processed and functional foods, and expanding use in pharmaceutical formulations for neurological and metabolic health.

Additionally, growing consumer awareness about clean-label products and the shift towards sustainable production methods are further fueling market growth. Technological advancements in fermentation processes are also enabling manufacturers to improve product quality and reduce costs, boosting adoption across various industries.

Recent Trends in the Glutamic Acid Market

  • Growing adoption of fermentation-based glutamic acid production to meet clean-label standards.
  • Rising incorporation of glutamic acid in plant-based and functional food formulations.
  • Increasing R&D investments in pharmaceutical applications for neurological disorders.
  • Expanding use in animal feed as a performance enhancer and gut health booster.

Key Challenges in the Glutamic Acid Market
  • Health concerns over excessive glutamic acid intake and MSG sensitivity.
  • Regulatory scrutiny over labeling and permissible usage limits in food products.
  • Price volatility of raw materials is impacting production margins.
  • Limited consumer awareness in emerging markets about glutamic acid benefits.

Analyzing Top Countries Producing and Supplying Glutamic Acid

Country Wise Analysis Of Glutamic Acid Market

Japan leads the market, driven by advancements in biotechnology and rising demand for functional foods. The USA follows with a CAGR of 5.1%, supported by its developed pharmaceutical and food sectors. Germany is expected to grow at 4.8%, while the UK and France will see moderate growth at 4.6% and 4.4% respectively. The growth rates reflect varying levels of regulatory influence, innovation capacity, and consumer demand for clean-label and fortified food products.

The report covers an in-depth analysis of 40+ countries; with the five top-performing OECD nations highlighted below. 
Analysis of Glutamic Acid in the USA

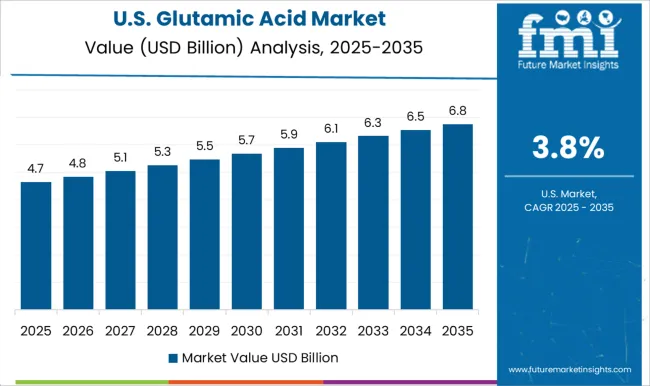
The USA glutamic acid products revenue is projected to grow at a CAGR of 5.1% from 2025 to 2035. Growth is being driven by the country’s highly developed food processing and pharmaceutical industries. Demand for natural amino acids continues to rise amid clean-label trends and the growing popularity of functional and fortified food products.

  • Rising demand for processed and packaged foods with enhanced flavor.
  • Increasing use of glutamic acid in neurological disorder treatments.
  • Expansion of the dietary supplement market is boosting amino acid usage.
  • Strong presence of leading players like Ajinomoto and Evonik.
  • High consumer preference for non-GMO and fermentation-based ingredients.

In-depth Analysis of Glutamic Acid in the UK

The sales of glutamic acid products in the UK are anticipated to expand at a CAGR of 4.6% from 2025 to 2035. Growth is driven by strict regulations around food additives and growing preference for clean-label products. Glutamic acid is increasingly used in dairy products, savory snacks, and nutraceutical formulations across the country.
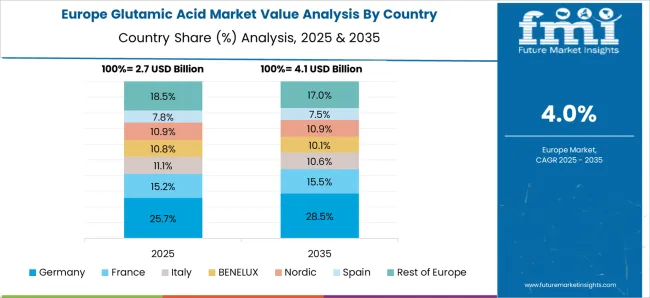
  • Regulatory pressure is encouraging the use of natural flavor enhancers.
  • Growing demand for functional and fortified food products.
  • Rising health consciousness is influencing consumer purchasing behavior.
  • Local production and imports support market availability

Growth Outlook for Glutamic Acid in Germany

The glutamic acid product demand in Germany is projected to grow at a CAGR of 4.8% from 2025 to 2035. The country’s robust pharmaceutical sector and food manufacturing base are fueling demand for glutamic acid. Strict safety and quality standards support the adoption of naturally derived additives.

  • High demand for amino acids in medical formulations and nutrition.
  • Extensive use in vegan and plant-based food products.
  • Rising production of flavor-enhanced packaged foods.
  • Government support for bio-based ingredient development.

Demand Trajectory of Glutamic Acid in France

The French glutamic acid revenue is expected to grow at a CAGR of 4.4% over the forecast period. The country’s culinary heritage and high consumption of dairy and savory products contribute to steady glutamic acid demand. Pharmaceutical usage is also on the rise due to increasing neurological health awareness.
  • Elevated use of glutamic acid in cheese and ready meals.
  • Increasing focus on reducing artificial additives.
  • Expanding pharmaceutical R&D pipeline utilizing amino acids.
  • Clean-label trends influencing manufacturer formulation choices.

Glutamic Acid Trends in Japan

The glutamic acid market in Japan is projected to grow at a CAGR of 5.6% from 2025 to 2035. Growth is driven by strong domestic demand for glutamic acid across both traditional cuisine and modern packaged foods. The country also leads in biotechnological innovation and pharmaceutical usage.
  • Cultural acceptance and long-standing use of MSG in cooking.
  • Expanding application in functional foods and beverages.
  • The rising elderly population is increasing pharmaceutical demand.
  • Emphasis on fermentation and sustainability in amino acid sourcing.

Leading Glutamic Acid Manufacturers and Suppliers

Glutamic Acid Market Analysis By Company

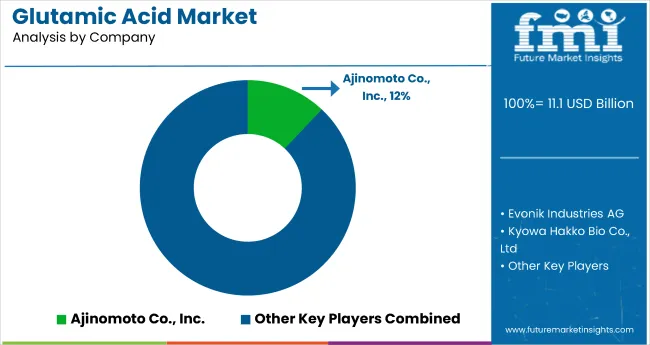
The glutamic acid market is moderately competitive, with several global and regional players actively competing based on price, innovation, production scale, and strategic collaborations. Leading suppliers such as Ajinomoto Co., Inc., Evonik Industries AG, and Kyowa Hakko Bio Co., Ltd dominate the high-purity and pharmaceutical-grade segments, while other players cater to regional demand with cost-effective, food-grade alternatives.

Top companies are focusing on expanding fermentation-based production, improving product purity, and securing strategic partnerships to penetrate emerging markets. Innovation in clean-label and bio-based production processes has become a major focus, especially in Europe and North America, where regulatory compliance is strict.

Ajinomoto continues to lead in research on amino acid functionality, while Evonik leverages its biotechnology division to scale amino acid production for animal and human nutrition. Companies like Iris Biotech and Bachem AG are expanding their portfolios in pharmaceutical amino acids, catering to rising therapeutic demands.

Meanwhile, consolidation is underway as large players seek to strengthen their positions by acquiring or partnering with niche biotech firms. China-based companies such as Ningxia EPPEN Bioengineering are investing in large-scale production and export capabilities, while European players focus on compliance, traceability, and premium-quality ingredients. The drive for sustainability and traceability in ingredient sourcing is influencing new investments and operational decisions globally.

Recent Glutamic Acid Industry News

  • In March 2024, Pearl Bio announced a strategic partnership with Merck (MSD). This collaboration aims to leverage synthetic biology to discover and develop innovative biological therapies that incorporate non-standard amino acids. The agreement covers territories outside the USA and Canada.

Glutamic Acid Market Report Scope

Report Attributes Details
Current Total Market Size (2025) USD 11.1 billion
Projected Market Size (2035) USD 17.6 billion
CAGR (2025 to 2035) 4.7%
Base Year for Estimation 2024
Historical Period 2020 to 2024
Projections Period 2025 to 2035
Report Parameters Revenue in USD billions/Volume in Metric Tons
By Application Food Additives, Pharmaceuticals, and Animal & Pet Food
Regions Covered North America, Latin America, Europe, Asia Pacific, and MEA (Middle East & Africa)
Countries Covered United States, Canada, United Kingdom, Germany, France, China, Japan, South Korea, Brazil, Australia, and 40+ countries
Key Players Bio-chem Technology Group Company, Bachem AG, Ningxia EPPEN Bioengineering Stock Co., Ltd, Kyowa Hakko Bio Co., Ltd, Sichuan Tongsheng Amino Acid Co., Ltd, Iris Biotech GmbH, Suzhou Yuanfang Chemical Co., Ltd., Ajinomoto Co., Inc., Akzo Nobel N.V., Evonik Industries AG.
Additional Attributes Dollar sales by product type, share by functionality, regional demand growth, regulatory influence, clean-label trends, competitive benchmarking

Key Segmentation

By Application:

  • Food additives
  • Pharmaceuticals
  • Animal & Pet Food

By Region:

  • North America
  • Latin America
  • Europe
  • Asia Pacific
  • Middle East & Africa

Table of Content

  1. Executive Summary
    • Global Market Outlook
    • Demand-side Trends
    • Supply-side Trends
    • Technology Roadmap Analysis
    • Analysis and Recommendations
  2. Market Overview
    • Market Coverage/Taxonomy
    • Market Definition/Scope/Limitations
  3. Market Background
    • Market Dynamics
      • Drivers
      • Restraints
      • Opportunity
      • Trends
    • Scenario Forecast
      • Demand in Optimistic Scenario
      • Demand in Likely Scenario
      • Demand in Conservative Scenario
    • Opportunity Map Analysis
    • Product Life Cycle Analysis
    • Supply Chain Analysis
      • Supply Side Participants and their Roles
        • Producers
        • Mid-Level Participants (Traders/ Agents/ Brokers)
        • Wholesalers and Distributors
      • Value Added and Value Created at Node in the Supply Chain
      • List of Raw Material Suppliers
      • List of Existing and Potential Buyer’s
    • Investment Feasibility Matrix
    • Value Chain Analysis
      • Profit Margin Analysis
      • Wholesalers and Distributors
      • Retailers
    • PESTLE and Porter’s Analysis
    • Regulatory Landscape
      • By Key Regions
      • By Key Countries
    • Regional Parent Market Outlook
    • Production and Consumption Statistics
    • Import and Export Statistics
  4. Global Market Analysis 2020 to 2024 and Forecast, 2025 to 2035
    • Historical Market Size Value (USD Million) & Volume (Metric Tons) Analysis, 2020 to 2024
    • Current and Future Market Size Value (USD Million) & Volume (Metric Tons) Projections, 2025 to 2035
      • Y-o-Y Growth Trend Analysis
      • Absolute $ Opportunity Analysis
  5. Global Market Pricing Analysis 2020 to 2024 and Forecast 2025 to 2035
  6. Global Market Analysis 2020 to 2024 and Forecast 2025 to 2035, By Application
    • Introduction/Key Findings
    • Historical Market Size Value (USD Million) & Volume (Metric Tons) Analysis By Application, 2020 to 2024
    • Current and Future Market Size Value (USD Million) & Volume (Metric Tons) Analysis and Forecast By Application, 2025 to 2035
      • Food additives
      • Pharmaceuticals
      • Animal & Pet Food
    • Y-o-Y Growth Trend Analysis By Application, 2020 to 2024
    • Absolute $ Opportunity Analysis By Application, 2025 to 2035
  7. Global Market Analysis 2020 to 2024 and Forecast 2025 to 2035, By Region
    • Introduction
    • Historical Market Size Value (USD Million) & Volume (Metric Tons) Analysis By Region, 2020 to 2024
    • Current Market Size Value (USD Million) & Volume (Metric Tons) Analysis and Forecast By Region, 2025 to 2035
      • North America
      • Latin America
      • Western Europe
      • Eastern Europe
      • East Asia
      • South Asia & Pacific
      • Middle East and Africa
    • Market Attractiveness Analysis By Region
  8. North America Market Analysis 2020 to 2024 and Forecast 2025 to 2035, By Country
    • Historical Market Size Value (USD Million) & Volume (Metric Tons) Trend Analysis By Market Taxonomy, 2020 to 2024
    • Market Size Value (USD Million) & Volume (Metric Tons) Forecast By Market Taxonomy, 2025 to 2035
      • By Country
        • USA
        • Canada
        • Mexico
      • By Application
    • Market Attractiveness Analysis
      • By Country
      • By Application
    • Key Takeaways
  9. Latin America Market Analysis 2020 to 2024 and Forecast 2025 to 2035, By Country
    • Historical Market Size Value (USD Million) & Volume (Metric Tons) Trend Analysis By Market Taxonomy, 2020 to 2024
    • Market Size Value (USD Million) & Volume (Metric Tons) Forecast By Market Taxonomy, 2025 to 2035
      • By Country
        • Brazil
        • Argentina
        • Rest of LATAM
      • By Application
    • Market Attractiveness Analysis
      • By Country
      • By Application
    • Key Takeaways
  10. Western Europe Market Analysis 2020 to 2024 and Forecast 2025 to 2035, By Country
    • Historical Market Size Value (USD Million) & Volume (Metric Tons) Trend Analysis By Market Taxonomy, 2020 to 2024
    • Market Size Value (USD Million) & Volume (Metric Tons) Forecast By Market Taxonomy, 2025 to 2035
      • By Country
        • Germany
        • Italy
        • France
        • UK
        • Spain
        • BENELUX
        • Nordic
        • Rest of W.Europe
      • By Application
    • Market Attractiveness Analysis
      • By Country
      • By Application
    • Key Takeaways
  11. Eastern Europe Market Analysis 2020 to 2024 and Forecast 2025 to 2035, By Country
    • Historical Market Size Value (USD Million) & Volume (Metric Tons) Trend Analysis By Market Taxonomy, 2020 to 2024
    • Market Size Value (USD Million) & Volume (Metric Tons) Forecast By Market Taxonomy, 2025 to 2035
      • By Country
        • Russia
        • Hungary
        • Poland
        • Balkan & Baltics
        • Rest of E. Europe
      • By Application
    • Market Attractiveness Analysis
      • By Country
      • By Application
    • Key Takeaways
  12. East Asia Market Analysis 2020 to 2024 and Forecast 2025 to 2035, By Country
    • Historical Market Size Value (USD Million) & Volume (Metric Tons) Trend Analysis By Market Taxonomy, 2020 to 2024
    • Market Size Value (USD Million) & Volume (Metric Tons) Forecast By Market Taxonomy, 2025 to 2035
      • By Country
        • China
        • Japan
        • South Korea
      • By Application
    • Market Attractiveness Analysis
      • By Country
      • By Application
    • Key Takeaways
  13. South Asia & Pacific Market Analysis 2020 to 2024 and Forecast 2025 to 2035, By Country
    • Historical Market Size Value (USD Million) & Volume (Metric Tons) Trend Analysis By Market Taxonomy, 2020 to 2024
    • Market Size Value (USD Million) & Volume (Metric Tons) Forecast By Market Taxonomy, 2025 to 2035
      • By Country
        • India
        • Australia & New Zealand
        • ASEAN
        • Rest of SAP
      • By Application
    • Market Attractiveness Analysis
      • By Country
      • By Application
    • Key Takeaways
  14. Middle East and Africa Market Analysis 2020 to 2024 and Forecast 2025 to 2035, By Country
    • Historical Market Size Value (USD Million) & Volume (Metric Tons) Trend Analysis By Market Taxonomy, 2020 to 2024
    • Market Size Value (USD Million) & Volume (Metric Tons) Forecast By Market Taxonomy, 2025 to 2035
      • By Country
        • GCC Countries
        • Northern Africa
        • South Africa
        • Turkiye
        • Rest of MEA
      • By Application
    • Market Attractiveness Analysis
      • By Country
      • By Application
    • Key Takeaways
  15. Key Countries Market Analysis
    • USA
      • Pricing Analysis
      • Market Share Analysis, 2024
        • By Application
    • Canada
      • Pricing Analysis
      • Market Share Analysis, 2024
        • By Application
    • Brazil
      • Pricing Analysis
      • Market Share Analysis, 2024
        • By Application
    • Mexico
      • Pricing Analysis
      • Market Share Analysis, 2024
        • By Application
    • Argentina
      • Pricing Analysis
      • Market Share Analysis, 2024
        • By Application
  16. Market Structure Analysis
    • Competition Dashboard
    • Competition Benchmarking
    • Market Share Analysis of Top Players
      • By Regional
      • By Application
  17. Competition Analysis
    • Competition Deep Dive
      • Bio-chem Technology Group Company
        • Overview
        • Product Portfolio
        • Profitability by Market Segments (Product/Age /Sales Channel/Region)
        • Sales Footprint
        • Strategy Overview
          • Marketing Strategy
          • Product Strategy
          • Channel Strategy
      • Bachem AG
        • Overview
        • Product Portfolio
        • Profitability by Market Segments (Product/Age /Sales Channel/Region)
        • Sales Footprint
        • Strategy Overview
          • Marketing Strategy
          • Product Strategy
          • Channel Strategy
      • Ningxia EPPEN Bioengineering Stock Co., Ltd
        • Overview
        • Product Portfolio
        • Profitability by Market Segments (Product/Age /Sales Channel/Region)
        • Sales Footprint
        • Strategy Overview
          • Marketing Strategy
          • Product Strategy
          • Channel Strategy
      • Kyowa Hakko Bio Co., Ltd
        • Overview
        • Product Portfolio
        • Profitability by Market Segments (Product/Age /Sales Channel/Region)
        • Sales Footprint
        • Strategy Overview
          • Marketing Strategy
          • Product Strategy
          • Channel Strategy
      • Sichuan Tongsheng Amino Acid Co., Ltd
        • Overview
        • Product Portfolio
        • Profitability by Market Segments (Product/Age /Sales Channel/Region)
        • Sales Footprint
        • Strategy Overview
          • Marketing Strategy
          • Product Strategy
          • Channel Strategy
      • Iris Biotech GmbH
        • Overview
        • Product Portfolio
        • Profitability by Market Segments (Product/Age /Sales Channel/Region)
        • Sales Footprint
        • Strategy Overview
          • Marketing Strategy
          • Product Strategy
          • Channel Strategy
      • Suzhou Yuanfang Chemical Co. Ltd.
        • Overview
        • Product Portfolio
        • Profitability by Market Segments (Product/Age /Sales Channel/Region)
        • Sales Footprint
        • Strategy Overview
          • Marketing Strategy
          • Product Strategy
          • Channel Strategy
      • Ajinomoto Co., Inc.
        • Overview
        • Product Portfolio
        • Profitability by Market Segments (Product/Age /Sales Channel/Region)
        • Sales Footprint
        • Strategy Overview
          • Marketing Strategy
          • Product Strategy
          • Channel Strategy
      • Akzo Nobel N.V.
        • Overview
        • Product Portfolio
        • Profitability by Market Segments (Product/Age /Sales Channel/Region)
        • Sales Footprint
        • Strategy Overview
          • Marketing Strategy
          • Product Strategy
          • Channel Strategy
      • Evonik Industries AG
        • Overview
        • Product Portfolio
        • Profitability by Market Segments (Product/Age /Sales Channel/Region)
        • Sales Footprint
        • Strategy Overview
          • Marketing Strategy
          • Product Strategy
          • Channel Strategy
  18. Assumptions & Acronyms Used
  19. Research Methodology

List of Tables

  • Table 1: Global Market Value (USD Billion) Forecast by Region, 2020-2035
  • Table 2: Global Market Volume (Metric Tons) Forecast by Region, 2020-2035
  • Table 3: Global Market Value (USD Billion) Forecast by Application, 2020-2035
  • Table 4: Global Market Volume (Metric Tons) Forecast by Application, 2020-2035
  • Table 5: North America Market Value (USD Billion) Forecast by Country, 2020-2035
  • Table 6: North America Market Volume (Metric Tons) Forecast by Country, 2020-2035
  • Table 7: North America Market Value (USD Billion) Forecast by Application, 2020-2035
  • Table 8: North America Market Volume (Metric Tons) Forecast by Application, 2020-2035
  • Table 9: Latin America Market Value (USD Billion) Forecast by Country, 2020-2035
  • Table 10: Latin America Market Volume (Metric Tons) Forecast by Country, 2020-2035
  • Table 11: Latin America Market Value (USD Billion) Forecast by Application, 2020-2035
  • Table 12: Latin America Market Volume (Metric Tons) Forecast by Application, 2020-2035
  • Table 13: Western Europe Market Value (USD Billion) Forecast by Country, 2020-2035
  • Table 14: Western Europe Market Volume (Metric Tons) Forecast by Country, 2020-2035
  • Table 15: Western Europe Market Value (USD Billion) Forecast by Application, 2020-2035
  • Table 16: Western Europe Market Volume (Metric Tons) Forecast by Application, 2020-2035
  • Table 17: Eastern Europe Market Value (USD Billion) Forecast by Country, 2020-2035
  • Table 18: Eastern Europe Market Volume (Metric Tons) Forecast by Country, 2020-2035
  • Table 19: Eastern Europe Market Value (USD Billion) Forecast by Application, 2020-2035
  • Table 20: Eastern Europe Market Volume (Metric Tons) Forecast by Application, 2020-2035
  • Table 21: East Asia Market Value (USD Billion) Forecast by Country, 2020-2035
  • Table 22: East Asia Market Volume (Metric Tons) Forecast by Country, 2020-2035
  • Table 23: East Asia Market Value (USD Billion) Forecast by Application, 2020-2035
  • Table 24: East Asia Market Volume (Metric Tons) Forecast by Application, 2020-2035
  • Table 25: South Asia & Pacific Market Value (USD Billion) Forecast by Country, 2020-2035
  • Table 26: South Asia & Pacific Market Volume (Metric Tons) Forecast by Country, 2020-2035
  • Table 27: South Asia & Pacific Market Value (USD Billion) Forecast by Application, 2020-2035
  • Table 28: South Asia & Pacific Market Volume (Metric Tons) Forecast by Application, 2020-2035
  • Table 29: Middle East and Africa Market Value (USD Billion) Forecast by Country, 2020-2035
  • Table 30: Middle East and Africa Market Volume (Metric Tons) Forecast by Country, 2020-2035
  • Table 31: Middle East and Africa Market Value (USD Billion) Forecast by Application, 2020-2035
  • Table 32: Middle East and Africa Market Volume (Metric Tons) Forecast by Application, 2020-2035

List of Figures

  • Figure 1: Global Market Volume (Metric Tons) Forecast 2020-2035
  • Figure 2: Global Market Pricing Analysis
  • Figure 3: Global Market Value (USD Billion) Forecast 2020-2035
  • Figure 4: Global Market Value Share and BPS Analysis by Application, 2025 and 2035
  • Figure 5: Global Market Y-o-Y Growth Comparison by Application, 2025-2035
  • Figure 6: Global Market Attractiveness Analysis by Application
  • Figure 7: Global Market Value (USD Billion) Share and BPS Analysis by Region, 2025 and 2035
  • Figure 8: Global Market Y-o-Y Growth Comparison by Region, 2025-2035
  • Figure 9: Global Market Attractiveness Analysis by Region
  • Figure 10: North America Market Incremental $ Opportunity, 2025-2035
  • Figure 11: Latin America Market Incremental $ Opportunity, 2025-2035
  • Figure 12: Western Europe Market Incremental $ Opportunity, 2025-2035
  • Figure 13: Eastern Europe Market Incremental $ Opportunity, 2025-2035
  • Figure 14: East Asia Market Incremental $ Opportunity, 2025-2035
  • Figure 15: South Asia & Pacific Market Incremental $ Opportunity, 2025-2035
  • Figure 16: Middle East and Africa Market Incremental $ Opportunity, 2025-2035
  • Figure 17: North America Market Value Share and BPS Analysis by Country, 2025 and 2035
  • Figure 18: North America Market Value Share and BPS Analysis by Application, 2025 and 2035
  • Figure 19: North America Market Y-o-Y Growth Comparison by Application, 2025-2035
  • Figure 20: North America Market Attractiveness Analysis by Application
  • Figure 21: Latin America Market Value Share and BPS Analysis by Country, 2025 and 2035
  • Figure 22: Latin America Market Value Share and BPS Analysis by Application, 2025 and 2035
  • Figure 23: Latin America Market Y-o-Y Growth Comparison by Application, 2025-2035
  • Figure 24: Latin America Market Attractiveness Analysis by Application
  • Figure 25: Western Europe Market Value Share and BPS Analysis by Country, 2025 and 2035
  • Figure 26: Western Europe Market Value Share and BPS Analysis by Application, 2025 and 2035
  • Figure 27: Western Europe Market Y-o-Y Growth Comparison by Application, 2025-2035
  • Figure 28: Western Europe Market Attractiveness Analysis by Application
  • Figure 29: Eastern Europe Market Value Share and BPS Analysis by Country, 2025 and 2035
  • Figure 30: Eastern Europe Market Value Share and BPS Analysis by Application, 2025 and 2035
  • Figure 31: Eastern Europe Market Y-o-Y Growth Comparison by Application, 2025-2035
  • Figure 32: Eastern Europe Market Attractiveness Analysis by Application
  • Figure 33: East Asia Market Value Share and BPS Analysis by Country, 2025 and 2035
  • Figure 34: East Asia Market Value Share and BPS Analysis by Application, 2025 and 2035
  • Figure 35: East Asia Market Y-o-Y Growth Comparison by Application, 2025-2035
  • Figure 36: East Asia Market Attractiveness Analysis by Application
  • Figure 37: South Asia & Pacific Market Value Share and BPS Analysis by Country, 2025 and 2035
  • Figure 38: South Asia & Pacific Market Value Share and BPS Analysis by Application, 2025 and 2035
  • Figure 39: South Asia & Pacific Market Y-o-Y Growth Comparison by Application, 2025-2035
  • Figure 40: South Asia & Pacific Market Attractiveness Analysis by Application
  • Figure 41: Middle East and Africa Market Value Share and BPS Analysis by Country, 2025 and 2035
  • Figure 42: Middle East and Africa Market Value Share and BPS Analysis by Application, 2025 and 2035
  • Figure 43: Middle East and Africa Market Y-o-Y Growth Comparison by Application, 2025-2035
  • Figure 44: Middle East and Africa Market Attractiveness Analysis by Application
  • Figure 45: Global Market - Tier Structure Analysis
  • Figure 46: Global Market - Company Share Analysis

Frequently Asked Questions

What is the market size of glutamic acid in 2025?

The market is expected to reach USD 11.1 billion in 2025.

What is the projected market value of glutamic acid by 2035?

The market is forecast to reach USD 17.6 billion by 2035.

What is the CAGR of the glutamic acid market from 2025 to 2035?

The market is projected to grow at a CAGR of 4.7% during this period.

Which segment leads the glutamic acid market?

Food additives will dominate the market with a 40% share in 2025.

What is the market share of the food additives segment in the glutamic acid market?

The food additives are expected to account for 40% market share in 2025.

Explore Similar Insights

Future Market Insights

Glutamic Acid Market