Gluten Index Device Market Forecast and Outlook 2025 to 2035

The global gluten index device market is projected to grow from USD 192.6 million in 2025 to approximately USD 319.8 million by 2035, recording an absolute increase of USD 127.2 million over the forecast period. This translates into a total growth of 66%, with the market forecast to expand at a compound annual growth rate (CAGR) of 5.2% between 2025 and 2035. The overall market size is expected to grow by nearly 1.7X during the same period, supported by increasing quality control requirements across flour milling operations, growing adoption of standardized gluten measurement protocols in food processing facilities, and rising research demands driving analytical instrument procurement across agricultural testing laboratories and cereal science applications.

The market exhibits distinct regional dynamics with Asia Pacific emerging as the fastest-growing region, led by China's expanding food processing infrastructure and India's agricultural research modernization. Europe maintains substantial market presence through established quality control frameworks and advanced cereal testing capabilities. North America demonstrates growing adoption driven by food safety regulations and wheat breeding research programs.
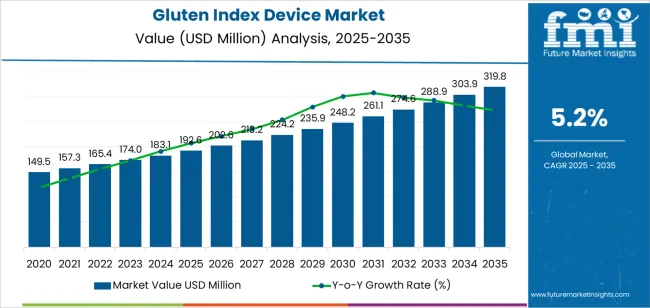
Quick Stats for Gluten Index Device Market

  • Gluten Index Device Market Value (2025): USD 192.6 million
  • Gluten Index Device Market Forecast Value (2035): USD 319.8 million
  • Gluten Index Device Market CAGR: 5.2%
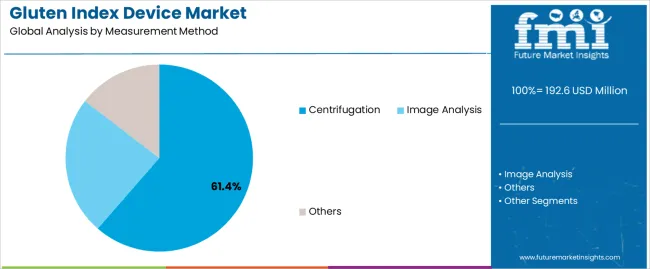
  • Leading Segment by Measurement Method (2025): Centrifugation (61.4%)
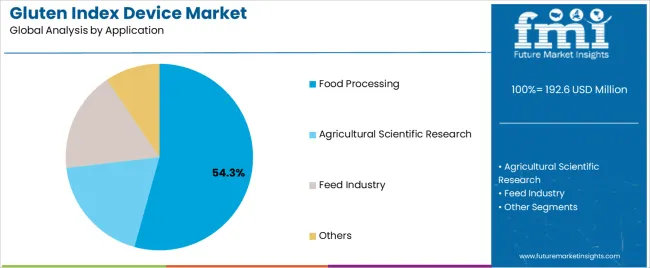
  • Leading Segment by Application (2025): Food Processing (54.3%)
  • Key Growth Regions: Asia Pacific, Europe, North America
  • Top Companies by Market Share: Infitek, PerkinElmer, Scitek

Gluten Index Device Market Market Value Analysis

The gluten index device segment demonstrates particular strength in applications requiring precise gluten quality assessment, including wheat variety evaluation, flour specification verification, and baking performance prediction where standardized measurement protocols ensure consistent product characteristics. Technology evolution continues toward automated measurement systems incorporating image analysis and digital data management capabilities enhancing operational efficiency compared to conventional centrifugation methods. Market participants increasingly focus on developing user-friendly interfaces, establishing regional service networks, and expanding calibration support to address growing demand across flour mills, bakery ingredient suppliers, and agricultural research institutions.

Gluten Index Device Market Key Takeaways

Metric Value
Market Value (2025) USD 192.6 million
Market Forecast Value (2035) USD 319.8 million
Forecast CAGR (2025-2035) 5.2%

Why is the Gluten Index Device Market Growing?

QUALITY CONTROL EXPANSION RESEARCH & DEVELOPMENT DRIVERS REGULATORY & STANDARDIZATION FACTORS
Food Processing Quality Standards Manufacturing facilities implementing comprehensive quality control protocols requiring standardized gluten measurement for flour specification verification and product consistency assurance. Supply Chain Traceability Requirements Flour mills and ingredient suppliers establishing analytical capabilities for supplier qualification, incoming material verification, and customer specification compliance. Baking Performance Prediction Industrial bakeries adopting gluten index testing to predict dough handling characteristics, final product quality, and process parameter optimization. Wheat Breeding Program Advancement Agricultural research institutions evaluating gluten quality characteristics in variety development programs targeting improved baking performance and disease resistance. Functional Property Investigation Cereal science laboratories studying gluten protein structure-function relationships supporting ingredient innovation and formulation optimization. Climate Impact Assessment Research programs evaluating environmental stress effects on wheat quality characteristics requiring comprehensive gluten protein analysis capabilities. International Trade Standards Global wheat commerce requiring standardized quality measurement protocols enabling specification communication and contract compliance verification. Food Safety Certification Requirements Quality management systems including ISO, FSSC, and BRC requiring documented analytical capabilities and measurement traceability. Gluten Content Labeling Regulations Regulatory requirements for gluten-free product certification driving demand for accurate gluten characterization supporting compliance documentation. Industry Specification Harmonization Trade associations and standards organizations establishing uniform testing protocols requiring specific analytical equipment and methodology compliance.

How Are Key Segments in the Gluten Index Device Market Evolving?

Category Segments Covered
By Measurement Method Centrifugation, Image Analysis, Others
By Application Food Processing, Agricultural Scientific Research, Feed Industry, Others
By Region North America, Europe, Asia Pacific, Latin America, Middle East & Africa

Gluten Index Device Market Analysis by Measurement Method

Gluten Index Device Market Analysis By Measurement Method

Segment 2025 to 2035 Outlook
Centrifugation
  • Leader in 2025 with 61.4% market share; maintains dominant position through 2035. Established methodology with international standardization, proven correlation to baking performance, extensive historical data supporting interpretation. Manual operation requiring skilled technicians, standardized sample preparation protocols, established calibration procedures. Widely adopted across flour mills, research institutions, and quality control laboratories. Equipment reliability and method reproducibility supporting regulatory acceptance.
  • Momentum: steady growth driven by expanding food processing infrastructure and quality control adoption in developing regions. Method familiarity and regulatory recognition supporting continued market leadership.
  • Watchouts: labor-intensive operation limiting throughput capacity, skill requirements affecting measurement consistency, competition from automated alternatives in high-volume applications.
Image Analysis
  • Emerging technology segment offering automated measurement capabilities, reduced operator dependency, and enhanced throughput compared to centrifugation methods. Digital imaging systems capturing gluten structure characteristics, software algorithms quantifying quality parameters, data management integration supporting traceability requirements. Limited adoption in 2025 due to higher capital costs and method validation requirements.
  • Momentum: strong growth potential driven by automation trends, labor cost pressures, and digital transformation initiatives in food processing. Technology advancement improving measurement correlation to centrifugation standards supporting regulatory acceptance.
  • Watchouts: method standardization requirements, capital investment barriers affecting small-scale operations, operator training needs for new technology adoption, limited historical data complicating result interpretation.
Others
  • Specialized measurement approaches including rheological testing, protein characterization, and alternative analytical techniques. Niche applications requiring specific gluten property assessment beyond standard index measurement. Research-oriented rather than routine quality control applications. Limited commercial availability and standardization.
  • Momentum: minimal growth as market consolidates around established centrifugation methodology and emerging image analysis alternatives. Academic interest but limited practical adoption in commercial quality control environments. Specialized equipment requirements and interpretation complexity limiting broader application.

Gluten Index Device Market Analysis by Application

Gluten Index Device Market Analysis By Application

Segment 2025 to 2035 Outlook
Food Processing
  • At 54.3%, largest application segment in 2025 with established adoption across flour mills, bakery ingredient suppliers, and pasta manufacturers requiring gluten quality verification. Quality control laboratories performing routine testing on incoming wheat, mill streams, and finished flour products. Specification compliance, product consistency, and customer requirement verification driving demand. Established testing protocols, trained laboratory personnel, proven equipment reliability.
  • Momentum: moderate to strong growth driven by food processing sector expansion in developing regions, quality standard implementation, and supply chain complexity requiring analytical capabilities. Industrial bakery growth and specialty flour market development supporting demand.
  • Watchouts: equipment utilization rates in small mills limiting investment justification, maintenance requirements affecting operational costs, competition from contract laboratory services in low-volume applications.
Agricultural Scientific Research
  • Substantial segment encompassing wheat breeding programs, university research laboratories, and government agricultural research stations. Variety evaluation, genetic improvement programs, environmental stress studies requiring comprehensive gluten quality assessment. Research-grade equipment with enhanced precision and documentation capabilities. Technical support requirements and method development collaboration common.
  • Momentum: steady growth aligned with agricultural research funding and wheat improvement program activity. Climate change research and food security initiatives supporting investment in analytical capabilities. International research collaboration creating demand for standardized measurement protocols.
  • Watchouts: budget constraints affecting capital equipment purchases, research funding cyclicality impacting procurement patterns, specialized technical support requirements limiting supplier participation.
Feed Industry
  • Niche segment utilizing gluten index measurement for wheat feed ingredient evaluation and quality specification. Lower quality wheat destined for animal feed requiring characterization for nutritional value assessment and processing suitability. Limited testing frequency compared to food processing applications. Price-sensitive procurement environment affecting equipment investment decisions.
  • Momentum: limited growth potential due to lower quality standards versus food applications, cost sensitivity limiting analytical investment, alternative rapid testing methods satisfying basic requirements. Market development dependent on premium feed ingredient positioning and quality differentiation strategies.
Others
  • Diverse applications including contract testing laboratories, ingredient trading companies, quality certification services, and educational institutions. Commercial laboratories providing testing services to companies lacking internal capabilities. Trading companies verifying shipment specifications and contract compliance. Technical colleges and universities training food science students.
  • Momentum: moderate growth driven by outsourcing trends in quality testing, international trade expansion requiring third-party verification, and workforce development programs. Service-based business models creating demand for multiple device installations supporting high-throughput operations. Fragmented market structure with regional service providers dominating local markets.

Gluten Index Device Market Analysis by Region

Region Status & Outlook 2025-2035
Asia Pacific
  • Fastest-growing region driven by China food processing expansion and India agricultural modernization. China dominates with 7% growth rate, massive wheat production volumes, expanding flour milling capacity, and comprehensive food safety infrastructure development. India follows with 6.5% growth as research capabilities advance and quality control adoption increases. Established wheat-producing regions implementing modern analytical capabilities.
  • Momentum: exceptional growth driven by urbanization supporting processed food demand, wheat self-sufficiency programs requiring quality improvement, and food safety regulation implementation. Domestic device manufacturing emerging but import dependency remains for premium equipment.
  • Watchouts: price sensitivity affecting equipment specifications, technical support infrastructure gaps complicating maintenance and calibration, operator training requirements affecting measurement consistency, varying quality standards across regional markets complicating standardization.
Europe
  • Established market with mature quality control infrastructure and comprehensive cereal testing capabilities. Germany leads with 6% growth rate, advanced milling technology, extensive research institutions, and sophisticated food processing sector. France, Italy, and Eastern European wheat-producing regions maintaining substantial testing infrastructure. Stringent quality standards and regulatory frameworks supporting analytical equipment adoption.
  •  Momentum: steady growth driven by food quality emphasis, artisanal baking sector development, and organic wheat production requiring quality verification. Technology replacement cycles and automation adoption supporting equipment upgrades. Innovation leadership in measurement technology and methodology development.
North America
  • Mature market with established wheat quality testing infrastructure and comprehensive research capabilities. United States dominates with 4.9% growth rate, extensive wheat breeding programs, commercial milling operations, and advanced food processing sector. Canada following with wheat export focus requiring quality verification capabilities. Technical sophistication and regulatory compliance supporting equipment investment.
  • Momentum: moderate growth driven by wheat breeding innovation, specialty flour market development, and food safety compliance requirements. Technology adoption in craft brewing and artisanal baking segments providing niche opportunities.
  • Watchouts: market maturity limiting growth potential, equipment replacement cycles rather than new installations, consolidation in milling industry affecting device demand patterns.
Latin America
  • Developing market with growing wheat processing infrastructure and emerging quality control capabilities. Brazil leads with 5.5% growth rate as domestic wheat production expands and food processing modernizes. Argentina following with wheat export focus and milling industry development. Import-dependent for analytical equipment with limited domestic manufacturing. Cost sensitivity affecting equipment specifications and adoption rates.
  • Momentum: moderate growth contingent on agricultural sector development, food processing modernization, and quality standard implementation. Technical service infrastructure limitations affecting maintenance and calibration support. Long-term potential dependent on wheat production expansion and food safety regulation development.
Middle East & Africa
  • Limited current market activity concentrated in North African wheat-producing regions and Middle Eastern import-dependent countries. Egypt, Morocco, and South Africa representing majority of regional demand. Import verification for wheat shipments and basic milling quality control driving limited device adoption.
  • Momentum: minimal near-term growth with selective opportunities in wheat import verification and emerging domestic processing infrastructure. Food security initiatives and wheat self-sufficiency programs potentially supporting future quality control capability development. Limited technical infrastructure and operator expertise constraining broader adoption. Market development contingent on agricultural investment and food processing sector advancement.

What Are the Main Drivers of Demand for Gluten Index Devices Globally?

DRIVERS RESTRAINTS KEY TRENDS
Food Safety Regulation Expansion Government quality standards and food safety frameworks requiring documented analytical capabilities and measurement traceability across wheat processing operations. Quality-Based Wheat Pricing Commercial wheat trading incorporating quality premiums and penalties creating economic incentives for accurate gluten characterization supporting contract compliance. Processed Food Market Growth Expanding bakery product consumption and convenience food demand requiring consistent flour quality specifications supporting analytical capability investment. Capital Investment Requirements Equipment costs and laboratory infrastructure requirements creating barriers to adoption in small-scale operations and resource-constrained facilities. Technical Skill Dependencies Manual centrifugation methodology requiring trained laboratory personnel and standardized testing procedures affecting measurement consistency and operational costs. Equipment Maintenance Complexity Specialized calibration requirements, consumable costs, and technical service needs affecting total cost of ownership and operational continuity. Automation Technology Advancement Development of automated sample handling, measurement execution, and data management systems reducing operator dependency and enhancing throughput capacity. Digital Integration Capabilities Connectivity features enabling laboratory information management system integration, cloud-based data storage, and remote monitoring supporting quality management compliance. Portable Device Development Compact instrumentation enabling on-site testing in mills, grain elevators, and field research locations reducing sample handling requirements and accelerating decision-making. Multi-Parameter Analysis Systems Integrated platforms combining gluten index measurement with protein content, moisture determination, and falling number analysis consolidating quality testing requirements.

Which Countries Are Leading the Charge in the Gluten Index Device Market?

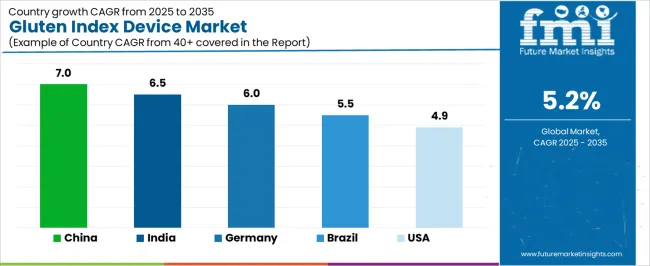
Gluten Index Device Market Cagr Analysis By Country

Country CAGR (2025-2035)
China 7%
India 6.5%
Germany 6%
Brazil 5.5%
United States 4.9%

What role does China play in the growth of the Gluten Index Device market?

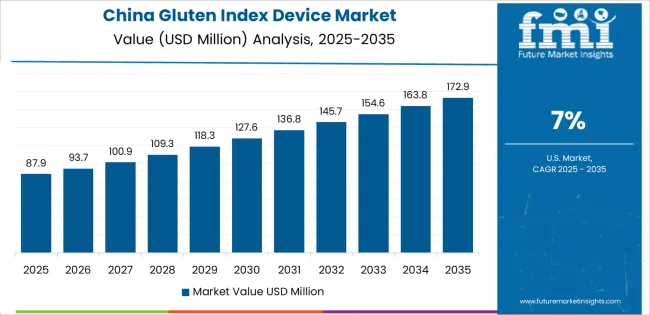
Gluten Index Device Market Country Value Analysis

Revenue from gluten index devices in China is projected to exhibit exceptional growth with market value reaching significant levels by 2035, driven by massive wheat production volumes and comprehensive food safety infrastructure development programs creating substantial opportunities for analytical equipment suppliers across flour milling operations, food processing quality control laboratories, and agricultural research institutions. The country's expanding food safety regulatory framework and growing quality consciousness are creating significant demand for standardized gluten measurement capabilities. Major flour milling corporations and food processing companies are establishing comprehensive quality control laboratories supporting demand for analytical instrumentation.

Food safety regulation implementation and quality standard enforcement are supporting widespread adoption of gluten index testing across wheat processing operations, driving demand for reliable measurement devices and technical support services. Flour milling capacity expansion and processed food manufacturing growth are creating substantial opportunities for analytical equipment suppliers offering comprehensive training programs and maintenance support. Wheat quality improvement initiatives and agricultural modernization programs are facilitating adoption of standardized testing methodologies throughout major wheat-producing provinces and processing centers.

Why is India becoming a key market for Gluten Index Devices?

Revenue from gluten index devices in India is expanding substantially by 2035, supported by agricultural research institution modernization and comprehensive wheat breeding program development creating sustained demand for analytical equipment across government research facilities, university laboratories, and emerging private sector quality control operations. The country's wheat self-sufficiency programs and expanding food processing sector are driving demand for gluten measurement capabilities supporting variety evaluation and quality verification requirements. International equipment suppliers and domestic distributors are investing in technical service networks to support equipment installation and operator training needs.

Wheat breeding research programs and variety evaluation initiatives are creating opportunities for gluten index devices across agricultural research centers requiring comprehensive quality assessment capabilities. Food processing sector development and flour milling modernization are driving investments in quality control infrastructure supporting product consistency and specification compliance throughout wheat value chains. Quality standard implementation and food safety awareness programs are enhancing demand for analytical capabilities throughout primary wheat-producing states and processing centers.

Why is Germany a leading market for Gluten Index Devices in Europe?

Demand for gluten index devices in Germany is projected to reach substantial levels by 2035, supported by the country's leadership in cereal science research and advanced food processing technologies requiring sophisticated analytical capabilities for wheat quality evaluation, flour specification verification, and baking performance prediction. German research institutions and milling companies are implementing advanced gluten measurement systems that support comprehensive quality protocols, data management integration, and regulatory compliance requirements. The market is characterized by focus on analytical precision, methodology advancement, and compliance with stringent food quality and research standards.

Premium baking ingredient production and specialized flour manufacturing are prioritizing advanced analytical technologies that demonstrate superior measurement precision and reliability while meeting German food quality and research excellence standards. Wheat breeding programs and cereal science research initiatives are driving adoption of standardized testing protocols supporting variety evaluation and functional property investigation. Technology development programs for automated measurement systems are facilitating innovation in gluten characterization methodologies throughout major research centers and industrial quality control laboratories.

What trends are driving the demand for Gluten Index Devices in the USA?

Revenue from gluten index devices in United States is growing to reach substantial levels by 2035, driven by comprehensive wheat breeding programs and advanced cereal science research creating sustained opportunities for analytical equipment suppliers serving both agricultural research institutions and commercial milling operations. The country's extensive wheat production diversity and established food processing infrastructure are creating demand for gluten index devices that support variety evaluation, quality verification, and regulatory compliance requirements. Equipment manufacturers and distributors are developing comprehensive technical support capabilities to address research specifications and industrial quality control demands.

Wheat variety development programs and agricultural research initiatives are facilitating adoption of gluten index measurement capabilities supporting breeding selection decisions and quality trait evaluation. Specialty flour production and artisanal baking ingredient supply are enhancing demand for analytical capabilities that support product differentiation and quality positioning strategies. Food safety compliance requirements and quality management system implementation are creating opportunities for standardized analytical methodologies across American milling operations and food processing facilities.

What factors are driving the Gluten Index Device market in Brazil?

Demand for gluten index devices in Brazil is projected to reach meaningful levels by 2035, driven by domestic wheat production expansion and flour milling modernization programs supporting gradual quality control capability adoption in processing facilities and agricultural research operations. The country's growing wheat self-sufficiency initiatives and expanding bakery product consumption are creating demand for gluten measurement capabilities supporting quality improvement and specification compliance. International equipment suppliers and regional distributors are maintaining technical service capabilities to support equipment installation and operator training requirements.

Wheat breeding programs and agricultural research development are supporting demand for gluten index devices that enable variety evaluation and quality assessment capabilities. Flour milling modernization and food processing quality improvement initiatives are creating opportunities for analytical equipment that provides measurement reliability and compliance support. Wheat quality awareness programs and industry standardization efforts are facilitating adoption of testing methodologies throughout wheat-producing regions and processing centers.
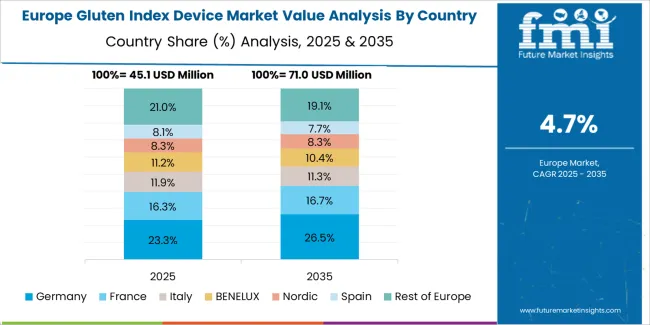
What regional factors are influencing the Gluten Index Device market in Europe?

Gluten Index Device Market Europe Country Market Share Analysis, 2025 & 2035

The gluten index device market in Europe is projected to grow from USD 66.6 million in 2025 to USD 145.3 million by 2035, registering a CAGR of 8.1% over the forecast period. Germany is expected to maintain its leadership position with a 36.4% market share in 2025, declining slightly to 35.1% by 2035, supported by its advanced cereal science research infrastructure and comprehensive flour milling quality control capabilities serving premium baking ingredient production.

France follows with a 24.7% share in 2025, projected to reach 25.3% by 2035, driven by wheat breeding research programs and artisanal baking tradition supporting quality verification requirements. The United Kingdom holds a 15.2% share in 2025, expected to maintain 14.9% by 2035 with established milling operations and food science research institutions. Italy commands a 12.1% share, while Spain accounts for 8.3% in 2025. The Rest of Europe region is anticipated to gain momentum, expanding its collective share from 3.3% to 4.5% by 2035, attributed to increasing wheat production in Eastern European countries and quality control adoption in emerging milling operations implementing modern analytical capabilities.
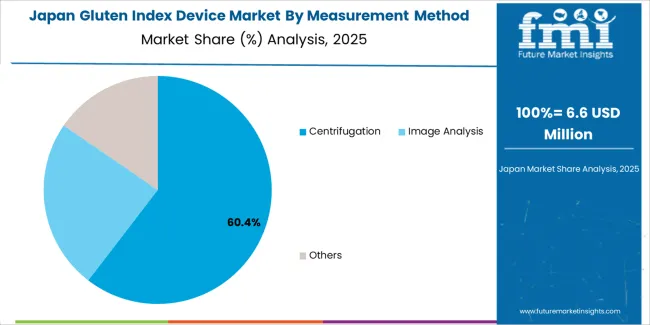
How is Japan’s food safety market influencing the demand for Gluten Index Devices?

Gluten Index Device Market Japan Market Share Analysis By Measurement Method

Japanese gluten index device operations reflect the country's precision standards and sophisticated food science research capabilities. Major research institutions including National Agriculture and Food Research Organization and university cereal science programs maintain comprehensive analytical capabilities emphasizing measurement precision, methodology validation, and international standard compliance. This creates structured market conditions favoring established equipment manufacturers with proven reliability and extensive technical documentation.

The Japanese market demonstrates advanced application focus, with significant research activity on wheat quality factors affecting noodle production characteristics, texture properties, and processing functionality. Research programs require detailed analytical protocols and comprehensive data management capabilities that align with Japanese scientific rigor standards, driving demand for sophisticated instrumentation and technical support services.

Quality standards emphasize measurement traceability and calibration verification, with research laboratories maintaining strict documentation protocols and equipment maintenance schedules. The analytical framework creates advantages for equipment suppliers with established calibration services, comprehensive technical support capabilities, and proven measurement precision.

Supplier relationships focus on long-term technical partnerships supporting research collaboration and methodology development. Japanese research institutions typically maintain extended relationships with equipment manufacturers, emphasizing technical consultation, application support, and continuous measurement improvement rather than competitive procurement processes. This stability supports specialized equipment development and application optimization investments tailored to Japanese wheat quality research requirements and noodle processing applications.
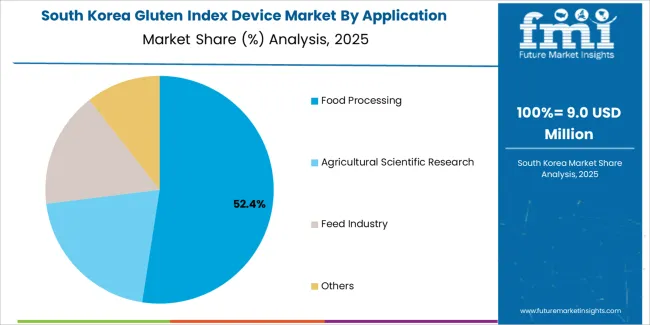
Quality Focus Drives South Korean Market Development

Gluten Index Device Market South Korea Market Share Analysis By Application

South Korean gluten index device operations reflect the country's advanced food science research capabilities and developing wheat processing sector. Major research institutions including Rural Development Administration and university food science programs drive analytical equipment procurement supporting wheat breeding initiatives, quality evaluation research, and processing technology development targeting improved noodle and baking product characteristics.

The Korean market demonstrates particular interest in wheat quality factors affecting traditional food applications, with research programs investigating gluten characteristics suitable for Korean noodle products and Asian bakery applications. This application focus creates demand for comprehensive analytical capabilities supporting product development and quality specification establishment.

Research funding frameworks emphasize agricultural productivity improvement and food security objectives, with government support for wheat breeding programs and quality research initiatives. Equipment procurement decisions require comprehensive performance validation and technical justification, creating structured evaluation processes that favor established manufacturers with proven analytical capabilities.

Technical collaboration between Korean research institutions and equipment suppliers focuses on methodology adaptation for Asian wheat varieties and traditional product applications. Research programs invest in comprehensive analytical capabilities supporting wheat quality improvement initiatives and processing technology advancement, positioning the market for development as wheat production expands and quality consciousness increases in food processing operations.
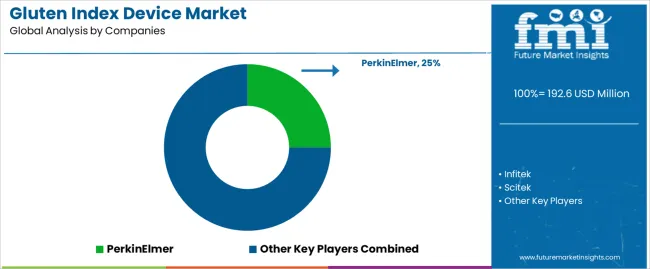
How are companies positioning themselves in the Gluten Index Device market?

Gluten Index Device Market Analysis By Company

Profit pools consolidate around manufacturers demonstrating measurement reliability and comprehensive technical support capabilities addressing customer application requirements. Value migrates from basic centrifugation equipment toward advanced automated systems where throughput enhancement, operator independence, and data management integration command premiums. Several operational models define competitive positioning: established analytical equipment manufacturers offering comprehensive laboratory instrumentation portfolios and global service networks; specialized cereal testing equipment producers focusing on wheat quality measurement and application expertise; regional distributors providing localized technical support and calibration services; and emerging technology developers introducing image analysis and automated measurement alternatives.

Switching costs remain moderate for standard centrifugation methodology where dimensional specifications enable equipment substitution with minimal disruption. However, established measurement protocols, operator familiarity, and historical data correlation create practical barriers to equipment changes requiring retraining and method validation. Competitive advantages accrue to manufacturers maintaining comprehensive technical documentation supporting regulatory compliance while offering responsive service networks addressing calibration, maintenance, and troubleshooting requirements.

Market structure demonstrates concentration among established manufacturers controlling significant share through brand recognition, proven reliability, and regulatory acceptance while regional suppliers compete through price positioning and localized service. Distribution approaches vary with direct sales predominating for research institutions while distributor networks serve commercial quality control laboratories. Technology differentiation focuses on automation advancement, measurement throughput enhancement, and data management integration supporting modern laboratory information systems. Strategic positioning emphasizes application support capabilities with manufacturers providing training programs, methodology consultation, and technical resources supporting customer success and measurement confidence.

Who are the leading players in the Gluten Index Device market?

  • Infitek
  • PerkinElmer
  • Scitek
  • Bioevopeak
  • Saytek
  • Erkaya Instruments
  • Bastak Instruments
  • Ardazmanlian Engineering
  • Perten Glutomatic
  • Nanbei Instrument
  • Calibre Control International
  • Sartorom

Scope of the Report

Items Values
Quantitative Units USD 192.6 million
Measurement Method Centrifugation, Image Analysis, Others
Application Food Processing, Agricultural Scientific Research, Feed Industry, Others
Regions Covered North America, Latin America, Europe, Asia Pacific, Middle East & Africa
Key Countries Covered United States, Germany, China, India, Brazil, Japan, South Korea, and other countries
Key Companies Profiled Infitek, PerkinElmer, Scitek, Bioevopeak, Saytek, Erkaya Instruments, Bastak Instruments, Ardazmanlian Engineering, Perten Glutomatic, Nanbei Instrument, Calibre Control International, Sartorom
Additional Attributes Revenue analysis by measurement method and application segment, regional market dynamics, competitive landscape assessment, testing methodology evolution, automation technology trends, and analytical capability innovations driving quality assurance enhancement, research advancement, and operational efficiency

Gluten Index Device Market Segmentation

By Measurement Method

  • Centrifugation
  • Image Analysis
  • Others

By Application

  • Food Processing
  • Agricultural Scientific Research
  • Feed Industry
  • Others

By Region

  • North America
  • Europe
  • Asia Pacific
  • Latin America
  • Middle East & Africa

Frequently Asked Questions

How big is the gluten index device market in 2025?

The global gluten index device market is estimated to be valued at USD 192.6 million in 2025.

What will be the size of gluten index device market in 2035?

The market size for the gluten index device market is projected to reach USD 319.8 million by 2035.

How much will be the gluten index device market growth between 2025 and 2035?

The gluten index device market is expected to grow at a 5.2% CAGR between 2025 and 2035.

What are the key product types in the gluten index device market?

The key product types in gluten index device market are centrifugation, image analysis and others.

Which application segment to contribute significant share in the gluten index device market in 2025?

In terms of application, food processing segment to command 54.3% share in the gluten index device market in 2025.

Table of Content

  1. Executive Summary
    • Global Market Outlook
    • Demand to side Trends
    • Supply to side Trends
    • Technology Roadmap Analysis
    • Analysis and Recommendations
  2. Market Overview
    • Market Coverage / Taxonomy
    • Market Definition / Scope / Limitations
  3. Market Background
    • Market Dynamics
      • Drivers
      • Restraints
      • Opportunity
      • Trends
    • Scenario Forecast
      • Demand in Optimistic Scenario
      • Demand in Likely Scenario
      • Demand in Conservative Scenario
    • Opportunity Map Analysis
    • Product Life Cycle Analysis
    • Supply Chain Analysis
    • Investment Feasibility Matrix
    • Value Chain Analysis
    • PESTLE and Porter’s Analysis
    • Regulatory Landscape
    • Regional Parent Market Outlook
    • Production and Consumption Statistics
    • Import and Export Statistics
  4. Global Market Analysis 2020 to 2024 and Forecast, 2025 to 2035
    • Historical Market Size Value (USD Million) Analysis, 2020 to 2024
    • Current and Future Market Size Value (USD Million) Projections, 2025 to 2035
      • Y to o to Y Growth Trend Analysis
      • Absolute $ Opportunity Analysis
  5. Global Market Pricing Analysis 2020 to 2024 and Forecast 2025 to 2035
  6. Global Market Analysis 2020 to 2024 and Forecast 2025 to 2035, By Measurement Method
    • Introduction / Key Findings
    • Historical Market Size Value (USD Million) Analysis By Measurement Method , 2020 to 2024
    • Current and Future Market Size Value (USD Million) Analysis and Forecast By Measurement Method , 2025 to 2035
      • Centrifugation
      • Image Analysis
      • Others
    • Y to o to Y Growth Trend Analysis By Measurement Method , 2020 to 2024
    • Absolute $ Opportunity Analysis By Measurement Method , 2025 to 2035
  7. Global Market Analysis 2020 to 2024 and Forecast 2025 to 2035, By Application
    • Introduction / Key Findings
    • Historical Market Size Value (USD Million) Analysis By Application, 2020 to 2024
    • Current and Future Market Size Value (USD Million) Analysis and Forecast By Application, 2025 to 2035
      • Food Processing
      • Agricultural Scientific Research
      • Feed Industry
      • Others
    • Y to o to Y Growth Trend Analysis By Application, 2020 to 2024
    • Absolute $ Opportunity Analysis By Application, 2025 to 2035
  8. Global Market Analysis 2020 to 2024 and Forecast 2025 to 2035, By Region
    • Introduction
    • Historical Market Size Value (USD Million) Analysis By Region, 2020 to 2024
    • Current Market Size Value (USD Million) Analysis and Forecast By Region, 2025 to 2035
      • North America
      • Latin America
      • Western Europe
      • Eastern Europe
      • East Asia
      • South Asia and Pacific
      • Middle East & Africa
    • Market Attractiveness Analysis By Region
  9. North America Market Analysis 2020 to 2024 and Forecast 2025 to 2035, By Country
    • Historical Market Size Value (USD Million) Trend Analysis By Market Taxonomy, 2020 to 2024
    • Market Size Value (USD Million) Forecast By Market Taxonomy, 2025 to 2035
      • By Country
        • USA
        • Canada
        • Mexico
      • By Measurement Method
      • By Application
    • Market Attractiveness Analysis
      • By Country
      • By Measurement Method
      • By Application
    • Key Takeaways
  10. Latin America Market Analysis 2020 to 2024 and Forecast 2025 to 2035, By Country
    • Historical Market Size Value (USD Million) Trend Analysis By Market Taxonomy, 2020 to 2024
    • Market Size Value (USD Million) Forecast By Market Taxonomy, 2025 to 2035
      • By Country
        • Brazil
        • Chile
        • Rest of Latin America
      • By Measurement Method
      • By Application
    • Market Attractiveness Analysis
      • By Country
      • By Measurement Method
      • By Application
    • Key Takeaways
  11. Western Europe Market Analysis 2020 to 2024 and Forecast 2025 to 2035, By Country
    • Historical Market Size Value (USD Million) Trend Analysis By Market Taxonomy, 2020 to 2024
    • Market Size Value (USD Million) Forecast By Market Taxonomy, 2025 to 2035
      • By Country
        • Germany
        • UK
        • Italy
        • Spain
        • France
        • Nordic
        • BENELUX
        • Rest of Western Europe
      • By Measurement Method
      • By Application
    • Market Attractiveness Analysis
      • By Country
      • By Measurement Method
      • By Application
    • Key Takeaways
  12. Eastern Europe Market Analysis 2020 to 2024 and Forecast 2025 to 2035, By Country
    • Historical Market Size Value (USD Million) Trend Analysis By Market Taxonomy, 2020 to 2024
    • Market Size Value (USD Million) Forecast By Market Taxonomy, 2025 to 2035
      • By Country
        • Russia
        • Poland
        • Hungary
        • Balkan & Baltic
        • Rest of Eastern Europe
      • By Measurement Method
      • By Application
    • Market Attractiveness Analysis
      • By Country
      • By Measurement Method
      • By Application
    • Key Takeaways
  13. East Asia Market Analysis 2020 to 2024 and Forecast 2025 to 2035, By Country
    • Historical Market Size Value (USD Million) Trend Analysis By Market Taxonomy, 2020 to 2024
    • Market Size Value (USD Million) Forecast By Market Taxonomy, 2025 to 2035
      • By Country
        • China
        • Japan
        • South Korea
      • By Measurement Method
      • By Application
    • Market Attractiveness Analysis
      • By Country
      • By Measurement Method
      • By Application
    • Key Takeaways
  14. South Asia and Pacific Market Analysis 2020 to 2024 and Forecast 2025 to 2035, By Country
    • Historical Market Size Value (USD Million) Trend Analysis By Market Taxonomy, 2020 to 2024
    • Market Size Value (USD Million) Forecast By Market Taxonomy, 2025 to 2035
      • By Country
        • India
        • ASEAN
        • Australia & New Zealand
        • Rest of South Asia and Pacific
      • By Measurement Method
      • By Application
    • Market Attractiveness Analysis
      • By Country
      • By Measurement Method
      • By Application
    • Key Takeaways
  15. Middle East & Africa Market Analysis 2020 to 2024 and Forecast 2025 to 2035, By Country
    • Historical Market Size Value (USD Million) Trend Analysis By Market Taxonomy, 2020 to 2024
    • Market Size Value (USD Million) Forecast By Market Taxonomy, 2025 to 2035
      • By Country
        • Kingdom of Saudi Arabia
        • Other GCC Countries
        • Turkiye
        • South Africa
        • Other African Union
        • Rest of Middle East & Africa
      • By Measurement Method
      • By Application
    • Market Attractiveness Analysis
      • By Country
      • By Measurement Method
      • By Application
    • Key Takeaways
  16. Key Countries Market Analysis
    • USA
      • Pricing Analysis
      • Market Share Analysis, 2024
        • By Measurement Method
        • By Application
    • Canada
      • Pricing Analysis
      • Market Share Analysis, 2024
        • By Measurement Method
        • By Application
    • Mexico
      • Pricing Analysis
      • Market Share Analysis, 2024
        • By Measurement Method
        • By Application
    • Brazil
      • Pricing Analysis
      • Market Share Analysis, 2024
        • By Measurement Method
        • By Application
    • Chile
      • Pricing Analysis
      • Market Share Analysis, 2024
        • By Measurement Method
        • By Application
    • Germany
      • Pricing Analysis
      • Market Share Analysis, 2024
        • By Measurement Method
        • By Application
    • UK
      • Pricing Analysis
      • Market Share Analysis, 2024
        • By Measurement Method
        • By Application
    • Italy
      • Pricing Analysis
      • Market Share Analysis, 2024
        • By Measurement Method
        • By Application
    • Spain
      • Pricing Analysis
      • Market Share Analysis, 2024
        • By Measurement Method
        • By Application
    • France
      • Pricing Analysis
      • Market Share Analysis, 2024
        • By Measurement Method
        • By Application
    • India
      • Pricing Analysis
      • Market Share Analysis, 2024
        • By Measurement Method
        • By Application
    • ASEAN
      • Pricing Analysis
      • Market Share Analysis, 2024
        • By Measurement Method
        • By Application
    • Australia & New Zealand
      • Pricing Analysis
      • Market Share Analysis, 2024
        • By Measurement Method
        • By Application
    • China
      • Pricing Analysis
      • Market Share Analysis, 2024
        • By Measurement Method
        • By Application
    • Japan
      • Pricing Analysis
      • Market Share Analysis, 2024
        • By Measurement Method
        • By Application
    • South Korea
      • Pricing Analysis
      • Market Share Analysis, 2024
        • By Measurement Method
        • By Application
    • Russia
      • Pricing Analysis
      • Market Share Analysis, 2024
        • By Measurement Method
        • By Application
    • Poland
      • Pricing Analysis
      • Market Share Analysis, 2024
        • By Measurement Method
        • By Application
    • Hungary
      • Pricing Analysis
      • Market Share Analysis, 2024
        • By Measurement Method
        • By Application
    • Kingdom of Saudi Arabia
      • Pricing Analysis
      • Market Share Analysis, 2024
        • By Measurement Method
        • By Application
    • Turkiye
      • Pricing Analysis
      • Market Share Analysis, 2024
        • By Measurement Method
        • By Application
    • South Africa
      • Pricing Analysis
      • Market Share Analysis, 2024
        • By Measurement Method
        • By Application
  17. Market Structure Analysis
    • Competition Dashboard
    • Competition Benchmarking
    • Market Share Analysis of Top Players
      • By Regional
      • By Measurement Method
      • By Application
  18. Competition Analysis
    • Competition Deep Dive
      • PerkinElmer
        • Overview
        • Product Portfolio
        • Profitability by Market Segments (Product/Age /Sales Channel/Region)
        • Sales Footprint
        • Strategy Overview
          • Marketing Strategy
          • Product Strategy
          • Channel Strategy
      • Infitek
      • Scitek
      • Bioevopeak
      • Saytek
      • Erkaya Instruments
      • Bastak Instruments
      • Ardazmanlian Engineering
      • Perten Glutomatic
      • Nanbei Instrument
      • Calibre Control International
      • Sartorom
  19. Assumptions & Acronyms Used
  20. Research Methodology

List of Tables

  • Table 1: Global Market Value (USD Million) Forecast by Region, 2020 to 2035
  • Table 2: Global Market Value (USD Million) Forecast by Measurement Method , 2020 to 2035
  • Table 3: Global Market Value (USD Million) Forecast by Application, 2020 to 2035
  • Table 4: North America Market Value (USD Million) Forecast by Country, 2020 to 2035
  • Table 5: North America Market Value (USD Million) Forecast by Measurement Method , 2020 to 2035
  • Table 6: North America Market Value (USD Million) Forecast by Application, 2020 to 2035
  • Table 7: Latin America Market Value (USD Million) Forecast by Country, 2020 to 2035
  • Table 8: Latin America Market Value (USD Million) Forecast by Measurement Method , 2020 to 2035
  • Table 9: Latin America Market Value (USD Million) Forecast by Application, 2020 to 2035
  • Table 10: Western Europe Market Value (USD Million) Forecast by Country, 2020 to 2035
  • Table 11: Western Europe Market Value (USD Million) Forecast by Measurement Method , 2020 to 2035
  • Table 12: Western Europe Market Value (USD Million) Forecast by Application, 2020 to 2035
  • Table 13: Eastern Europe Market Value (USD Million) Forecast by Country, 2020 to 2035
  • Table 14: Eastern Europe Market Value (USD Million) Forecast by Measurement Method , 2020 to 2035
  • Table 15: Eastern Europe Market Value (USD Million) Forecast by Application, 2020 to 2035
  • Table 16: East Asia Market Value (USD Million) Forecast by Country, 2020 to 2035
  • Table 17: East Asia Market Value (USD Million) Forecast by Measurement Method , 2020 to 2035
  • Table 18: East Asia Market Value (USD Million) Forecast by Application, 2020 to 2035
  • Table 19: South Asia and Pacific Market Value (USD Million) Forecast by Country, 2020 to 2035
  • Table 20: South Asia and Pacific Market Value (USD Million) Forecast by Measurement Method , 2020 to 2035
  • Table 21: South Asia and Pacific Market Value (USD Million) Forecast by Application, 2020 to 2035
  • Table 22: Middle East & Africa Market Value (USD Million) Forecast by Country, 2020 to 2035
  • Table 23: Middle East & Africa Market Value (USD Million) Forecast by Measurement Method , 2020 to 2035
  • Table 24: Middle East & Africa Market Value (USD Million) Forecast by Application, 2020 to 2035

List of Figures

  • Figure 1: Global Market Pricing Analysis
  • Figure 2: Global Market Value (USD Million) Forecast 2020-2035
  • Figure 3: Global Market Value Share and BPS Analysis by Measurement Method , 2025 and 2035
  • Figure 4: Global Market Y to o to Y Growth Comparison by Measurement Method , 2025-2035
  • Figure 5: Global Market Attractiveness Analysis by Measurement Method
  • Figure 6: Global Market Value Share and BPS Analysis by Application, 2025 and 2035
  • Figure 7: Global Market Y to o to Y Growth Comparison by Application, 2025-2035
  • Figure 8: Global Market Attractiveness Analysis by Application
  • Figure 9: Global Market Value (USD Million) Share and BPS Analysis by Region, 2025 and 2035
  • Figure 10: Global Market Y to o to Y Growth Comparison by Region, 2025-2035
  • Figure 11: Global Market Attractiveness Analysis by Region
  • Figure 12: North America Market Incremental Dollar Opportunity, 2025-2035
  • Figure 13: Latin America Market Incremental Dollar Opportunity, 2025-2035
  • Figure 14: Western Europe Market Incremental Dollar Opportunity, 2025-2035
  • Figure 15: Eastern Europe Market Incremental Dollar Opportunity, 2025-2035
  • Figure 16: East Asia Market Incremental Dollar Opportunity, 2025-2035
  • Figure 17: South Asia and Pacific Market Incremental Dollar Opportunity, 2025-2035
  • Figure 18: Middle East & Africa Market Incremental Dollar Opportunity, 2025-2035
  • Figure 19: North America Market Value Share and BPS Analysis by Country, 2025 and 2035
  • Figure 20: North America Market Value Share and BPS Analysis by Measurement Method , 2025 and 2035
  • Figure 21: North America Market Y to o to Y Growth Comparison by Measurement Method , 2025-2035
  • Figure 22: North America Market Attractiveness Analysis by Measurement Method
  • Figure 23: North America Market Value Share and BPS Analysis by Application, 2025 and 2035
  • Figure 24: North America Market Y to o to Y Growth Comparison by Application, 2025-2035
  • Figure 25: North America Market Attractiveness Analysis by Application
  • Figure 26: Latin America Market Value Share and BPS Analysis by Country, 2025 and 2035
  • Figure 27: Latin America Market Value Share and BPS Analysis by Measurement Method , 2025 and 2035
  • Figure 28: Latin America Market Y to o to Y Growth Comparison by Measurement Method , 2025-2035
  • Figure 29: Latin America Market Attractiveness Analysis by Measurement Method
  • Figure 30: Latin America Market Value Share and BPS Analysis by Application, 2025 and 2035
  • Figure 31: Latin America Market Y to o to Y Growth Comparison by Application, 2025-2035
  • Figure 32: Latin America Market Attractiveness Analysis by Application
  • Figure 33: Western Europe Market Value Share and BPS Analysis by Country, 2025 and 2035
  • Figure 34: Western Europe Market Value Share and BPS Analysis by Measurement Method , 2025 and 2035
  • Figure 35: Western Europe Market Y to o to Y Growth Comparison by Measurement Method , 2025-2035
  • Figure 36: Western Europe Market Attractiveness Analysis by Measurement Method
  • Figure 37: Western Europe Market Value Share and BPS Analysis by Application, 2025 and 2035
  • Figure 38: Western Europe Market Y to o to Y Growth Comparison by Application, 2025-2035
  • Figure 39: Western Europe Market Attractiveness Analysis by Application
  • Figure 40: Eastern Europe Market Value Share and BPS Analysis by Country, 2025 and 2035
  • Figure 41: Eastern Europe Market Value Share and BPS Analysis by Measurement Method , 2025 and 2035
  • Figure 42: Eastern Europe Market Y to o to Y Growth Comparison by Measurement Method , 2025-2035
  • Figure 43: Eastern Europe Market Attractiveness Analysis by Measurement Method
  • Figure 44: Eastern Europe Market Value Share and BPS Analysis by Application, 2025 and 2035
  • Figure 45: Eastern Europe Market Y to o to Y Growth Comparison by Application, 2025-2035
  • Figure 46: Eastern Europe Market Attractiveness Analysis by Application
  • Figure 47: East Asia Market Value Share and BPS Analysis by Country, 2025 and 2035
  • Figure 48: East Asia Market Value Share and BPS Analysis by Measurement Method , 2025 and 2035
  • Figure 49: East Asia Market Y to o to Y Growth Comparison by Measurement Method , 2025-2035
  • Figure 50: East Asia Market Attractiveness Analysis by Measurement Method
  • Figure 51: East Asia Market Value Share and BPS Analysis by Application, 2025 and 2035
  • Figure 52: East Asia Market Y to o to Y Growth Comparison by Application, 2025-2035
  • Figure 53: East Asia Market Attractiveness Analysis by Application
  • Figure 54: South Asia and Pacific Market Value Share and BPS Analysis by Country, 2025 and 2035
  • Figure 55: South Asia and Pacific Market Value Share and BPS Analysis by Measurement Method , 2025 and 2035
  • Figure 56: South Asia and Pacific Market Y to o to Y Growth Comparison by Measurement Method , 2025-2035
  • Figure 57: South Asia and Pacific Market Attractiveness Analysis by Measurement Method
  • Figure 58: South Asia and Pacific Market Value Share and BPS Analysis by Application, 2025 and 2035
  • Figure 59: South Asia and Pacific Market Y to o to Y Growth Comparison by Application, 2025-2035
  • Figure 60: South Asia and Pacific Market Attractiveness Analysis by Application
  • Figure 61: Middle East & Africa Market Value Share and BPS Analysis by Country, 2025 and 2035
  • Figure 62: Middle East & Africa Market Value Share and BPS Analysis by Measurement Method , 2025 and 2035
  • Figure 63: Middle East & Africa Market Y to o to Y Growth Comparison by Measurement Method , 2025-2035
  • Figure 64: Middle East & Africa Market Attractiveness Analysis by Measurement Method
  • Figure 65: Middle East & Africa Market Value Share and BPS Analysis by Application, 2025 and 2035
  • Figure 66: Middle East & Africa Market Y to o to Y Growth Comparison by Application, 2025-2035
  • Figure 67: Middle East & Africa Market Attractiveness Analysis by Application
  • Figure 68: Global Market - Tier Structure Analysis
  • Figure 69: Global Market - Company Share Analysis
Dashboard
Dashboard
Dashboard
Dashboard
Dashboard
Dashboard

Full Research Suite comprises of:

Market outlook & trends analysis

Market outlook & trends analysis

Interviews & case studies

Interviews & case studies

Strategic recommendations

Strategic recommendations

Vendor profiles & capabilities analysis

Vendor profiles & capabilities analysis

5-year forecasts

5-year forecasts

8 regions and 60+ country-level data splits

8 regions and 60+ country-level data splits

Market segment data splits

Market segment data splits

12 months of continuous data updates

12 months of continuous data updates

DELIVERED AS:

PDF EXCEL ONLINE

Full Research Suite


$5000

$7500

$10000

Buy Report Now
Similar Industry Reports

Similar Industry Reports

Gluten-free Food Market

Gluten-free Food Market Size and Share Forecast Outlook 2025 to 2035

Gluten Free Flours Market

Gluten Free Flours Market Size and Share Forecast Outlook 2025 to 2035

Gluten-free Bakery Premix Market

Gluten-free Bakery Premix Market Size and Share Forecast Outlook 2025 to 2035

Gluten Feed Market
Gluten Feed Market

Gluten Feed Market Size and Share Forecast Outlook 2025 to 2035

Gluten Free Pizza Crust Market

Gluten-Free Pizza Crust Market Size, Growth, and Forecast for 2025 to 2035

Gluten-free Product Market

Analysis and Growth Projections for Gluten-free Product Business

Gluten-Free Soup Market

Gluten-Free Soup Market Insights - Specialty Diets & Consumer Demand 2025 to 2035

Gluten-Free Pasta Market

Gluten-Free Pasta Market Trends - Health-Conscious Eating & Market Growth 2025 to 2035

Gluten-Free Oats Market

Gluten-Free Oats Market Insights – Clean Eating & Industry Growth 2025 to 2035

Gluten Free Prepared Food Market

Analysis and Growth Projections for Gluten Free Prepared Food Market

Gluten-free Tortilla Market

Gluten-Free Tortilla Market Trends – Free-From Foods & Market Growth 2024-2034

Gluten-free Facial Product Market

Gluten-Free Facial Product Market Trends – Growth & Forecast 2024-2034

Gluten Intolerance Treatment Market

Gluten Intolerance Treatment Market

Wheat Gluten Market
Wheat Gluten Market

Wheat Gluten Market Size and Share Forecast Outlook 2025 to 2035

Indexable Milling Cutters Market

Indexable Milling Cutters Market Size and Share Forecast Outlook 2025 to 2035

Indexable Tool Inserts Market

Indexable Tool Inserts Market

Rotary Indexer Market

Rotary Indexer Market Analysis - Share, Size, and Forecast 2025 to 2035

Viscosity Index Improver Market

Viscosity Index Improver Market Size and Share Forecast Outlook 2025 to 2035

Device-Embedded Biometric Authentication Market

Device-Embedded Biometric Authentication Market Size and Share Forecast Outlook 2025 to 2035

IoT Device Management Market

IoT Device Management Market Size and Share Forecast Outlook 2025 to 2035

Future Market Insights

Gluten Index Device Market

Chat With MaRIA

Chat With

MaRIA

Hi There, I am MaRIA, Your Market Research Intelligence Assistant. How may I help you?