

- Market Size (2026)
- USD 206.8 Mn
- Forecast (2036)
- USD 659.6 Mn
- CAGR (2026 to 2036)
- 12.3%
How big is GPU Fabric Optical Congestion Analytics Market in 2026?
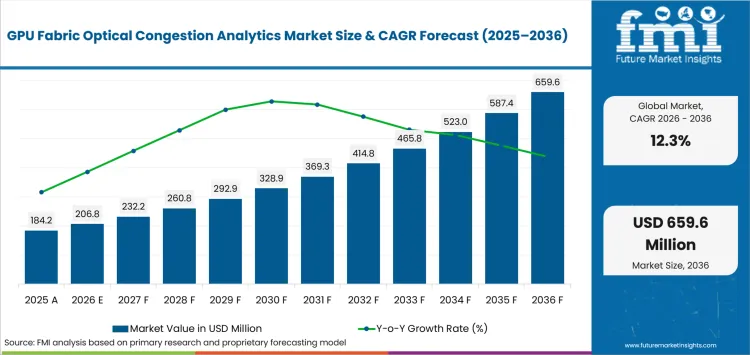
USD 206.8 million in 2026 and USD 659.6 million by 2036 at a 12.3% CAGR.
Demand for gpu fabric optical congestion analytics is projected to expand at a 12.3% CAGR from 2026 to 2036, increasing valuation from USD 206.8 million to USD 659.6 million. Larger accelerator clusters lose useful compute time whenever route imbalance and marginal optical links slow collective traffic. The Ultra Ethernet Consortium released Specification 1.0 in June 2025 with congestion control and interoperability spanning the Ethernet communication stack. Analytics gains value by separating queue pressure from optical degradation before engineers change routing or physical capacity.
National opportunity depends on how much accelerator capacity each country can power without leaving compute idle. The International Energy Agency projected in April 2025 that US data-center electricity use could rise about 130% from 2024 to 2030 versus 80% in Japan. Power trajectories change commissioning schedules and increase the value of recovering network efficiency ahead of capacity expansion.
Key Takeaways of GPU Fabric Optical Congestion Analytics Market
- Demand rises as AI operators protect accelerator utilization by separating traffic congestion from optical-link degradation during route or capacity changes.
- Based on link speed, 800G is projected to account for 38.0% in 2026 due to active AI-fabric deployments that require telemetry ahead of the 1.6T migration.
- By software function, topology & path optimization is estimated to hold 26.0% in 2026 owing to route imbalance affecting collective-job completion time.
- In 2026, inter-rack - scale-out is expected to lead deployment location with 36.0% share because multi-rack traffic crosses more shared queues and optical paths.
- Fragmented switch telemetry and optical diagnostics lengthen qualification until engineers normalize data models for trusted cross-layer root-cause results.
- Key players in the gpu fabric optical congestion analytics market include AP Sensing, EXFO, Corning, and VIAVI Solutions.
Analyst Perspective
"GPU-fabric congestion analytics earns commercial value when it separates route contention from optical margin loss ahead of capacity changes. A useful platform preserves the evidence from 800G qualification into 1.6T deployment so fault isolation does not fragment into another monitoring stack."
- Sudip saha, Principal Consultant, Future Market Insights
How is the GPU Fabric Optical Congestion Analytics Market segmented?
The market is segmented by link speed, software function, deployment location, data center type, and route to market.
Link speed includes 800G, 400G, 1.6T and 3.2T and above. Software function includes topology & path optimization, link-margin analytics, fault localization, power-budget automation and capacity planning. Deployment location includes inter-rack - scale-out, intra-rack - scale-up, spine-leaf fabric and campus - DCI. Data center type includes hyperscale AI data centers, colocation AI facilities, enterprise AI - HPC and research - sovereign compute. Route to market includes OEM direct, network system integrators, fiber - cabling specialists and test & managed-service providers.
What makes 800G central to the link speed category?
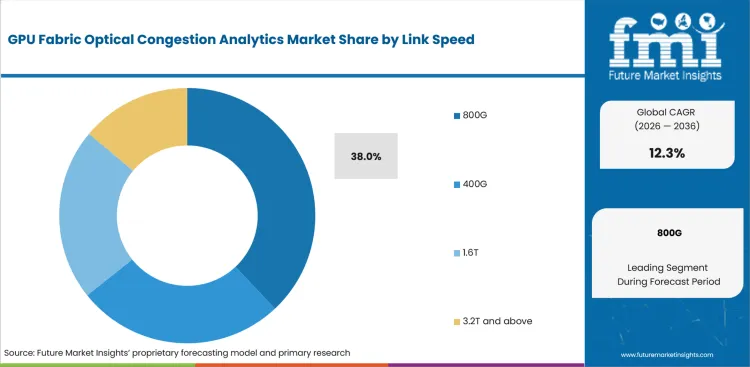
800G is the current qualification baseline for AI fabrics because operators can deploy it now and reuse similar test logic for 1.6T. High-density optical transceivers make marginal link behavior costly to miss during collective traffic bursts that stall many accelerators. The Ethernet Alliance placed 800G on its March 2025 roadmap toward 1.6T systems serving AI and cloud networks.
- 800G is set to lead the link speed category with 38.0% share in 2026 due to active deployment volume and intermittent margin-loss diagnosis.
- Network teams qualify 800G analytics against real traffic patterns so rerouting or physical-link escalation follows consistent production evidence.
How does topology & path optimization shape demand within the software function category?
Topology & path optimization turns telemetry into routing decisions that precede physical network capacity changes during operation. Effective network analytics compares queue pressure with route choice and link condition so congestion is not mistaken for optical failure. In January 2026, the Ultra Ethernet Consortium corrected CMS congestion-control algorithms in Specification 1.0.2 and documented the revision in its public history.
- By software function, topology & path optimization is forecast to represent 26.0% in 2026 driven by path imbalance affecting collective communication in multi-rack GPU clusters.
- Operators favor path-aware software that recommends a bounded traffic change and reserves optical isolation or new capacity for verified physical faults.
What supports inter-rack - scale-out within the deployment location category?
Inter-rack - scale-out traffic crosses more shared queues and optical links than rack-local communication inside multi-rack GPU clusters. Ethernet switching behavior can overlap with marginal physical links on the same job path. Keysight introduced an end-to-end AI data-center test architecture in April 2025 that identifies bottlenecks from interconnects through switches, servers and GPUs.
- The inter-rack - scale-out segment is likely to capture 36.0% share in 2026 attributable to multi-rack jobs traversing more possible congestion points.
- Engineering teams use cross-rack analytics to compare route utilization with link-health evidence during workload rerouting or suspect optical-path isolation.
What role do hyperscale AI data centers play within the data center type category?
Hyperscale AI data centers expose small network losses to enough accelerators that short delays become visible in job economics. Operators already using high-performance computing can justify deeper diagnostics because fabric delays directly affect parallel workloads. Keysight announced 1.6T sampling oscilloscopes in March 2025 for AI data-center clusters and high-speed optical interconnect testing.
- Hyperscale AI data centers are projected to hold 48.0% share in 2026 owing to large fabrics where transient congestion can strand substantial accelerator capacity.
- Hyperscale engineering groups can integrate switch counters with optical diagnostics and capacity models during qualification for automated production workflows.
How do infrastructure operators evaluate OEM direct within the route to market category?
OEM direct engagement shortens qualification for analytics that depends on switch counters and transceiver diagnostics from one fabric platform. Compatibility with optical communication networks is part of the purchase because cross-layer diagnosis fails if one telemetry source cannot be normalized. OIF documented live multi-vendor interoperability involving 35 member companies in March 2025 for AI and cloud optical networking.
- In 2026, OEM direct is expected to lead route to market with 39.0% share because engineering teams qualify analytics beside the hardware producing its telemetry.
- Direct technical escalation becomes useful during 800G and 1.6T acceptance as routing symptoms and optical faults cross ownership boundaries.
What are the drivers, restraints and opportunities in the GPU Fabric Optical Congestion Analytics Market?
Larger GPU fabrics raise the cost of network variance, fragmented telemetry slows root-cause correlation, and 1.6T deployment expands the need for automated cross-layer diagnosis.
- Driver: Larger AI clusters make short congestion events commercially expensive because one slow path can delay many accelerators working on the same collective job.
- Restraint: Multi-vendor telemetry delays deployment until route state and optical diagnostics describe the same physical path with enough consistency for automation.
- Opportunity: 1.6T qualification can attach software spend to analytics that links physical margin with topology and capacity decisions during pre-production acceptance.
Higher link speeds and larger clusters make network waiting more expensive for AI operators during collective workloads. Open industrial Ethernet standards make congestion behavior observable enough for software to recommend corrective actions. The Ultra Ethernet Consortium documented Broadcom’s Thor Ultra 800G AI Ethernet NIC in October 2025 with packet-level multipathing and programmable congestion control. Analytics revenue follows where operators require evidence that routing policy protects usable GPU time.
Integration becomes the binding restraint once topology records and optical evidence originate from different vendors. Effective network monitoring must map traffic symptoms to the same route that produced BER or FEC evidence. The Ethernet Alliance’s March 2025 OFC program paired live multi-vendor Ethernet interoperability with congestion-control testing, confirming why inconsistent telemetry models extend validation work.
The 1.6T transition gives analytics vendors a defined point to automate tests engineers still correlate manually. Commissioning teams often use Data center infrastructure services to produce repeatable evidence before accepting new fabric capacity. Keysight introduced automated 200GE-to-1600GE interconnect validation software in March 2025 for AI infrastructure programs, giving analytics platforms a route to attach software revenue to high-speed deployment cycles.
Which country CAGRs are covered in the GPU Fabric Optical Congestion Analytics Market?
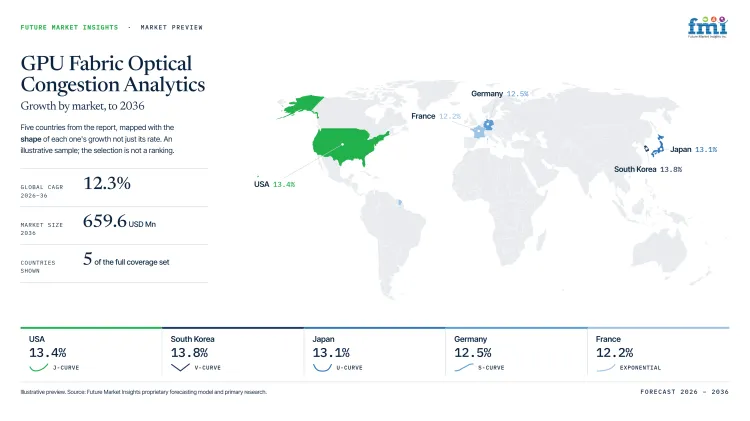
| Country | CAGR |
|---|---|
| South Korea | 13.8% |
| USA | 13.4% |
| Japan | 13.1% |
| UAE | 12.8% |
| Germany | 12.5% |
| France | 12.2% |
How do country-level CAGRs compare in the GPU Fabric Optical Congestion Analytics Market?
A 1.6 percentage-point spread separates South Korea at 13.8% from France at 12.2%. South Korea, the USA and Japan form the upper group because larger compute fleets can justify deeper network diagnostics. UAE and Germany follow closely. France stays in the same investment cycle with slower conversion from planned capacity to activated clusters.
- South Korea's electronics base shortens access to optical expertise.
- USA hyperscalers spread analytics software across large fabric fleets.
- Japan's carrier density supports short service paths for field escalation.
- UAE sovereign projects align analytics specifications during centralized builds.
- Germany's industrial Ethernet expertise reduces multi-vendor integration friction.
- France's interconnect position raises demand for DCI path diagnostics.
Similar CAGRs can hide different qualification and service conditions for analytics vendors. The full report provides country-level CAGR analysis across North America, Latin America, Western Europe, Eastern Europe, East Asia, South Asia and Pacific, and Middle East and Africa.
Country-wise Analysis
- US hyperscalers commission multi-vendor GPU clusters under tight power budgets, so network software must recover usable throughput without hiding physical faults. Gpu fabric optical congestion analytics demand in the USA is forecast to rise at 13.4% CAGR over the forecast period, tied to operators seeking more usable throughput from already powered infrastructure. Lawrence Berkeley National Laboratory estimated in June 2026 that data centers could account for 11.8% of total US electricity use by 2030. Grid queues can postpone cluster activation and inconsistent vendor schemas can extend telemetry normalization during commissioning. Vendors that align analytics with Ethernet access equipment qualification can enter through commissioning work without forcing operators to maintain another isolated monitoring stack.
- Japanese cloud and research operators treat service continuity as a production constraint, so unfamiliar network actions require controlled validation before release. ABCI announced on January 20, 2025 that every ABCI group could use the new ABCI 3.0 node reservation process for next-generation compute service. Adoption of gpu fabric optical congestion analytics in Japan is estimated to expand at 13.1% CAGR through 2036, supported by public compute capacity that requires repeatable fault isolation during active reservations. Conservative change controls can slow multi-vendor rollout even with strong local validation discipline and service expertise. Vendors familiar with routing and Ethernet switching can differentiate by documenting interoperability and maintaining in-country escalation support for production incidents.
- South Korean operators are building shared AI-compute environments that place network observability inside cluster design before throughput problems become visible. The South Korean gpu fabric optical congestion analytics sector is projected to record 13.8% CAGR during the assessment period, reflecting rapid public GPU deployment and clustered infrastructure planning. Existing network practices can slow integration if new clusters expose telemetry formats that operations teams cannot normalize quickly. The Ministry of Science and ICT announced in May 2025 a plan to secure 10,000 advanced GPUs by year-end with phased deployment beginning in October. Early reference deployments will depend on pre-deployment validation plus clearly assigned fault-escalation ownership between infrastructure teams.
- French data-center developers sequence network commissioning against grid access to avoid idling AI hardware before a site reaches planned load. The French economy ministry documented in May 2025 that 28 additional data-center sites had been identified beyond 35 announced earlier and four sites received accelerated grid-connection treatment. Power and construction timing can postpone network acceptance even with a commercially active project pipeline. Gpu fabric optical congestion analytics sales in France are forecast to expand at 12.2% CAGR by 2036, given phased cluster activation and site-readiness planning. Staged capacity models fit France’s site-by-site activation pattern without assuming one commissioning schedule for every facility.
- German research and sovereign-compute operators require documented performance evidence before unfamiliar network software enters production use. Germany is estimated to post 12.5% CAGR over the forecast period, linked to research systems that expose complex routing and link-health conditions during scientific workloads. Forschungszentrum Jülich inaugurated JUPITER in September 2025 with roughly 24,000 NVIDIA GH200 Grace Hopper superchips and more than 40 ExaFLOP/s of AI performance. Formal qualification can lengthen deployment even when local research teams have deep validation expertise and mature scientific monitoring systems. Analytics vendors can win acceptance by publishing repeatable fault-isolation evidence that fits existing scientific monitoring workflows during production qualification.
- UAE AI infrastructure purchasing is concentrated in large campuses that coordinate compute and network plans with security and power requirements at each deployment stage. The Abu Dhabi Media Office announced in May 2025 that Stargate UAE would operate inside the newly established 5-gigawatt UAE-US AI Campus. Secure multi-vendor operations impose data-access and integration constraints that can complicate commissioning for shared infrastructure teams. In the UAE, gpu fabric optical congestion analytics demand is predicted to advance at 12.8% CAGR through 2036 since concentrated infrastructure can use a common telemetry policy. Campus projects therefore favor staged acceptance and policy-controlled telemetry that preserves existing security boundaries during shared infrastructure operations.
Who are the notable companies in the GPU Fabric Optical Congestion Analytics Market?
AP Sensing, EXFO, Corning, and VIAVI Solutions are notable companies serving different layers of the gpu fabric optical congestion analytics field.
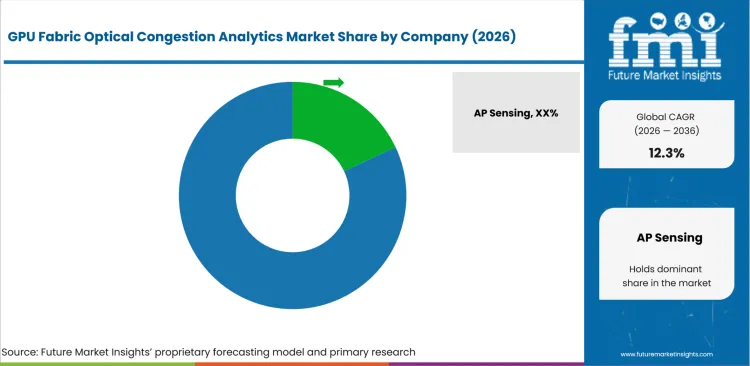
Competition depends on the telemetry layer each company can observe during troubleshooting and qualification. VIAVI Solutions and EXFO focus on network validation during commissioning and high-speed acceptance testing. AP Sensing covers distributed fiber condition analytics, and Corning supplies connectivity that determines physical path complexity.
- VIAVI Solutions focuses on AI-fabric traffic and high-speed Ethernet validation with current 800G and 1.6T test activity.
- EXFO focuses on optical testing where BER and FEC analysis support fiber certification and network fault isolation.
- AP Sensing provides distributed fiber condition data, and Corning supplies optical connectivity that determines physical path complexity during fault isolation.
Competitive Benchmarking: GPU Fabric Optical Congestion Analytics Market
| Company | Fabric traffic insight | Optical diagnostic depth | AI data center relevance | Geographic reach |
|---|---|---|---|---|
| AP Sensing | Low | High | Medium | Europe and international projects |
| EXFO | Medium | High | High | Global |
| Corning | Low | Medium | High | Global |
| VIAVI Solutions | High | High | High | Global |
Key Developments in the GPU Fabric Optical Congestion Analytics Market
- In April 2025, EXFO introduced the BA-1600 Bit Analyzer, a lab-to-fabrication 1.6T electrical BER tester supporting PAM4 coding up to 8 channels at 224G, linked to the industry's transition to 1.6T component and transceiver manufacturing.
- In May 2025, Corning announced a Broadcom collaboration for optical components in the 51.2 Tbps Bailly co-packaged-optics Ethernet switch platform as AI fabrics move toward denser optical integration.
- In March 2026, VIAVI Solutions launched the TestCenter D2 1.6T Appliance to validate backend network performance before cloud and hyperscale operators place new fabric capacity into production.
Key Players in the GPU Fabric Optical Congestion Analytics Market
AI Fabric and Optical Validation
- EXFO
- VIAVI Solutions
Fiber Condition Analytics
- AP Sensing
Optical Connectivity Infrastructure
- Corning
GPU Fabric Optical Congestion Analytics Market - Report Scope
| Coverage field | Report scope |
|---|---|
| Market breakdown | By link speed, software function, deployment location, data center type, route to market, and region. |
| Quantitative Units | Revenue in USD million and CAGR in %. |
| Market Definition | Revenue includes software licenses, subscriptions, analytics modules, and directly attributable implementation services used to detect, diagnose, optimize, or plan optical congestion and link health in GPU fabrics. Hardware-only test revenue and unrelated network management are excluded. |
| Regions Covered | North America, Latin America, Western Europe, Eastern Europe, East Asia, South Asia and Pacific, and Middle East and Africa. |
| Countries Covered | South Korea, USA, Japan, UAE, Germany, France, and 20+ countries included in the full report. |
| Key Companies | AP Sensing, EXFO, Corning, VIAVI Solutions. |
| Forecast Period | 2026 to 2036. |
| Approach | Primary and secondary research with market triangulation. |
GPU Fabric Optical Congestion Analytics Market - Research Methodology
| Method | Approach |
|---|---|
| Primary Research | FMI analysts gathered input from manufacturers, service providers, technology developers, distributors, end users, procurement teams, and subject-matter experts. Interviews examined purchasing decisions, product or service evaluation, adoption barriers, approval requirements, pricing considerations, and expectations for technical or commercial support. Respondents were also asked what evidence is required before a trial, pilot, or initial order develops into regular purchasing. |
| Desk Research | Desk research covered government statistics, regulatory publications, trade data, industry associations, technical literature, standards, company filings, product information, and official corporate announcements. Sources were reviewed for relevance, publication date, geographic coverage, and consistency with the defined market scope. Claims relating to performance, applications, approvals, capacity, investment, and commercial activity were retained only when supported by credible public evidence. |
| Market Sizing and Forecasting | The market model combined the baseline value with historical performance, segment structure, pricing and volume indicators, adoption levels, company participation, and country-level demand conditions. Forecast assumptions considered economic activity, investment trends, regulatory developments, technology adoption, purchasing cycles, supply availability, and barriers to wider market use. Segment and regional estimates were reconciled before the final market total was calculated. |
| Data Validation | Estimates were checked against multiple independent indicators, including public data, company activity, trade patterns, industry developments, and findings from primary interviews. Validation also tested whether products, services, applications, and company revenues fell within the defined market boundaries. Adjacent categories, unsupported claims, overlapping revenues, and activities without direct market relevance were excluded to reduce double counting and maintain consistency across segments and countries. |
GPU Fabric Optical Congestion Analytics Market by Segments
GPU Fabric Optical Congestion Analytics Market segmented by Link Speed:
- 800G
- 400G
- 1.6T
- 3.2T and above
GPU Fabric Optical Congestion Analytics Market segmented by Software Function:
- Topology & path optimization
- Link-margin analytics
- Fault localization
- Power-budget automation
- Capacity planning
GPU Fabric Optical Congestion Analytics Market segmented by Deployment Location:
- Inter-rack - scale-out
- Intra-rack - scale-up
- Spine-leaf fabric
- Campus - DCI
GPU Fabric Optical Congestion Analytics Market segmented by Data Center Type:
- Hyperscale AI data centers
- Colocation AI facilities
- Enterprise AI - HPC
- Research - sovereign compute
GPU Fabric Optical Congestion Analytics Market segmented by Route to Market:
- OEM direct
- Network system integrators
- Fiber - cabling specialists
- Test & managed-service providers
GPU Fabric Optical Congestion Analytics Market by Region:
- North America
- United States
- Canada
- Latin America
- Brazil
- Mexico
- Argentina
- Chile
- Western Europe
- Germany
- France
- United Kingdom
- Italy
- Spain
- Benelux
- Nordics
- Eastern Europe
- Poland
- Czech Republic
- Romania
- Hungary
- East Asia
- China
- Japan
- South Korea
- South Asia and Pacific
- India
- ASEAN
- Australia and New Zealand
- Middle East and Africa
- GCC Countries
- South Africa
- Türkiye
- Israel
Research Sources and Bibliography
- Ultra Ethernet Consortium. (2025, June 11). Ultra Ethernet Consortium (UEC) launches Specification 1.0 transforming Ethernet for AI and HPC at scale.
- International Energy Agency. (2025, April 10). Energy and AI: Energy demand from AI.
- Ethernet Alliance. (2025, March 17). 2025 Ethernet Alliance Roadmap.
- Ultra Ethernet Consortium. (2026, January 28). Specification history.
- Keysight Technologies. (2025, April 1). Keysight unveils architecture for scaling AI data centers.
- Keysight Technologies. (2025, March 25). Keysight’s new sampling oscilloscopes revolutionize 1.6T transceiver optical testing for AI data centers.
- OIF. (2025, March 12). OIF advances interoperability at OFC 2025 with live demos, expert insights and cross-industry collaboration.
- Ultra Ethernet Consortium. (2025, October 31). UEC Steering Member Broadcom’s Thor Ultra 800G NIC: What it means for UEC.
- Ethernet Alliance. (2025, March 17). Ethernet Alliance showcases future-ready Ethernet innovation at OFC 2025.
- Keysight Technologies. (2025, March 26). Keysight debuts 1.6T platform and software to automate validation of network interconnect performance.
- Lawrence Berkeley National Laboratory. (2026, June). United States Data Center Energy Usage Report: 2025 Update.
- ABCI. (2025, January 20). Notice on how to reserve nodes for ABCI 3.0.
- Ministry of Science and ICT, Republic of Korea. (2025, May 26). Government unveils plan to secure 10,000 advanced GPUs and launch CSP recruitment.
- Ministry of the Economy, Finance and Industrial and Digital Sovereignty, France. (2025, May 20). Sommet Choose France 2025.
- Forschungszentrum Jülich. (2025, September 5). Grand ceremony marks the launch of the Exascale Supercomputer JUPITER.
- Abu Dhabi Media Office. (2025, May 22). Global Tech Alliance launches Stargate UAE.
- EXFO. (2025, April 1). EXFO showcases industry’s first lab to fabrication 1.6T TEST solution.
- Corning Incorporated. (2025, May 13). Corning collaborates with Broadcom to accelerate AI data center processing capacity.
- VIAVI Solutions Inc. (2026, March 12). VIAVI launches TestCenter D2 1.6T Appliance to accelerate AI infrastructure rollouts across hyperscale and cloud data center environments.
- AP Sensing. (2025, September 22). More Space for Innovation: AP Sensing expands headquarters.
- AP Sensing. (2026, February 2). AP Sensing and Ampacimon join forces to advance overhead line monitoring and grid capacity optimization.
- AP Sensing. (2026, March 6). AP Sensing contributes fiber optic sensing technology to Germany’s Netz33 infrastructure project.
- AP Sensing. (2026, June 25). AP Sensing and Sterlumiq partner to advance intelligent monitoring of power cable networks.
- EXFO. (2025, February 3). EXFO responds to AI-driven usage demands on fiber-dense data centers with innovative test solution.
- EXFO. (2025, September 30). Advanced OTDR part of comprehensive hollow core fiber-capable EXFO test solutions portfolio ensuring reliable high speed, low latency interconnect.
- Corning Incorporated. (2026, March 31). Corning and Meta celebrate start of construction on cable manufacturing expansion in North Carolina to support AI buildout.
- Corning Incorporated. (2026, June 8). Amazon announces agreement with Corning to boost USA fiber optics manufacturing, creating 1,000 advanced manufacturing jobs in North Carolina.
- Corning Incorporated. (2026, March 11). Corning expands AI data center connectivity portfolio with PRIZM TMT technology.
- VIAVI Solutions Inc. (2025, September 25). VIAVI expands ONE LabPro ONE-1600 1.6Tb testing and validation platform.
- VIAVI Solutions Inc. (2026, June 23). VIAVI launches industry's first validation solution for Ultra Ethernet Transport, accelerating AI data center deployments.
- VIAVI Solutions Inc. (2025, March 18). VIAVI adds 800G module to the OneAdvisor 800 family of field testers.
This bibliography is provided for reader reference and is not exhaustive. The full report contains the complete reference list and detailed citations.
This Report Answers
- How large is the gpu fabric optical congestion analytics market through 2036?
- Which operating conditions increase commercial value for cross-layer congestion diagnosis?
- Why does 800G account for 38.0% of link speed demand in 2026?
- How does topology & path optimization shape routing and capacity decisions?
- Why does inter-rack - scale-out represent 36.0% of deployment demand in 2026?
- How do country growth rates differ among the six covered markets?
- Which companies cover fabric validation, optical diagnostics, sensing and connectivity?
- Which telemetry constraints can delay multi-vendor GPU fabric deployment?
Frequently Asked Questions
How big is the gpu fabric optical congestion analytics market in 2026?
The gpu fabric optical congestion analytics market is valued at USD 206.8 million in 2026 and is projected to reach USD 659.6 million by 2036. Larger accelerator clusters raise the cost of network inefficiencies that leave expensive compute capacity underused.
What is the CAGR of the gpu fabric optical congestion analytics market from 2026 to 2036?
The gpu fabric optical congestion analytics market is projected to grow at a CAGR of 12.3% between 2026 and 2036. Higher-speed AI fabrics require faster separation of route congestion from optical-link impairment during production workloads.
Which link speed leads the gpu fabric optical congestion analytics market?
The 800G segment is expected to hold 38.0% of the gpu fabric optical congestion analytics market in 2026, driven by current AI-fabric deployments. Operators need diagnostics that remain useful as planned migration toward 1.6T increases optical-link density.
Which software function holds a major 2026 share in the gpu fabric optical congestion analytics market?
The topology & path optimization segment is expected to hold 26.0% of the gpu fabric optical congestion analytics market in 2026, attributable to route imbalance affecting collective communication. The function converts telemetry into bounded routing decisions before engineers approve physical capacity changes.
Which countries record the covered growth rates in the gpu fabric optical congestion analytics market?
South Korea is projected to grow at 13.8% CAGR through 2036 as public compute capacity expands. The USA follows at 13.4% and Japan at 13.1% as local infrastructure and qualification conditions shape adoption.
Which companies are active in the gpu fabric optical congestion analytics market?
Key companies in the gpu fabric optical congestion analytics market include AP Sensing and EXFO alongside Corning and VIAVI Solutions. Their roles cover distributed fiber condition analytics and high-speed validation with optical connectivity supplying physical path context.
Preview the report firsthand - request a free sample
Get SampleGet the brochure for pricing and purchase details.
Get PDFTable of Content
- Key Takeaways
- Market Size and CAGR
- Top Growth Driver
- Fastest Growing Segment
- Leading Region
- Key Companies
- Emerging Opportunities
- Executive Summary
- Global Market Outlook
- Demand-side Trends
- Supply-side Trends
- Technology Roadmap Analysis
- Analysis and Recommendations
- Analyst Perspective (What is happening? Why now? What should investors know?)
- Key Questions Answered
- How large is the market?
- What is the CAGR?
- What are key trends?
- Which region dominates?
- Who are the leaders?
- Market Overview
- Market Coverage / Taxonomy
- Market Definition / Scope / Limitations
- Research Methodology
- Chapter Orientation
- Analytical Lens and Working Hypotheses
- Market Structure, Signals, and Trend Drivers
- Benchmarking and Cross-market Comparability
- Market Sizing, Forecasting, and Opportunity Mapping
- Research Design and Evidence Framework
- Desk Research Programme (Secondary Evidence)
- Expert Input and Fieldwork (Primary Evidence)
- Tooling, Models, and Reference Databases
- Data Engineering and Model Build
- Quality Assurance and Audit Trail
- Market Background
- Market Dynamics (Drivers, Restraints, Opportunity, Trends)
- Scenario Forecast (Optimistic, Likely, Conservative)
- Impact Analysis
- AI Impact
- Sustainability Impact
- Regulatory Impact
- Technology Impact
- Consumer / Buyer Analysis
- Purchase Drivers
- Adoption Barriers
- Buyer Journey
- Opportunity Map Analysis
- Product Life Cycle Analysis
- Supply Chain Analysis
- Investment Feasibility Matrix
- Value Chain Analysis
- PESTLE and Porter's Analysis
- Regulatory Landscape
- Regional Parent Market Outlook
- Production and Consumption Statistics
- Import and Export Statistics
- Global Market Analysis and Forecast, 2021 to 2036
- Historical Market Size Value (USD Million) Analysis, 2021 to 2025
- Current and Future Market Size Value (USD Million) Projections, 2026 to 2036
- Y-o-Y Growth Trend Analysis
- Absolute $ Opportunity Analysis
- Global Market Pricing Analysis, 2021 to 2036
- Global Market Analysis and Forecast, By Link Speed, 2021 to 2036
- Introduction / Key Findings
- Historical Market Size Value (USD Million) Analysis By Link Speed, 2021 to 2025
- Current and Future Market Size Value (USD Million) Analysis and Forecast By Link Speed, 2026 to 2036
- 800G
- 400G
- 1.6T
- 3.2T and above
- 800G
- Y-o-Y Growth Trend Analysis By Link Speed, 2021 to 2025
- Absolute $ Opportunity Analysis By Link Speed, 2026 to 2036
- Global Market Analysis and Forecast, By Software Function, 2021 to 2036
- Introduction / Key Findings
- Historical Market Size Value (USD Million) Analysis By Software Function, 2021 to 2025
- Current and Future Market Size Value (USD Million) Analysis and Forecast By Software Function, 2026 to 2036
- Topology & path optimization
- Link-margin analytics
- Fault localization
- Power-budget automation
- Capacity planning
- Topology & path optimization
- Y-o-Y Growth Trend Analysis By Software Function, 2021 to 2025
- Absolute $ Opportunity Analysis By Software Function, 2026 to 2036
- Global Market Analysis and Forecast, By Deployment Location, 2021 to 2036
- Introduction / Key Findings
- Historical Market Size Value (USD Million) Analysis By Deployment Location, 2021 to 2025
- Current and Future Market Size Value (USD Million) Analysis and Forecast By Deployment Location, 2026 to 2036
- Inter-rack / scale-out
- Intra-rack / scale-up
- Spine-leaf fabric
- Campus / DCI
- Inter-rack / scale-out
- Y-o-Y Growth Trend Analysis By Deployment Location, 2021 to 2025
- Absolute $ Opportunity Analysis By Deployment Location, 2026 to 2036
- Global Market Analysis and Forecast, By Data Center Type, 2021 to 2036
- Introduction / Key Findings
- Historical Market Size Value (USD Million) Analysis By Data Center Type, 2021 to 2025
- Current and Future Market Size Value (USD Million) Analysis and Forecast By Data Center Type, 2026 to 2036
- Hyperscale AI data centers
- Colocation AI facilities
- Enterprise AI/HPC
- Research / sovereign compute
- Hyperscale AI data centers
- Y-o-Y Growth Trend Analysis By Data Center Type, 2021 to 2025
- Absolute $ Opportunity Analysis By Data Center Type, 2026 to 2036
- Global Market Analysis and Forecast, By Route to Market, 2021 to 2036
- Introduction / Key Findings
- Historical Market Size Value (USD Million) Analysis By Route to Market, 2021 to 2025
- Current and Future Market Size Value (USD Million) Analysis and Forecast By Route to Market, 2026 to 2036
- OEM direct
- Network system integrators
- Fiber/cabling specialists
- Test & managed-service providers
- OEM direct
- Y-o-Y Growth Trend Analysis By Route to Market, 2021 to 2025
- Absolute $ Opportunity Analysis By Route to Market, 2026 to 2036
- Global Market Analysis and Forecast, By Region, 2021 to 2036
- Introduction
- Historical Market Size Value (USD Million) Analysis By Region, 2021 to 2025
- Current Market Size Value (USD Million) Analysis and Forecast By Region, 2026 to 2036
- North America
- Latin America
- Western Europe
- Eastern Europe
- East Asia
- South Asia and Pacific
- Middle East & Africa
- Market Attractiveness Analysis By Region
- North America Market Analysis and Forecast, By Country, 2021 to 2036
- Historical Market Size Value (USD Million) Trend Analysis By Market Taxonomy, 2021 to 2025
- Market Size Value (USD Million) Forecast By Market Taxonomy, 2026 to 2036
- By Country
- USA
- Canada
- By Link Speed
- By Software Function
- By Deployment Location
- By Data Center Type
- By Route to Market
- By Country
- Market Attractiveness Analysis
- By Country
- By Link Speed
- By Software Function
- By Deployment Location
- By Data Center Type
- By Route to Market
- Key Takeaways
- Latin America Market Analysis and Forecast, By Country
- Historical Market Size Value (USD Million) Trend Analysis By Market Taxonomy, 2021 to 2025
- Market Size Value (USD Million) Forecast By Market Taxonomy, 2026 to 2036
- By Country
- Brazil
- Mexico
- Chile
- Rest of Latin America
- By Link Speed
- By Software Function
- By Deployment Location
- By Data Center Type
- By Route to Market
- By Country
- Market Attractiveness Analysis
- By Country
- By Link Speed
- By Software Function
- By Deployment Location
- By Data Center Type
- By Route to Market
- Key Takeaways
- Western Europe Market Analysis and Forecast, By Country
- Historical Market Size Value (USD Million) Trend Analysis By Market Taxonomy, 2021 to 2025
- Market Size Value (USD Million) Forecast By Market Taxonomy, 2026 to 2036
- By Country
- Germany
- UK
- Italy
- Spain
- France
- Nordic
- BENELUX
- Rest of Western Europe
- By Link Speed
- By Software Function
- By Deployment Location
- By Data Center Type
- By Route to Market
- By Country
- Market Attractiveness Analysis
- By Country
- By Link Speed
- By Software Function
- By Deployment Location
- By Data Center Type
- By Route to Market
- Key Takeaways
- Eastern Europe Market Analysis and Forecast, By Country
- Historical Market Size Value (USD Million) Trend Analysis By Market Taxonomy, 2021 to 2025
- Market Size Value (USD Million) Forecast By Market Taxonomy, 2026 to 2036
- By Country
- Russia
- Poland
- Hungary
- Balkan & Baltic
- Rest of Eastern Europe
- By Link Speed
- By Software Function
- By Deployment Location
- By Data Center Type
- By Route to Market
- By Country
- Market Attractiveness Analysis
- By Country
- By Link Speed
- By Software Function
- By Deployment Location
- By Data Center Type
- By Route to Market
- Key Takeaways
- East Asia Market Analysis and Forecast, By Country
- Historical Market Size Value (USD Million) Trend Analysis By Market Taxonomy, 2021 to 2025
- Market Size Value (USD Million) Forecast By Market Taxonomy, 2026 to 2036
- By Country
- China
- Japan
- South Korea
- By Link Speed
- By Software Function
- By Deployment Location
- By Data Center Type
- By Route to Market
- By Country
- Market Attractiveness Analysis
- By Country
- By Link Speed
- By Software Function
- By Deployment Location
- By Data Center Type
- By Route to Market
- Key Takeaways
- South Asia and Pacific Market Analysis and Forecast, By Country
- Historical Market Size Value (USD Million) Trend Analysis By Market Taxonomy, 2021 to 2025
- Market Size Value (USD Million) Forecast By Market Taxonomy, 2026 to 2036
- By Country
- India
- ASEAN
- Australia & New Zealand
- Rest of South Asia and Pacific
- By Link Speed
- By Software Function
- By Deployment Location
- By Data Center Type
- By Route to Market
- By Country
- Market Attractiveness Analysis
- By Country
- By Link Speed
- By Software Function
- By Deployment Location
- By Data Center Type
- By Route to Market
- Key Takeaways
- Middle East & Africa Market Analysis and Forecast, By Country
- Historical Market Size Value (USD Million) Trend Analysis By Market Taxonomy, 2021 to 2025
- Market Size Value (USD Million) Forecast By Market Taxonomy, 2026 to 2036
- By Country
- Kingdom of Saudi Arabia
- Other GCC Countries
- Türkiye
- South Africa
- Other African Union
- Rest of Middle East & Africa
- By Link Speed
- By Software Function
- By Deployment Location
- By Data Center Type
- By Route to Market
- By Country
- Market Attractiveness Analysis
- By Country
- By Link Speed
- By Software Function
- By Deployment Location
- By Data Center Type
- By Route to Market
- Key Takeaways
- Key Countries Market Analysis
- USA
- Pricing Analysis
- Market Share Analysis, 2025
- By Link Speed
- By Software Function
- By Deployment Location
- By Data Center Type
- By Route to Market
- Canada
- Pricing Analysis
- Market Share Analysis, 2025
- By Link Speed
- By Software Function
- By Deployment Location
- By Data Center Type
- By Route to Market
- Mexico
- Pricing Analysis
- Market Share Analysis, 2025
- By Link Speed
- By Software Function
- By Deployment Location
- By Data Center Type
- By Route to Market
- Brazil
- Pricing Analysis
- Market Share Analysis, 2025
- By Link Speed
- By Software Function
- By Deployment Location
- By Data Center Type
- By Route to Market
- Chile
- Pricing Analysis
- Market Share Analysis, 2025
- By Link Speed
- By Software Function
- By Deployment Location
- By Data Center Type
- By Route to Market
- Germany
- Pricing Analysis
- Market Share Analysis, 2025
- By Link Speed
- By Software Function
- By Deployment Location
- By Data Center Type
- By Route to Market
- UK
- Pricing Analysis
- Market Share Analysis, 2025
- By Link Speed
- By Software Function
- By Deployment Location
- By Data Center Type
- By Route to Market
- Italy
- Pricing Analysis
- Market Share Analysis, 2025
- By Link Speed
- By Software Function
- By Deployment Location
- By Data Center Type
- By Route to Market
- Spain
- Pricing Analysis
- Market Share Analysis, 2025
- By Link Speed
- By Software Function
- By Deployment Location
- By Data Center Type
- By Route to Market
- France
- Pricing Analysis
- Market Share Analysis, 2025
- By Link Speed
- By Software Function
- By Deployment Location
- By Data Center Type
- By Route to Market
- India
- Pricing Analysis
- Market Share Analysis, 2025
- By Link Speed
- By Software Function
- By Deployment Location
- By Data Center Type
- By Route to Market
- ASEAN
- Pricing Analysis
- Market Share Analysis, 2025
- By Link Speed
- By Software Function
- By Deployment Location
- By Data Center Type
- By Route to Market
- Australia & New Zealand
- Pricing Analysis
- Market Share Analysis, 2025
- By Link Speed
- By Software Function
- By Deployment Location
- By Data Center Type
- By Route to Market
- China
- Pricing Analysis
- Market Share Analysis, 2025
- By Link Speed
- By Software Function
- By Deployment Location
- By Data Center Type
- By Route to Market
- Japan
- Pricing Analysis
- Market Share Analysis, 2025
- By Link Speed
- By Software Function
- By Deployment Location
- By Data Center Type
- By Route to Market
- South Korea
- Pricing Analysis
- Market Share Analysis, 2025
- By Link Speed
- By Software Function
- By Deployment Location
- By Data Center Type
- By Route to Market
- Russia
- Pricing Analysis
- Market Share Analysis, 2025
- By Link Speed
- By Software Function
- By Deployment Location
- By Data Center Type
- By Route to Market
- Poland
- Pricing Analysis
- Market Share Analysis, 2025
- By Link Speed
- By Software Function
- By Deployment Location
- By Data Center Type
- By Route to Market
- Hungary
- Pricing Analysis
- Market Share Analysis, 2025
- By Link Speed
- By Software Function
- By Deployment Location
- By Data Center Type
- By Route to Market
- Kingdom of Saudi Arabia
- Pricing Analysis
- Market Share Analysis, 2025
- By Link Speed
- By Software Function
- By Deployment Location
- By Data Center Type
- By Route to Market
- Türkiye
- Pricing Analysis
- Market Share Analysis, 2025
- By Link Speed
- By Software Function
- By Deployment Location
- By Data Center Type
- By Route to Market
- South Africa
- Pricing Analysis
- Market Share Analysis, 2025
- By Link Speed
- By Software Function
- By Deployment Location
- By Data Center Type
- By Route to Market
- USA
- Market Structure Analysis
- Competition Dashboard
- Competition Benchmarking
- Market Share Analysis of Top Players
- By Regional
- By Link Speed
- By Software Function
- By Deployment Location
- By Data Center Type
- By Route to Market
- Emerging Startups
- Innovation Benchmarking
- Competition Analysis
- Competition Deep Dive
- AP Sensing
- Overview
- Product Portfolio
- Profitability by Market Segments
- Sales Footprint
- Strategy Overview
- Marketing Strategy
- Product Strategy
- Channel Strategy
- EXFO
- Corning
- VIAVI Solutions
- AP Sensing
- Case Studies
- Success Stories
- Recent Developments
- Competition Deep Dive
- Assumptions & Acronyms Used


