

- Market Size (2026)
- USD 942.9 Mn
- Forecast (2036)
- USD 2232.1 Mn
- CAGR (2026 to 2036)
- 9.0%
How big is Healthcare Provider Workflow Optimization Market in 2026?
USD 942.9 million in 2026 and USD 2232.1 million by 2036 at a 9.0% CAGR.
Sales in healthcare provider workflow optimization market are forecast to expand at a 9.0% CAGR, with valuation rising from USD 942.9 million in 2026 to USD 2232.1 million by 2036, supported by provider investment in coordinated digital operations. Growth is supported by health systems seeking fewer handoffs and faster documentation across connected care settings. The same projects also target stronger scheduling control and measurable capacity improvements across complex provider networks. The Office of the Assistant Secretary for Technology Policy reported in February 2026 that 87% of hospitals integrated third-party data for administrative purposes through some method. Investment in healthcare interoperability solutions strengthens the commercial case by reducing interface work across scheduling and clinical operations. Providers therefore evaluate workflow products through measurable time savings and reliable exception handling rather than feature counts alone.
National adoption paths differ across public procurement structures and installed EHR systems in each health system. Data exchange rules and local implementation support further shape provider readiness for workflow programs across health systems. Adoption of healthcare provider workflow optimization solutions in UK is expected to be driven by NHS scheduling digitization and nationwide patient access. NHS England reported in April 2026 that 64% of hospital appointments were visible through the NHS App across every acute trust. Germany and Japan present distinct implementation conditions under national electronic record and provider modernization programs. South Korea adds a government-backed exchange program that shapes integration priorities across tertiary hospitals and provider networks. Digital transformation in healthcare spending supports local projects connecting patient access with staff capacity and clinical records. Commercial success depends on local service capacity and integration discipline rather than headline growth alone across all five countries.
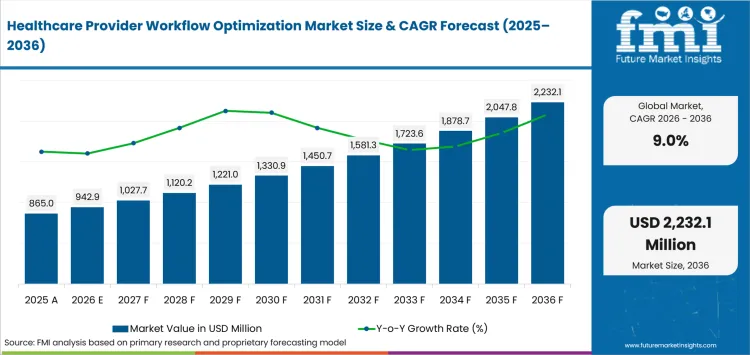
Key Takeaways of Healthcare Provider Workflow Optimization Market
- Demand for healthcare provider workflow optimization is driven by organizations seeking to reduce administrative burden and create reliable operating ownership across clinical services, with measurable time savings supporting continued investment.
- By solution type, clinical workflow management holds the leading share at 41.1% in 2026, attributable to its role coordinating decisions across documentation and care transitions.
- Cloud-based deployment is the dominant deployment mode, holding 42.3% share in 2026, underpinned by centralized updates and scalable access across provider sites.
- Hospitals account for 34.2% end-user share in 2026, owing to complex staffing, patient flow, and cross-department workflow requirements.
- Patient scheduling optimization represents 33.2% application share in 2026, supported by high appointment volumes and visible service gaps, including recurring missed-appointment losses across outpatient services.
- The USA, UK, and Japan record CAGRs of 11.0%, 10.4%, and 9.7% respectively through 2036, while South Korea and Germany follow distinct paths shaped by national exchange infrastructure and mandatory electronic record workflows.
- Competition centers on Epic, Oracle Health, Siemens Healthineers, Philips, GE HealthCare, athenahealth, MEDITECH, and NextGen Healthcare, with vendors differentiating through broad clinical records integration, imaging-centered workflows, hospital command-center software, and ambulatory-focused automation.
Analyst Perspective
The commercial test for workflow optimization tools isn't whether they surface a recommendation but whether that recommendation lands inside a clinician's existing work rather than a separate screen competing for attention. A platform that reduces documentation time on paper can still fail in practice if it creates an unmanaged queue of flagged exceptions nobody owns. Health systems evaluating these tools should measure scheduling outcomes and documentation time as separate financial questions, since a phased rollout that proves out one workflow at a time will generate more defensible evidence than an enterprise launch that changes several processes simultaneously and makes it hard to trace which change drove which result.
- Anurag Sharma, Principal Analyst at Future Market Insights
Source: FMI's proprietary forecasting model and primary research
How is the Healthcare Provider Workflow Optimization Market segmented?
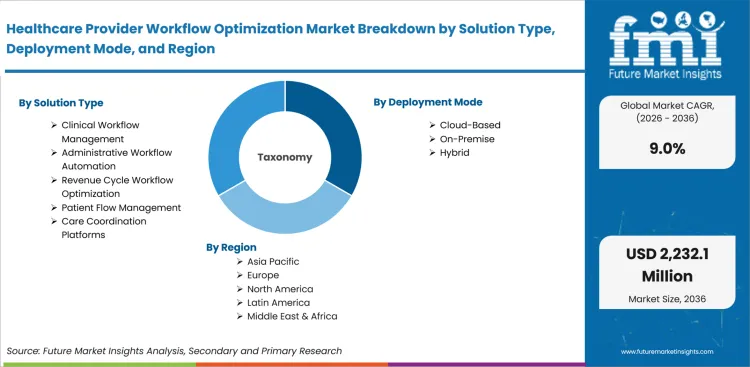
The healthcare provider workflow optimization industry is segmented by solution type, deployment mode, end user, application, and region.
The segmentation framework separates workflow purpose from delivery architecture and the provider setting that controls implementation. Solution type covers clinical management and administrative automation alongside revenue cycle optimization and patient flow systems. Deployment analysis compares cloud-based services with on-premise and hybrid configurations across complex provider technology estates. End-user categories distinguish hospitals from ambulatory centers and specialty clinics alongside long-term care and diagnostic facilities. Application analysis follows patient scheduling and bed management through clinical decision support and documentation automation. Regional analysis examines how health-system structure and local digital policy affect adoption across countries with different purchasing models.
What supports demand for clinical workflow management within the solution type category?
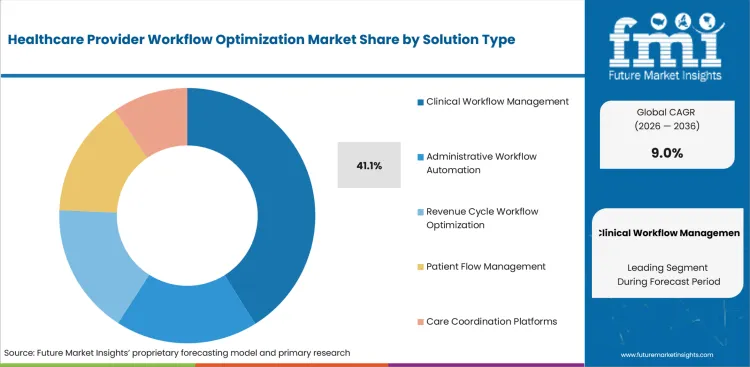
Clinical workflow management connects documentation and care coordination through one governed sequence that keeps decision support and follow-up tasks visible to operational teams. ASTP reported in September 2025 that 71% of hospitals used predictive AI integrated with the EHR during 2024. Investment in clinical decision support systems increases the value of workflow orchestration because recommendations require clear ownership and documented completion. Health systems therefore favor platforms that present the next action inside familiar clinical work rather than a separate analytical screen.
- Clinical Workflow Management is projected to hold 41.1% share in 2026, attributable to its role coordinating decisions across documentation and care transitions.
- Large provider networks adopt these tools to standardize pathways across sites and reduce variation during handoffs. Smaller organizations prioritize configurable templates that limit implementation effort and preserve local clinical responsibility.
Why does cloud-based deployment hold a strong position within the deployment mode category?
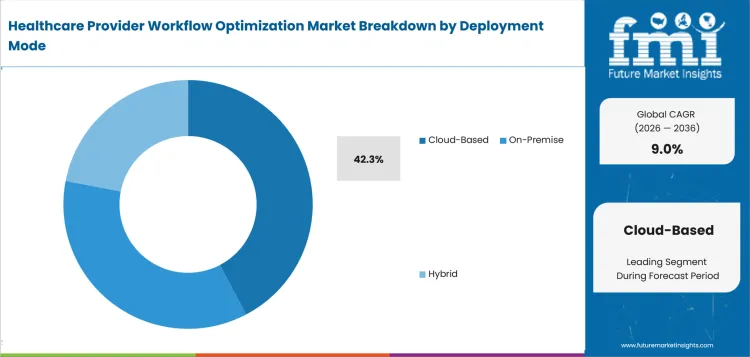
Cloud deployment gives health systems a shared update path across sites while reducing dependence on local server maintenance teams. Centralized services also support consistent security controls across geographically distributed provider locations and affiliated facilities. Royal Philips reported in February 2025 that more than 150 sites across North and Latin America had migrated to its cloud-based imaging environment. Broader healthcare cloud infrastructure investment supports workflow products that require frequent releases and centralized security management across distributed facilities. Provider organizations still require contractual clarity covering uptime and data portability alongside local support responsibilities.
- Based on deployment, cloud-based deployment is forecast to represent 42.3% share in 2026, underpinned by centralized updates and scalable access across provider sites.
- Multi-site health systems use cloud contracts to standardize software versions across facilities. Community providers require implementation partners that combine remote maintenance with practical staff training and responsive escalation routes.
How are Hospitals positioned within the end user category?
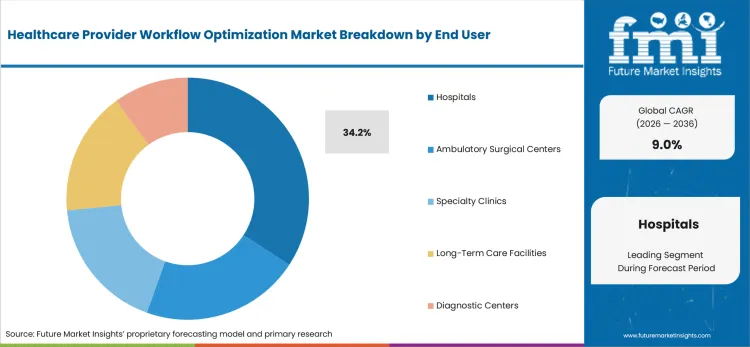
Hospitals coordinate inpatient capacity and clinical documentation across many departments that share staff and physical resources. Workflow failures can therefore delay care across several connected departments and dependent clinical services throughout the hospital. The American Hospital Association reported in February 2026 that the United States contained 6,100 hospitals nationwide during its latest count. The same national count identified 5,121 community hospitals serving local and regional patient populations across the country. Investment in hospital capacity management solutions reinforces demand for tools that connect bed status with staffing and discharge coordination. Hospital executives prioritize products that demonstrate measurable effects across throughput and labor utilization without weakening clinical oversight.
- By end user, hospitals are estimated to account for 34.2% share in 2026, owing to complex patient flow and cross-department workflow requirements.
- Acute-care organizations adopt workflow platforms to coordinate beds and discharge actions across service lines. Purchasing committees also require integration support that protects established clinical records and departmental systems.
What makes patient scheduling optimization important within the application category?
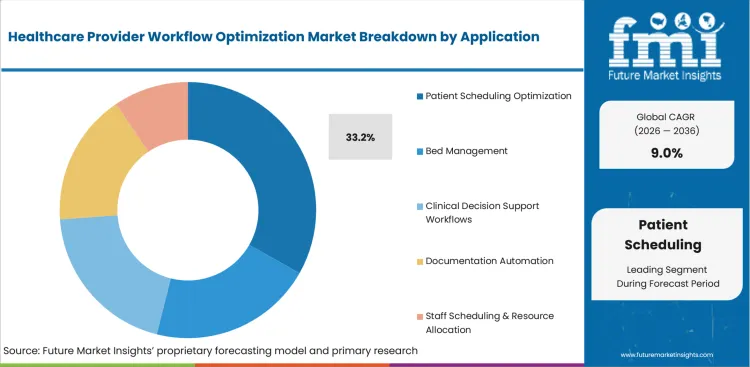
Scheduling determines whether provider capacity becomes a completed visit or an unused appointment slot across outpatient services. Effective systems connect booking changes with reminders and staff availability across every supported clinical service. NHS England reported in March 2026 that patients missed 16 million general-practice appointments during 2025 across 376 million scheduled visits. Patient engagement platforms strengthen scheduling workflows by giving patients clearer options for reminders and appointment changes. Providers need configurable rules that protect urgent access while reducing avoidable cancellations and repetitive telephone work.
- Patient scheduling optimization is predicted to represent a 33.2% share of application revenue in 2026 due to recurring appointment volume and measurable access gaps.
- Ambulatory organizations adopt self-service scheduling to reduce call-center pressure and release cancelled slots faster. Hospitals require deeper rules covering referrals and specialty capacity across connected departments.
What are the drivers, restraints, and opportunities in the Healthcare Provider Workflow Optimization Market?
Administrative burden and fragmented information are increasing demand for governed workflow systems, although integration risk and weak implementation ownership can delay adoption.
- Driver: Provider organizations need workflow tools that convert high appointment and documentation volumes into repeatable actions with measurable staff-time improvements.
- Restraint: Integration complexity and cybersecurity exposure can increase implementation burden across systems that already support time-sensitive clinical decisions.
- Opportunity: Standardized APIs create room for workflow platforms that connect payer requirements with clinical and administrative actions inside existing provider systems.
Large service volumes support healthcare analytics investment because providers need evidence that each workflow change improves capacity and completed activity. NHS England Digital reported in January 2026 that 31.9 million general-practice appointments were recorded during December 2025 and 89.4% were attended. The operating scale strengthens demand for tools that identify unused capacity and improve staff allocation across daily scheduling decisions. Health-system leaders therefore approve projects that connect workflow metrics with financial and service outcomes during formal procurement reviews.
Implementation risk limits growth whenever healthcare IT outsourcing arrangements separate technical accountability from clinical ownership across the same operating process. The HHS Office of Inspector General reported in July 2025 that one audited hospital had weaknesses across internet-accessible systems and web applications. Security remediation and interface testing can extend launch schedules across provider organizations with limited technical capacity. Procurement teams reduce this restraint through staged integration and named responsibility for every outstanding exception.
Standardized exchange creates an opportunity for healthcare business intelligence tools that translate payer and clinical data into actionable workflow decisions. CMS announced in May 2026 that 29 healthcare organizations joined an electronic prior-authorization acceleration initiative ahead of 2027 requirements. The program includes health systems and EHR developers working on real-world workflow barriers across manual authorization processes. Vendors can create value through visible status tracking and reliable handoffs between clinical orders and payer responses.
Which country CAGRs are profiled in the Healthcare Provider Workflow Optimization Market?
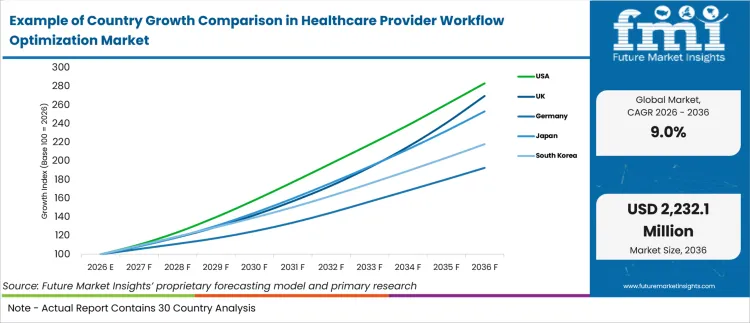
| Country | CAGR |
|---|---|
| USA | 11.0% |
| UK | 10.4% |
| Germany | 6.8% |
| Japan | 9.7% |
| South Korea | 8.1% |
How do country-level CAGRs compare in the Healthcare Provider Workflow Optimization Market?
The five-country comparison forms three measured growth bands that reflect different health-system structures and digital implementation conditions. The USA and UK occupy the upper band while Japan follows closely behind those two markets. South Korea sits in the middle range and Germany records the most measured expansion among the listed countries.
- The USA and UK combine mature digital infrastructure with large provider organizations that can fund enterprise workflow programs across multiple facilities.
- Japan remains near the upper band despite uneven electronic record adoption between major hospitals and smaller provider organizations nationwide.
- South Korea benefits from strong tertiary-hospital connectivity although integration with established domestic information systems remains essential for adoption.
- Germany advances at a measured pace under a mandatory electronic patient record program that requires practical workflow changes across many practices.
- The 4.2 percentage-point spread separates adoption speeds without determining project quality or provider readiness inside any individual country.
Similar growth rates can conceal different procurement routes and service requirements across national health systems. Local implementation capacity remains decisive for software selection and sustained use across each provider environment.
Country-wise Analysis
- United States health systems combine large hospital networks with mature EHR estates and direct vendor implementation teams. The USA is forecast to expand at 11.0% CAGR from 2026 to 2036, supported by system-scale investment in scheduling and clinical operations. ASTP reported in September 2025 that predictive AI adoption reached 86% among system-affiliated hospitals but 37% among independent hospitals during 2024. Enterprise software licenses and managed cloud contracts provide established maintenance routes across complex multi-site health systems. Vendor training programs and direct integration support reduce rollout risk for centralized health networks during phased deployments. Independent and rural hospitals face tighter budgets and thinner technical teams, which slows adoption despite national interoperability standards.
- England’s public health system purchases digital workflow tools through trust-level programs and nationally coordinated service priorities. The UK is projected to post 10.4% CAGR during the forecast period, reinforced by national patient-access and appointment modernization. NHS England reported in April 2026 that 41 million people were registered with the NHS App for records and appointment services. Trust technology teams and contracted implementation suppliers provide sustained support through established public-sector purchasing and maintenance routes. Central funding priorities create a direct adoption enabler for coordinated deployments across acute trusts and specialized services. Legacy interfaces and local approval cycles remain material frictions for consistent deployment across every service line.
- Germany’s mandatory electronic patient record requirement creates a defined operating condition for practices and hospitals across statutory healthcare. The German market is forecast to record 6.8% CAGR through 2036, influenced by nationwide ePA use and gradual provider modernization. The Federal Ministry of Health stated in April 2025 that nationwide ePA rollout began on April 29 and mandatory provider use started October 1. Local EHR companies and certified infrastructure partners provide installation and maintenance services across hospitals and community practices. Mandatory data entry creates a direct adoption enabler for workflow tools connected to patient records. Strict security requirements and numerous legacy practice systems increase integration effort across smaller provider organizations during implementation.
- Japanese provider organizations combine advanced hospital systems with a substantial group of smaller facilities that retain limited digital capacity. Japan is projected to advance at 9.7% CAGR by 2036, shaped by Medical DX programs and demand for lower-cost cloud-native records. Japan’s Ministry of Health, Labour and Welfare reported in March 2026 that EHR adoption reached 65.6% in general hospitals and 55.0% in clinics. The ministry also identified high costs and limited IT familiarity as major barriers among nonadopters. Domestic software vendors and regional systems companies provide configuration and follow-up support for hospitals and community providers. National standardization creates a direct enabler although small-facility budgets remain the central commercial friction across implementation programs.
- South Korea’s tertiary hospitals operate within a dense digital infrastructure supported by national certification and health-information exchange programs. South Korea is projected to expand at 8.1% CAGR between 2026 and 2036, supported by broader institutional connectivity and provider modernization. The Ministry of Health and Welfare announced in February 2025 that the Health Information Highway program targeted connections across all 47 tertiary hospitals. Hospital groups purchase workflow systems through domestic technology companies and direct enterprise contracts covering implementation and maintenance. National exchange infrastructure provides a direct enabler for longitudinal data use across participating hospitals and connected institutions. Custom hospital interfaces and specialized training requirements create material frictions during deployment and long-term maintenance programs.
Who are the notable companies in the Healthcare Provider Workflow Optimization Market?
Epic Systems Corporation, Oracle Health, Siemens Healthineers, Philips, GE HealthCare, athenahealth, MEDITECH, and NextGen Healthcare are notable companies shaping this market.
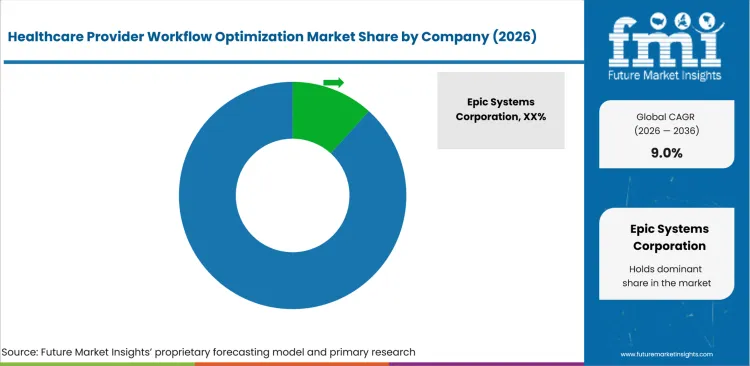
Competition covers enterprise electronic medical records alongside specialized operational tools for imaging and hospital capacity decisions. Product breadth matters less than verified workflow depth and available service support across the provider settings defined by this market. The market is characterized by the presence of established healthcare IT vendors alongside specialized workflow optimization solution providers competing on platform capabilities and scalability.
- Companies are focusing on enhancing workflow automation and administrative efficiency to strengthen their competitive positioning.
- Competition is influenced by vendors’ ability to integrate solutions with electronic health record (EHR) systems and other healthcare information platforms.
- Market participants are emphasizing AI-enabled analytics and cloud-based deployment capabilities to differentiate their offerings.
- Strategic collaborations with healthcare providers, payers and technology partners remain important for expanding market reach and customer adoption.
Vendors with comprehensive solution portfolios and ongoing support services are generally better positioned to address evolving provider requirements.
Competitive Benchmarking: Healthcare Provider Workflow Optimization Market
| Company | Clinical Workflow Management | Administrative Workflow Automation | Integration and Interoperability | Geographic Reach |
|---|---|---|---|---|
| Epic Systems Corporation | High | High | High | Global |
| Oracle Health | High | High | High | Global |
| Siemens Healthineers | High | Low | High | Global |
| Philips | High | Low | Medium | Global |
| GE HealthCare | Medium | High | Medium | Global |
| athenahealth | High | High | Medium | United States |
| MEDITECH | High | Medium | High | North America and Australia |
| NextGen Healthcare | High | High | High | United States |
Key Developments in the Healthcare Provider Workflow Optimization Market
- In February 2026, Oracle Health expanded Clinical AI Agent with automated draft orders across laboratory tests and imaging studies. The release also covered prescriptions and follow-up appointments inside the same clinical workflow for participating clinicians. Oracle reported more than 200,000 clinician documentation hours saved since the agent launched in the United States.
- In March 2026, GE HealthCare announced that its Command Center was operating across three hospitals in Melbourne. The platform provides real-time visibility into resources and workforce availability across the three connected hospital facilities. Hospital leaders use the operating view to anticipate capacity requirements and coordinate patient flow decisions.
- In October 2025, athenahealth introduced AI-native practice and revenue cycle capabilities within the athenaOne platform. The company designed the features to reduce administrative work by more than 50% across front-office and back-office processes. Automated insurance selection and authorization agents connect administrative activity with existing ambulatory workflows across participating practices.
- In March 2025, MEDITECH introduced workflow advancements across its established Traverse Exchange interoperability network for participating health systems. The company reported 73 United States health systems live across more than 250 facilities and 35 states. New FHIR-based workflows organize external patient data inside the clinician’s normal record view during routine care.
Key Players in the Healthcare Provider Workflow Optimization Market
Enterprise EHR and Workflow Platform Providers
- Epic Systems Corporation
- Oracle Health
- MEDITECH
Hospital Operations and Clinical Informatics Providers
- Siemens Healthineers
- Philips
- GE HealthCare
Ambulatory Workflow Platform Providers
- athenahealth
- NextGen Healthcare
Healthcare Provider Workflow Optimization Market - Report Scope
| Coverage field | Report scope |
|---|---|
| Market breakdown | Solution Type, Deployment Mode, End User, Application, and region. |
| Market Definition | Software platforms and related services that coordinate clinical and administrative tasks across healthcare provider workflows. |
| Regions Covered | North America, Latin America, Western Europe, Eastern Europe, East Asia, South Asia and Pacific, and Middle East and Africa. |
| Countries Covered | USA, UK, Germany, Japan, and South Korea. |
| Key Companies Profiled | Epic Systems Corporation, Oracle Health, Siemens Healthineers, Philips, GE HealthCare, athenahealth, MEDITECH, and NextGen Healthcare. |
| Forecast Period | 2026 to 2036. |
| Approach | Hybrid bottom-up and top-down market sizing supported by provider workflow analysis, official desk research, and structured industry input. |
Healthcare Provider Workflow Optimization Market - Research Methodology
| Method | Approach |
|---|---|
| Primary Research | FMI analysts gathered input from manufacturers, service providers, technology developers, distributors, end users, sourcing teams, and subject-matter experts. Interviews examined purchasing decisions, product or service evaluation, adoption barriers, approval requirements, pricing considerations, and expectations for technical or commercial support. Respondents were also asked what evidence is required before a trial, pilot, or initial order develops into regular purchasing. |
| Desk Research | Desk research covered government statistics, regulatory publications, trade data, industry associations, technical literature, standards, company filings, product information, and official corporate announcements. Sources were reviewed for relevance, publication date, geographic coverage, and consistency with the defined market scope. Claims relating to performance, applications, approvals, capacity, investment, and commercial activity were retained only when supported by credible public evidence. |
| Market Sizing and Forecasting | The market model combined the baseline value with historical performance, segment structure, pricing and volume indicators, adoption levels, company participation, and country-level demand conditions. Forecast assumptions considered economic activity, investment trends, regulatory developments, technology adoption, purchasing cycles, supply availability, and barriers to wider market use. Segment and regional estimates were reconciled before the final market total was calculated. |
| Data Validation | Estimates were checked against multiple independent indicators, including public data, company activity, trade patterns, industry developments, and findings from primary interviews. Validation also tested whether products, services, applications, and company revenues fell within the defined market boundaries. Adjacent categories, unsupported claims, overlapping revenues, and activities without direct market relevance were excluded to reduce double counting and maintain consistency across segments and countries. |
Healthcare Provider Workflow Optimization Market by Segments
Healthcare Provider Workflow Optimization Market segmented by Solution Type:
- Clinical Workflow Management
- Administrative Workflow Automation
- Revenue Cycle Workflow Optimization
- Patient Flow Management
- Care Coordination Platforms
Healthcare Provider Workflow Optimization Market segmented by Deployment Mode:
- Cloud-Based
- On-Premise
- Hybrid
Healthcare Provider Workflow Optimization Market segmented by End User:
- Hospitals
- Ambulatory Surgical Centers
- Specialty Clinics
- Long-Term Care Facilities
- Diagnostic Centers
Healthcare Provider Workflow Optimization Market segmented by Application:
- Patient Scheduling Optimization
- Bed Management
- Clinical Decision Support Workflows
- Documentation Automation
- Staff Scheduling & Resource Allocation
Healthcare Provider Workflow Optimization Market by Region:
- North America
- United States
- Canada
- Latin America
- Brazil
- Mexico
- Argentina
- Chile
- Western Europe
- Germany
- France
- United Kingdom
- Italy
- Spain
- Benelux
- Nordics
- Eastern Europe
- Poland
- Czech Republic
- Romania
- Hungary
- East Asia
- China
- Japan
- South Korea
- South Asia and Pacific
- India
- ASEAN
- Australia and New Zealand
- Middle East and Africa
- GCC Countries
- South Africa
- Türkiye
- Israel
Research Sources and Bibliography
- Office of the Assistant Secretary for Technology Policy. (2026, February). Hospital Use of APIs to Enable Data Sharing between EHRs and Third-Party Technology.
- Office of the Assistant Secretary for Technology Policy. (2025, September). Hospital Trends in the Use, Evaluation, and Governance of Predictive AI, 2023-2024.
- American Hospital Association. (2026, February). Fast Facts on USA Hospitals, 2026.
- NHS England. (2026, April 28). Hospital Patients Can Now Check Appointments in the NHS App.
- NHS England. (2026, March 2). NHS Urges “Tap the App” as 1 in 4 Miss Appointments.
- NHS England Digital. (2026, January 29). Appointments in General Practice, December 2025.
- Federal Ministry of Health, Germany. (2025, April 28). ePA für alle startet morgen.
- Ministry of Health, Labour and Welfare, Japan. (2026, March 12). Minutes of the 28th Working Group on the Use of Health, Medical, and Long-Term Care Information.
- Ministry of Health and Welfare, Republic of Korea. (2025, February 12). Full-Scale Promotion of the Foundation for Health and Medical Data Utilization.
- USA Department of Health and Human Services, Office of Inspector General. (2025, July 2). A Large Northeastern Hospital Could Improve Certain Security Controls for Preventing and Detecting Cyberattacks.
- Centers for Medicare & Medicaid Services. (2026, May 13). CMS Announces Early Adopters to Advance Solutions for Electronic Prior Authorization, Accelerating Momentum Ahead of 2027 Requirements.
- Epic. (2025, April 23). From Documentation to Discovery: AI’s Expanding Role in Healthcare.
- Oracle. (2025, November 18). ONC Certification of Oracle’s AI-Powered EHR Marks Turning Point for the Healthcare Industry.
- Oracle. (2026, February 2). Oracle Health Adds Order Creation Capabilities to Oracle Health Clinical AI Agent to Support Accurate, Complete Records.
- Siemens Healthineers. (n.d.). Intelligent Workflow.
- Royal Philips. (2025, February 27). Philips Expands Cloud-Based Enterprise Imaging Services to Europe for Better Access to AI-Enabled Workflows and Innovation.
- Royal Philips. (2025, February 25). Philips Advances Imaging Innovation with Remote Scanning Capabilities Across Europe.
- GE HealthCare. (2025, October 20). GE HealthCare Collaborates with Two Major Medical Systems to Advance AI Technology Designed to Transform Hospital Operations and Improve Patient Care.
- GE HealthCare. (2026, March 19). GE HealthCare’s Command Center Moves from Concept to Reality at Three Melbourne Hospitals.
- athenahealth. (2025, September 9). athenahealth Unveils Next Generation AI-Native EHR Solution to Simplify Clinician Experience for Ambulatory Practices.
- athenahealth. (2025, October 9). athenahealth Introduces AI-Native athenaOne Practice and Revenue Cycle Management Capabilities Designed to Reduce Practices’ Administrative Work by More than 50%.
- MEDITECH. (2025, March 11). Canadian Healthcare Technology Examines Traverse Exchange Canada’s Impact on Interoperability.
- MEDITECH. (2025, March 4). MEDITECH Announces New Advancements to Traverse Exchange Interoperability Network.
- NextGen Healthcare. (2025, August 27). NextGen Healthcare Achieves HTI-1 Compliance for NextGen Enterprise EHR, Meeting Latest AI, Data and Interoperability Standards.
Bibliography entries identify the external sources used for factual attribution and verification throughout this market assessment. The full report contains additional supporting references and detailed research materials for deeper market evaluation.
This Report Answers
- How large is the healthcare provider workflow optimization market in 2026 and 2036?
- What supports the 9.0% CAGR in the healthcare provider workflow optimization market?
- Why does Clinical Workflow Management hold the largest Solution Type share in 2026?
- Why does Cloud-Based deployment hold the largest Deployment Mode share in 2026?
- How do country growth rates compare across the USA, UK, Germany, Japan, and South Korea?
- Which companies shape the healthcare provider workflow optimization market?
- What limits adoption in the healthcare provider workflow optimization market?
- What evidence should healthcare providers examine during workflow platform selection?
- How do integration and implementation support affect long-term commercial value?
Frequently Asked Questions
How big is the Healthcare Provider Workflow Optimization Market in 2026?
The healthcare provider workflow optimization market is valued at USD 942.9 million in 2026 and is forecast to reach USD 2232.1 million by 2036. Growth reflects health systems seeking fewer handoffs and faster documentation across connected care settings and complex provider networks worldwide.
What is the CAGR of the Healthcare Provider Workflow Optimization Market from 2026 to 2036?
The healthcare provider workflow optimization market grows at a CAGR of 9.0% between 2026 and 2036, supported by provider organizations needing workflow tools that convert high appointment and documentation volumes into repeatable actions with measurable staff-time improvements.
Which solution type leads the Healthcare Provider Workflow Optimization Market?
Clinical workflow management accounts for 41.1% of the healthcare provider workflow optimization market by solution type in 2026, attributable to its role coordinating decisions across documentation and care transitions that keep follow-up tasks visible to operational teams.
How much will the Healthcare Provider Workflow Optimization Market add between 2026 and 2036?
The healthcare provider workflow optimization market is set to add USD 1289.2 million between 2026 and 2036, growing from USD 942.9 million to USD 2232.1 million as clinical workflow management platforms extend across a widening base of hospital and ambulatory care networks.
Who are the leading companies in the Healthcare Provider Workflow Optimization Market?
Five companies lead the healthcare provider workflow optimization market, including Epic Systems, Oracle Health, Siemens Healthineers, Philips, and GE HealthCare, competing through broad clinical records, imaging-centered workflows, and hospital command-center capabilities.
Preview the report firsthand - request a free sample
Get SampleGet the brochure for pricing and purchase details.
Get PDFTable of Content
- Key Takeaways
- Market Size and CAGR
- Top Growth Driver
- Fastest Growing Segment
- Leading Region
- Key Companies
- Emerging Opportunities
- Executive Summary
- Global Market Outlook
- Demand-side Trends
- Supply-side Trends
- Technology Roadmap Analysis
- Analysis and Recommendations
- Analyst Perspective (What is happening? Why now? What should investors know?)
- Key Questions Answered
- How large is the market?
- What is the CAGR?
- What are key trends?
- Which region dominates?
- Who are the leaders?
- Market Overview
- Market Coverage / Taxonomy
- Market Definition / Scope / Limitations
- Research Methodology
- Chapter Orientation
- Analytical Lens and Working Hypotheses
- Market Structure, Signals, and Trend Drivers
- Benchmarking and Cross-market Comparability
- Market Sizing, Forecasting, and Opportunity Mapping
- Research Design and Evidence Framework
- Desk Research Programme (Secondary Evidence)
- Expert Input and Fieldwork (Primary Evidence)
- Tooling, Models, and Reference Databases
- Data Engineering and Model Build
- Quality Assurance and Audit Trail
- Market Background
- Market Dynamics (Drivers, Restraints, Opportunity, Trends)
- Scenario Forecast (Optimistic, Likely, Conservative)
- Impact Analysis
- AI Impact
- Sustainability Impact
- Regulatory Impact
- Technology Impact
- Consumer / Buyer Analysis
- Purchase Drivers
- Adoption Barriers
- Buyer Journey
- Opportunity Map Analysis
- Product Life Cycle Analysis
- Supply Chain Analysis
- Investment Feasibility Matrix
- Value Chain Analysis
- PESTLE and Porter's Analysis
- Regulatory Landscape
- Regional Parent Market Outlook
- Production and Consumption Statistics
- Import and Export Statistics
- Global Market Analysis and Forecast, 2021 to 2036
- Historical Market Size Value (USD Million) Analysis, 2021 to 2025
- Current and Future Market Size Value (USD Million) Projections, 2026 to 2036
- Y-o-Y Growth Trend Analysis
- Absolute $ Opportunity Analysis
- Global Market Pricing Analysis, 2021 to 2036
- Global Market Analysis and Forecast, By Solution Type, 2021 to 2036
- Introduction / Key Findings
- Historical Market Size Value (USD Million) Analysis By Solution Type, 2021 to 2025
- Current and Future Market Size Value (USD Million) Analysis and Forecast By Solution Type, 2026 to 2036
- Clinical Workflow Management
- Administrative Workflow Automation
- Revenue Cycle Workflow Optimization
- Patient Flow Management
- Care Coordination Platforms
- Clinical Workflow Management
- Y-o-Y Growth Trend Analysis By Solution Type, 2021 to 2025
- Absolute $ Opportunity Analysis By Solution Type, 2026 to 2036
- Global Market Analysis and Forecast, By Deployment Mode, 2021 to 2036
- Introduction / Key Findings
- Historical Market Size Value (USD Million) Analysis By Deployment Mode, 2021 to 2025
- Current and Future Market Size Value (USD Million) Analysis and Forecast By Deployment Mode, 2026 to 2036
- Cloud-Based
- On-Premise
- Hybrid
- Cloud-Based
- Y-o-Y Growth Trend Analysis By Deployment Mode, 2021 to 2025
- Absolute $ Opportunity Analysis By Deployment Mode, 2026 to 2036
- Global Market Analysis and Forecast, By End User, 2021 to 2036
- Introduction / Key Findings
- Historical Market Size Value (USD Million) Analysis By End User, 2021 to 2025
- Current and Future Market Size Value (USD Million) Analysis and Forecast By End User, 2026 to 2036
- Hospitals
- Ambulatory Surgical Centers
- Specialty Clinics
- Long-Term Care Facilities
- Diagnostic Centers
- Hospitals
- Y-o-Y Growth Trend Analysis By End User, 2021 to 2025
- Absolute $ Opportunity Analysis By End User, 2026 to 2036
- Global Market Analysis and Forecast, By Application, 2021 to 2036
- Introduction / Key Findings
- Historical Market Size Value (USD Million) Analysis By Application, 2021 to 2025
- Current and Future Market Size Value (USD Million) Analysis and Forecast By Application, 2026 to 2036
- Patient Scheduling Optimization
- Bed Management
- Clinical Decision Support Workflows
- Documentation Automation
- Staff Scheduling & Resource Allocation
- Patient Scheduling Optimization
- Y-o-Y Growth Trend Analysis By Application, 2021 to 2025
- Absolute $ Opportunity Analysis By Application, 2026 to 2036
- Global Market Analysis and Forecast, By Region, 2021 to 2036
- Introduction
- Historical Market Size Value (USD Million) Analysis By Region, 2021 to 2025
- Current Market Size Value (USD Million) Analysis and Forecast By Region, 2026 to 2036
- North America
- Latin America
- Western Europe
- Eastern Europe
- East Asia
- South Asia and Pacific
- Middle East & Africa
- Market Attractiveness Analysis By Region
- North America Market Analysis and Forecast, By Country, 2021 to 2036
- Historical Market Size Value (USD Million) Trend Analysis By Market Taxonomy, 2021 to 2025
- Market Size Value (USD Million) Forecast By Market Taxonomy, 2026 to 2036
- By Country
- USA
- Canada
- By Solution Type
- By Deployment Mode
- By End User
- By Application
- By Country
- Market Attractiveness Analysis
- By Country
- By Solution Type
- By Deployment Mode
- By End User
- By Application
- Key Takeaways
- Latin America Market Analysis and Forecast, By Country
- Historical Market Size Value (USD Million) Trend Analysis By Market Taxonomy, 2021 to 2025
- Market Size Value (USD Million) Forecast By Market Taxonomy, 2026 to 2036
- By Country
- Brazil
- Mexico
- Chile
- Rest of Latin America
- By Solution Type
- By Deployment Mode
- By End User
- By Application
- By Country
- Market Attractiveness Analysis
- By Country
- By Solution Type
- By Deployment Mode
- By End User
- By Application
- Key Takeaways
- Western Europe Market Analysis and Forecast, By Country
- Historical Market Size Value (USD Million) Trend Analysis By Market Taxonomy, 2021 to 2025
- Market Size Value (USD Million) Forecast By Market Taxonomy, 2026 to 2036
- By Country
- Germany
- UK
- Italy
- Spain
- France
- Nordic
- BENELUX
- Rest of Western Europe
- By Solution Type
- By Deployment Mode
- By End User
- By Application
- By Country
- Market Attractiveness Analysis
- By Country
- By Solution Type
- By Deployment Mode
- By End User
- By Application
- Key Takeaways
- Eastern Europe Market Analysis and Forecast, By Country
- Historical Market Size Value (USD Million) Trend Analysis By Market Taxonomy, 2021 to 2025
- Market Size Value (USD Million) Forecast By Market Taxonomy, 2026 to 2036
- By Country
- Russia
- Poland
- Hungary
- Balkan & Baltic
- Rest of Eastern Europe
- By Solution Type
- By Deployment Mode
- By End User
- By Application
- By Country
- Market Attractiveness Analysis
- By Country
- By Solution Type
- By Deployment Mode
- By End User
- By Application
- Key Takeaways
- East Asia Market Analysis and Forecast, By Country
- Historical Market Size Value (USD Million) Trend Analysis By Market Taxonomy, 2021 to 2025
- Market Size Value (USD Million) Forecast By Market Taxonomy, 2026 to 2036
- By Country
- China
- Japan
- South Korea
- By Solution Type
- By Deployment Mode
- By End User
- By Application
- By Country
- Market Attractiveness Analysis
- By Country
- By Solution Type
- By Deployment Mode
- By End User
- By Application
- Key Takeaways
- South Asia and Pacific Market Analysis and Forecast, By Country
- Historical Market Size Value (USD Million) Trend Analysis By Market Taxonomy, 2021 to 2025
- Market Size Value (USD Million) Forecast By Market Taxonomy, 2026 to 2036
- By Country
- India
- ASEAN
- Australia & New Zealand
- Rest of South Asia and Pacific
- By Solution Type
- By Deployment Mode
- By End User
- By Application
- By Country
- Market Attractiveness Analysis
- By Country
- By Solution Type
- By Deployment Mode
- By End User
- By Application
- Key Takeaways
- Middle East & Africa Market Analysis and Forecast, By Country
- Historical Market Size Value (USD Million) Trend Analysis By Market Taxonomy, 2021 to 2025
- Market Size Value (USD Million) Forecast By Market Taxonomy, 2026 to 2036
- By Country
- Kingdom of Saudi Arabia
- Other GCC Countries
- Türkiye
- South Africa
- Other African Union
- Rest of Middle East & Africa
- By Solution Type
- By Deployment Mode
- By End User
- By Application
- By Country
- Market Attractiveness Analysis
- By Country
- By Solution Type
- By Deployment Mode
- By End User
- By Application
- Key Takeaways
- Key Countries Market Analysis
- USA
- Pricing Analysis
- Market Share Analysis, 2025
- By Solution Type
- By Deployment Mode
- By End User
- By Application
- Canada
- Pricing Analysis
- Market Share Analysis, 2025
- By Solution Type
- By Deployment Mode
- By End User
- By Application
- Mexico
- Pricing Analysis
- Market Share Analysis, 2025
- By Solution Type
- By Deployment Mode
- By End User
- By Application
- Brazil
- Pricing Analysis
- Market Share Analysis, 2025
- By Solution Type
- By Deployment Mode
- By End User
- By Application
- Chile
- Pricing Analysis
- Market Share Analysis, 2025
- By Solution Type
- By Deployment Mode
- By End User
- By Application
- Germany
- Pricing Analysis
- Market Share Analysis, 2025
- By Solution Type
- By Deployment Mode
- By End User
- By Application
- UK
- Pricing Analysis
- Market Share Analysis, 2025
- By Solution Type
- By Deployment Mode
- By End User
- By Application
- Italy
- Pricing Analysis
- Market Share Analysis, 2025
- By Solution Type
- By Deployment Mode
- By End User
- By Application
- Spain
- Pricing Analysis
- Market Share Analysis, 2025
- By Solution Type
- By Deployment Mode
- By End User
- By Application
- France
- Pricing Analysis
- Market Share Analysis, 2025
- By Solution Type
- By Deployment Mode
- By End User
- By Application
- India
- Pricing Analysis
- Market Share Analysis, 2025
- By Solution Type
- By Deployment Mode
- By End User
- By Application
- ASEAN
- Pricing Analysis
- Market Share Analysis, 2025
- By Solution Type
- By Deployment Mode
- By End User
- By Application
- Australia & New Zealand
- Pricing Analysis
- Market Share Analysis, 2025
- By Solution Type
- By Deployment Mode
- By End User
- By Application
- China
- Pricing Analysis
- Market Share Analysis, 2025
- By Solution Type
- By Deployment Mode
- By End User
- By Application
- Japan
- Pricing Analysis
- Market Share Analysis, 2025
- By Solution Type
- By Deployment Mode
- By End User
- By Application
- South Korea
- Pricing Analysis
- Market Share Analysis, 2025
- By Solution Type
- By Deployment Mode
- By End User
- By Application
- Russia
- Pricing Analysis
- Market Share Analysis, 2025
- By Solution Type
- By Deployment Mode
- By End User
- By Application
- Poland
- Pricing Analysis
- Market Share Analysis, 2025
- By Solution Type
- By Deployment Mode
- By End User
- By Application
- Hungary
- Pricing Analysis
- Market Share Analysis, 2025
- By Solution Type
- By Deployment Mode
- By End User
- By Application
- Kingdom of Saudi Arabia
- Pricing Analysis
- Market Share Analysis, 2025
- By Solution Type
- By Deployment Mode
- By End User
- By Application
- Türkiye
- Pricing Analysis
- Market Share Analysis, 2025
- By Solution Type
- By Deployment Mode
- By End User
- By Application
- South Africa
- Pricing Analysis
- Market Share Analysis, 2025
- By Solution Type
- By Deployment Mode
- By End User
- By Application
- USA
- Market Structure Analysis
- Competition Dashboard
- Competition Benchmarking
- Market Share Analysis of Top Players
- By Regional
- By Solution Type
- By Deployment Mode
- By End User
- By Application
- Emerging Startups
- Innovation Benchmarking
- Competition Analysis
- Competition Deep Dive
- Epic Systems Corporation
- Overview
- Product Portfolio
- Profitability by Market Segments
- Sales Footprint
- Strategy Overview
- Marketing Strategy
- Product Strategy
- Channel Strategy
- Oracle Health (Cerner)
- Siemens Healthineers
- Philips Healthcare
- McKesson Corporation
- GE HealthCare Technologies Inc.
- Athenahealth, Inc.
- Meditech
- NextGen Healthcare
- Allscripts Healthcare Solutions
- Epic Systems Corporation
- Case Studies
- Success Stories
- Recent Developments
- Competition Deep Dive
- Assumptions & Acronyms Used


