

- Market Size (2026)
- USD 1030.0 Mn
- Forecast (2036)
- USD 1777.8 Mn
- CAGR (2026 to 2036)
- 5.6%
How big is Heap Leach Additives Market in 2026?
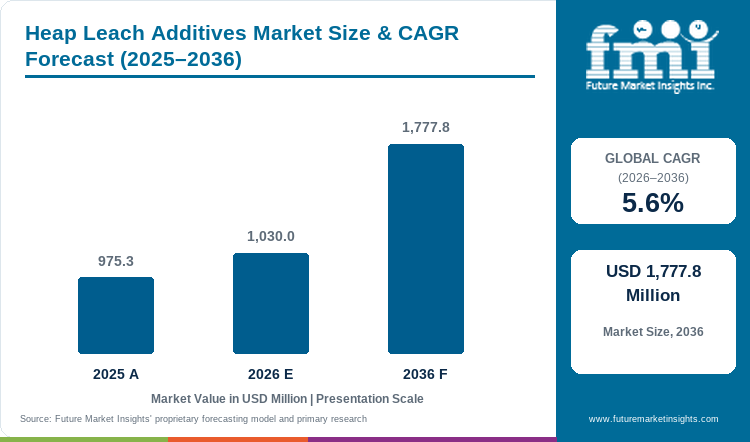
USD 1,030.0 million in 2026 and USD 1,777.8 million by 2036, expanding at 5.6% CAGR.
Demand for heap leach additives is projected to expand at 5.6% CAGR from 2026 to 2036. Valuation grows from USD 975.3 million in 2025 to USD 1,030.0 million in 2026 and reaches USD 1,777.8 million by 2036. Mine teams test additives when variable ore or poor solution contact cuts metal recovery. In June 2025, Ivanhoe Electric filed a study for the Santa Cruz Copper Project. The study uses a 100% heap-leach route and includes metallurgical tests. The project explains why mines want proof on the pad before repeat orders. Mines also test surfactant chemistry when they need better wetting control.
Australia is set to grow faster than Germany because it has more active copper projects. This creates more mine-site tests and repeat supply needs. Germany depends more on chemical engineering and overseas raw-material projects. In December 2025, Australia’s Office of the Chief Economist put metallic copper exports at 865 kt for 2025-26. More active mines give suppliers more chances to run local trials. In Germany, project sponsors and engineering groups often test the chemistry before a mine uses it.
Key Takeaways
- Mine teams test heap additives to recover more metal from variable ore without rebuilding the full leach process.
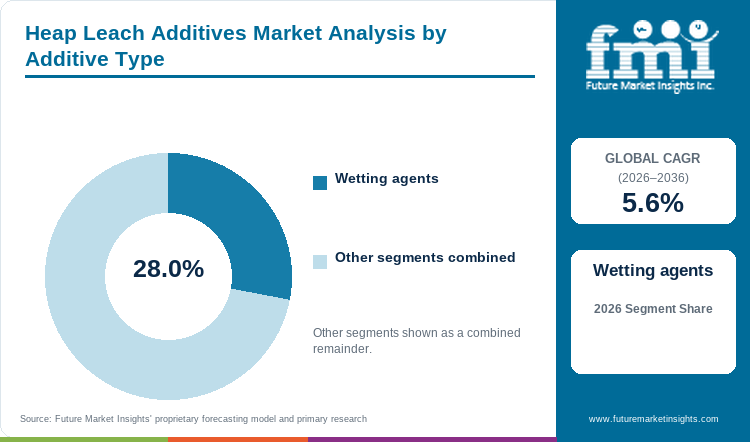
- By additive type, wetting agents are estimated to hold 28.0% in 2026 because mines need even contact between ore and leach solution.
- In 2026, copper ores are expected to lead ore type with 36.0% share because mines must keep solution moving and metal dissolving.
- By application, leach kinetics improvement is forecast to represent 30.0% in 2026. Faster recovery can free pad space sooner for the next ore load.
- Ore tests and heap-safety checks slow the move from lab results to repeat orders.
- Some of the key players in this market include BASF, Solvay, Clariant, Kemira, Orica, SNF, Syensqo, Solenis, Nalco Water, an Ecolab company, and Chevron Phillips Chemical.
Analyst Perspective
“A heap additive earns repeat business only after ore tests show a clear recovery or operating gain at the mine site. The gain must not harm solution flow. Suppliers can move from a column test to routine pad use faster when chemistry, field tests and local service work together.”
- Nikhil Kaitwade, Principal Consultant, Future Market Insights
How is the heap leach additives market segmented?
The heap leach additives market is segmented by Additive Type, Ore Type, Application, End Use, Sales Channel, and Region.
The heap leach additives market has five main ways to group demand, plus region. Additive type covers wetting agents, permeability enhancers, agglomeration aids, anti-scalants and bioleach enhancers. Ore type covers copper, gold, uranium, nickel/cobalt and mixed oxide ores. Application covers leach kinetics, solution distribution, ore agglomeration, scale control and recovery improvement. End use covers copper mines, gold mines, uranium operations, battery metal projects and pilot leach pads. Sales channels cover mining chemical suppliers, direct mine contracts, EPC/process consultants and distributors.
How do wetting agents shape demand within the additive type category?
Wetting agents help leach liquid reach more of the ore. Fine or packed ore can slow that flow. In May 2026, CSIRO described automated heap-leach columns used before mine-scale work. The columns track pH, redox potential, temperature and conductivity. These tests help mine teams compare wetting with normal flow. Similar dosing work also uses industrial water treatment methods to feed and track chemicals in a controlled way.
- Based on additive type, wetting agents are projected to account for 28.0% in 2026. Mines use them to spread leach solution more evenly.
- Mine teams test wetting chemistry for flow and recovery. They also check how it works with later process steps before full-heap use.
What supports copper ores within the ore type category?
Copper heaps need good ore clumps, steady solution contact and steady metal flow. Ore conditions can change during a mine run. A March 2025 SEC-filed report for the Yerington Copper Project said BioHeap tests were underway. Early copper recovery approached 80% before full process optimization. The result shows why ore type and test design can change the chemical mix before full-scale dosing. Mines may also use antiscalants and dispersants when salts or fine solids cause flow problems.
- By ore type, copper ores are estimated to hold 36.0% in 2026. Copper heaps need repeat control of flow, metal dissolving and solution handling.
- Copper projects can test a chemical in columns and then track copper output. This gives suppliers a clear way to measure value.
What drives leach kinetics improvement within the application category?
Leach kinetics means the speed at which metal leaves the ore. Slow leaching keeps metal in the pad for longer. It also delays reuse of stacking space. Dakota Gold said in September 2026 that 24 master-composite column tests at Richmond Hill ran for 21 to 47 days. Gold recovery reached up to 92.0%. Mine teams still compare speed with reagent use and effects on later steps. Some gold projects may also compare non-cyanide leaching reagents when the process can use another leach solution.
- In 2026, leach kinetics improvement is expected to lead application with 30.0% share. Shorter leach cycles can free pad space sooner.
- Faster recovery pays only if the extra metal covers the cost of chemicals, tests, handling and process changes.
How do copper mines influence selection within the end use category?
Copper mines can use additives during agglomeration, irrigation, bioleaching and solution control. Each step can need its own test. Rio Tinto said in December 2025 that Nuton bioleaching had produced first copper at Johnson Camp in Arizona. The trial uses a heap-leach pad. It targets about 30,000 tonnes of refined copper over four years. This keeps chemical choices tied to measured copper recovery instead of total mine output.
- By end use, copper mines are forecast to represent 37.0% in 2026. Long heap runs need repeat work to protect recovery.
- Field teams retest the dose when ore type, water rate or microbes change the known recovery result.
Why do mining chemical suppliers lead the sales channel category?
Mining chemical suppliers do more than ship products. They can run lab tests and give dosing advice. They can also hold local stock and fix site problems. In May 2025, Nalco Water described custom mineral-processing tests and real-time data for lithium extraction. Heap customers use a similar service model because ore response can change by site or mine run. Suppliers that already support flocculants and coagulants or mine-water programs can respond faster during site tests.
- Mining chemical suppliers are set to lead sales channel with 41.0% share in 2026. Their field help and local stock support this position.
- Direct mine contracts still matter for large users. Service-heavy work favors suppliers that can change the chemical dose during site tests.
What are the drivers, restraints and opportunities in the Heap Leach Additives Market?
Lower ore grades raise recovery pressure, site-specific qualification slows adoption, and monitored brownfield interventions provide a practical route to additional demand.
- Driver: Lower-grade and variable ores increase additive demand. Mines use these products to protect solution contact, flow and metal recovery.
- Restraint: Heap safety, water control and fit with later process steps add more testing before routine use.
- Opportunity: Better test tools and targeted dosing can treat weak heap zones. Mines can use smaller, measured chemical programs.
Lower ore grades raise the value of additives that help protect metal recovery from an existing pad. The U.S. Geological Survey said in February 2026 that lower ore grades affected copper output at several U.S. mines in 2025. Mine teams test chemistry on the actual ore instead of assuming one dose will work everywhere. Polyacrylamide chemistry can help with agglomeration or water control in nearby process steps. Each heap still needs its own proof of recovery and solution flow.
Testing takes longer when an additive could change solution flow, water balance or heap behavior. In April 2026, the Government of Yukon said it was putting all 56 Eagle Gold review recommendations into action. The review did not name additives as the cause. It did raise the proof needed for changes that affect monitoring or solution flow. Suppliers therefore need staged column tests, controlled pad trials and full fit records before repeat dosing. Similar limits also affect water treatment chemicals used near process-water circuits.
Existing and approved heap projects give additives a clear opening. Operators can measure one problem before changing a full pad. In July 2025, the U.S. Bureau of Land Management approved the Spring Valley Gold Mine in Nevada. The project includes a heap-leach facility. New and expanded sites can include tests and monitoring from the start. Suppliers can then use controlled dosing and clear targets instead of one general reagent package.
Which country CAGRs are profiled in the Heap Leach Additives Market?
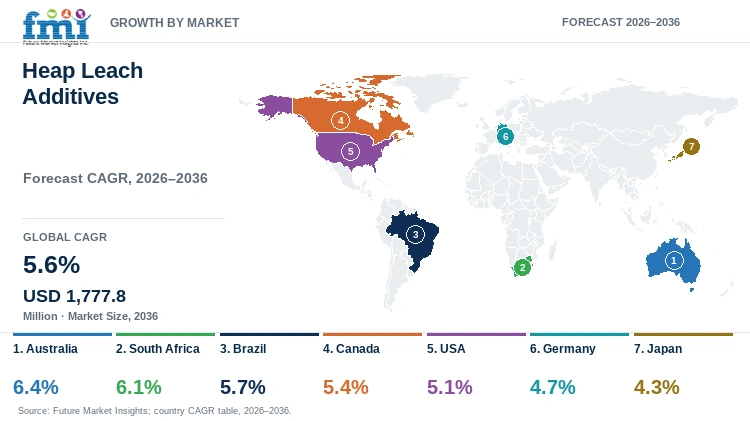
| Country | CAGR |
|---|---|
| Australia | 6.4% |
| South Africa | 6.1% |
| Brazil | 5.7% |
| Canada | 5.4% |
| USA | 5.1% |
| Germany | 4.7% |
| Japan | 4.3% |
How do country-level CAGRs compare in the Heap Leach Additives Market?
Australia and South Africa form the upper growth group, followed by Brazil and Canada. The USA is in the middle of the displayed range. Germany and Japan grow more slowly. The 2.1 percentage-point gap shows forecast speed, not current market size. Each country turns mining activity into additive orders through a different technical and commercial route.
- Australia turns large mine programs into direct field trials. Local service and stock help a good trial move into repeat orders.
- South Africa has skilled metallurgical testing teams. Their work can move a formula from lab columns into a mine-site program.
- Brazil has copper, nickel and gold projects. New heap chemistry often enters buying plans only after staged technical studies.
- Canada has strong mineral exploration and strict reviews of water and heap stability. Suppliers therefore face new demand and a higher proof bar.
- The USA has new copper and gold projects plus detailed permits. Suppliers must tie each chemical change to a measured mine result.
- Germany gets more heap-leach demand from chemical skills and overseas raw-material projects than from domestic heap mines.
- Japan relies on resource-security partnerships and engineering channels. Suppliers need clear records. They also need overseas technical work to reach these projects.
Similar CAGRs can still lead to different buying conditions because mine numbers, project stage and approval routes vary by country. The full report gives country-level CAGR analysis for North America, Latin America, Western Europe, Eastern Europe, East Asia, South Asia and Pacific, and the Middle East and Africa.
Country-wise Analysis
- U.S. copper mines are dealing with lower ore grades while new heap projects move through design and permits. Demand for heap leach additives in the USA is forecast to expand at 5.1% CAGR through 2036, linked to recovery work on variable ore. The U.S. Geological Survey said in February 2026 that lower ore grades affected output at several U.S. copper mines in 2025. Suppliers still need site-specific column tests and pad trials before routine use.
- Germany gets heap-leach demand from chemical suppliers, engineering groups and overseas critical-mineral projects. By 2036, Germany is projected to grow at 4.7% CAGR. The outlook is linked to overseas raw-material investment. KfW said in July 2026 that the Raw Materials Fund had made its first two investments. Suppliers need clear test records that German project sponsors can pass to the mine.
- Japanese demand comes from trading houses, engineering groups and public programs that secure minerals from overseas mines. By 2036, Japan is projected to grow at 4.3% CAGR. The outlook is linked to overseas copper work. JOGMEC said in December 2025 that it signed an agreement with CODELCO on copper-impurity technology. Additive suppliers need clear test data and records that Japanese sponsors can use before mine trials.
- Australian mines give suppliers a large base for field tests and restocking. By 2036, Australia is projected to grow at 6.4% CAGR, supported by active copper projects and mine expansion. In December 2025, the Office of the Chief Economist put metallic copper exports at 948 kt for 2026-27. Remote mines still need local stock, quick support and trial plans that cover changes in water and ore.
- Brazil is expanding geological work on copper, nickel, gold and other critical minerals. Some of these projects may use future leach tests. By 2036, Brazil is projected to grow at 5.7% CAGR. The outlook is tied to a wider project pipeline. The Ministry of Mines and Energy said in December 2025 that PlanGEO 2026-2035 gives priority to 145 areas for deeper study. Suppliers need local support and staged ore tests before this pipeline turns into repeat additive orders.
- Canada has strong gold and base-metal exploration plus strict reviews of water and heap stability. By 2036, Canada is projected to grow at 5.4% CAGR. The outlook is linked to continued project review. Natural Resources Canada said in April 2026 that precious metals made up 50% of 2025 exploration and deposit-appraisal spending. Base metals made up 27%. Remote sites favor suppliers that can prove chemical fit, monitoring and emergency support before routine dosing.
- South Africa has established mines and strong metallurgical test skills for site-specific trials. By 2036, South Africa is projected to grow at 6.1% CAGR. The outlook is linked to mining activity and local technical support. Statistics South Africa said in February 2026 that the copper production index rose 16.1% in Q4 2025 from Q3 2025. Mine-funded use still needs local service, water control and a clear recovery gain.
Who are the notable companies in the Heap Leach Additives Market?
BASF, Solvay, Clariant, Kemira, Orica, SNF, Syensqo, Solenis, Nalco Water, an Ecolab company, and Chevron Phillips Chemical are active within the defined heap leach additives and closely linked mineral-processing chemistry boundary.
Some firms sell chemicals used inside heap leaching. Others focus on polymers, water treatment or later metal-recovery steps. BASF and Solvay document chemicals used in copper heap leaching. Syensqo and Chevron Phillips Chemical cover later extraction and solvent systems. Mine sites may also buy mining lubricants and process chemicals from the same local channels. A new supplier needs the right chemical and enough site support to run mine trials.
- BASF and Solvay provide direct leach chemistry. Syensqo supplies downstream solvent extraction reagents used after the heap step. These reagents can affect how the full solution circuit works.
- Clariant and Orica sell mining chemicals for flotation and copper work. Their product lines overlap with mining flotation chemicals used in nearby ore-processing steps.
- Kemira, SNF, Solenis and Nalco Water sell polymers and products for water and solids control. These products can work beside heap-leach chemicals in larger mine programs.
Competitive Benchmarking: Heap Leach Additives Market
| Company | Direct Heap-Leach Chemistry | Flow and Water Control | Field Application Support | Geographic Reach |
|---|---|---|---|---|
| BASF | High | Medium | High | Global |
| Solvay | High | Medium | Medium | Global |
| Clariant | Low | Medium | High | Global |
| Kemira | Low | High | High | Global |
| Orica | Medium | Low | High | Global |
| SNF | Low | High | High | Global |
| Syensqo | Medium | Medium | High | Global |
| Solenis | Low | High | High | Global |
| Nalco Water, an Ecolab company | Low | High | High | Global |
| Chevron Phillips Chemical | Low | Low | Medium | Global |
Scoring basis: High means public evidence shows a chemical used inside heap leaching. Medium means a related metal-recovery chemical that affects the solution circuit. Low means a chemical used in a nearby ore-processing step. High flow and water control needs proof of mining polymers, anti-scalants or water-treatment systems. Field support ratings use proof of tests, dosing help or mine support. Geographic Reach shows where a firm works and is not scored.
Key Developments in the Heap Leach Additives Market
- In April 2026, Orica bought the Danafloat range from FMC Corporation. The deal added copper-processing chemicals to Orica’s Specialty Mining Chemicals portfolio.
- In February 2025, Clariant Mining Solutions showed new chemicals at SME MINEXCHANGE. The chemicals were for copper recovery from secondary sulfides with clay.
- In June 2025, BASF and FUCHS signed a cooperation deal in Australia. BASF kept direct sales of Hydromet products such as LixTRA and Solutrix.
Key Players in the Heap Leach Additives Market
Direct leach and hydrometallurgical chemistry
- BASF
- Solvay
- Syensqo
- Chevron Phillips Chemical
Mining and copper-processing chemistry
- Clariant
- Orica
Polymer, water and solids-control suppliers
- Kemira
- SNF
- Solenis
- Nalco Water, an Ecolab company
Heap Leach Additives Market - Report Scope
| Coverage field | Report scope |
|---|---|
| Market breakdown | By additive type, ore type, application, end use, sales channel and region. |
| Quantitative Units | Revenue in USD million and CAGR in %. |
| Market Definition | Specialized chemicals and biological aids supplied to improve wetting, permeability, agglomeration, scale control, leach kinetics or recovery within heap-leach operations. Bulk lixiviants, flotation-only reagents, equipment, EPC revenue and recovered metal value are excluded. |
| Regions Covered | North America, Latin America, Western Europe, Eastern Europe, East Asia, South Asia and Pacific, and Middle East and Africa. |
| Countries Covered | Australia, South Africa, Brazil, Canada, USA, Germany, Japan, and 30+ countries included in the full report. |
| Key Companies Profiled | BASF, Solvay, Clariant, Kemira, Orica, SNF, Syensqo, Solenis, Nalco Water, an Ecolab company, and Chevron Phillips Chemical. |
| Forecast Period | 2026 to 2036. |
| Approach | Primary and secondary research with market triangulation. |
Heap Leach Additives Market - Research Methodology
| Method | Approach |
|---|---|
| Primary Research | FMI analysts gathered input from manufacturers, service providers, technology developers, distributors, end users, procurement teams, and subject-matter experts. Interviews examined purchasing decisions, product or service evaluation, adoption barriers, approval requirements, pricing considerations, and expectations for technical or commercial support. Respondents were also asked what evidence is required before a trial, pilot, or initial order develops into regular purchasing. |
| Desk Research | Desk research covered government statistics, regulatory publications, trade data, industry associations, technical literature, standards, company filings, product information, and official corporate announcements. Sources were reviewed for relevance, publication date, geographic coverage, and consistency with the defined market scope. Claims relating to performance, applications, approvals, capacity, investment, and commercial activity were retained only when supported by credible public evidence. |
| Market Sizing and Forecasting | The market model combined the baseline value with historical performance, segment structure, pricing and volume indicators, adoption levels, company participation, and country-level demand conditions. Forecast assumptions considered economic activity, investment trends, regulatory developments, technology adoption, purchasing cycles, supply availability, and barriers to wider market use. Segment and regional estimates were reconciled before the final market total was calculated. |
| Data Validation | Estimates were checked against multiple independent indicators, including public data, company activity, trade patterns, industry developments, and findings from primary interviews. Validation also tested whether products, services, applications, and company revenues fell within the defined market boundaries. Adjacent categories, unsupported claims, overlapping revenues, and activities without direct market relevance were excluded to reduce double counting and maintain consistency across segments and countries. |
Heap Leach Additives Market by Segments
Heap Leach Additives Market segmented by Additive Type:
- Wetting agents
- Permeability enhancers
- Agglomeration aids
- Anti-scalants
- Bioleach enhancers
Heap Leach Additives Market segmented by Ore Type:
- Copper ores
- Gold ores
- Uranium ores
- Nickel-cobalt ores
- Mixed oxide ores
Heap Leach Additives Market segmented by Application:
- Leach kinetics improvement
- Solution distribution
- Ore agglomeration
- Scale control
- Recovery improvement
Heap Leach Additives Market segmented by End Use:
- Copper mines
- Gold mines
- Uranium operations
- Battery metal projects
- Pilot leach pads
Heap Leach Additives Market segmented by Sales Channel:
- Mining chemical suppliers
- Direct mine contracts
- EPC/process consultants
- Distributors
Heap Leach Additives Market by Region:
- North America
- United States
- Canada
- Latin America
- Brazil
- Mexico
- Argentina
- Chile
- Western Europe
- Germany
- France
- United Kingdom
- Italy
- Spain
- Benelux
- Nordics
- Eastern Europe
- Poland
- Czech Republic
- Romania
- Hungary
- East Asia
- China
- Japan
- South Korea
- South Asia and Pacific
- India
- ASEAN
- Australia and New Zealand
- Middle East and Africa
- GCC Countries
- South Africa
- Türkiye
- Israel
Research Sources and Bibliography
- Ivanhoe Electric Inc. (2025, June 23). Santa Cruz Copper Project preliminary feasibility study and S-K 1300 technical report summary.
- Office of the Chief Economist, Australian Department of Industry, Science and Resources. (2025, December 19). Resources and energy quarterly: December 2025.
- Commonwealth Scientific and Industrial Research Organisation. (2026, May 8). Copper: The metal connecting Australia’s geology to a net zero world.
- U.S. Securities and Exchange Commission. (2025, March 21). Yerington Copper Project S-K 1300 technical report.
- Dakota Gold Corp. (2026, September 10). Dakota Gold reports positive metallurgical test program results informing the Richmond Hill pre-feasibility study.
- Rio Tinto. (2025, December 4). Rio Tinto’s Nuton technology produces first copper.
- Ecolab. (2025, May 6). Powering the future: Ecolab’s expertise in lithium extraction.
- U.S. Geological Survey. (2026, February 6). Mineral commodity summaries 2026.
- Government of Yukon. (2026, April 16). Yukon government provides update on implementation of Independent Review Board recommendations.
- U.S. Bureau of Land Management. (2025, July 15). BLM approves Spring Valley gold mine in Pershing County.
- KfW. (2026, July 15). A successful first half-year for the Germany Fund: Initial investments made; further funding measures to follow shortly.
- Japan Organization for Metals and Energy Security. (2025, December 8). Agreement on cooperation for technology to reduce impurities in copper raw materials with CODELCO.
- Ministry of Mines and Energy, Brazil. (2025, December 12). Ministry advances geological knowledge with the Ten-Year Mineral Resources Plan 2026-2035. [English translation].
- Natural Resources Canada. (2026, April). Canadian Mineral Exploration Information Bulletin.
- Statistics South Africa. (2026, February 12). Mining: Production and sales, December 2025.
- Orica. (2026, April 17). Orica expands portfolio into copper chemistry with Danafloat acquisition.
- Clariant. (2025, February 23-26). SME MINEXCHANGE 2025.
- BASF. (2025, June 18). BASF mining solutions and FUCHS announce cooperation to serve the Australian mining industry.
- BASF. (2025, May 20). BASF mining solutions strengthens commitment to copper hydrometallurgy and flotation research and development.
- SNF. (2026, March 5). SNF has established a Mining Technical Center in Brazil.
- Solvay. (2025, September 15). Solvay doubles Zhenjiang production capacity of high-purity electronic grade hydrogen peroxide.
- European Patent Office. (2025, March 26). EP4399029B1: Composition and method for use of 1-alkyl-5-oxopyrrolidine-3-carboxylic acids as collectors for phosphate and lithium flotation.
- Orica. (2026, March 10). First half business update.
- Syensqo. (2025, November). 2025 Q3 results transcript.
- Kemira. (2025, October 24). Kemira completes the acquisition of Water Engineering, Inc. in the US.
- Syensqo. (n.d.). Mining Chemicals Handbook. Retrieved September 21, 2026.
- Solvay. (n.d.). Peroxides metals and mining solutions. Retrieved September 21, 2026.
- SNF. (n.d.). Mining chemicals and process solutions. Retrieved September 21, 2026.
- Solenis. (n.d.). Mineral processing chemicals and aids. Retrieved September 21, 2026.
- Chevron Phillips Chemical. (n.d.). Specialty chemicals: Mining. Retrieved September 21, 2026.
This bibliography is provided for reader reference and is not exhaustive. The full report contains the complete reference list and detailed citations
This Report Answers
- How large is the heap leach additives market in 2026 and 2036?
- Why do mine operators test additives when poor ore grades or poor solution flow cut recovery?
- Which additive type accounts for 28.0% of revenue in 2026?
- Which ore type accounts for 36.0% of revenue in 2026?
- Which application accounts for 30.0% of revenue in 2026?
- How do ore tests and heap-control rules slow commercial use?
- Why do country growth rates differ among Australia, South Africa, Brazil, Canada, the USA, Germany and Japan?
- Which companies supply heap chemistry, metal-extraction reagents, polymers, water treatment or mine-site support?
- How do recent company actions change copper chemistry and field support?
Frequently Asked Questions
How big is the heap leach additives market in 2026?
The heap leach additives market is valued at USD 1,030.0 million in 2026 and is projected to reach USD 1,777.8 million by 2036. Mine operators test additives when recovery losses are large enough to justify a site-specific chemical change.
What is the CAGR of the heap leach additives market from 2026 to 2036?
The heap leach additives market is projected to grow at 5.6% CAGR between 2026 and 2036. Growth depends on recovery gains that pass ore tests, flow checks and checks for fit with later process steps.
Which additive type leads the heap leach additives market in 2026?
The wetting agents segment is projected to hold 28.0% of additive type revenue in the heap leach additives market in 2026. Mines use these products to improve contact between ore and leach solution in dry or compacted zones.
Which ore type leads the heap leach additives market in 2026?
The copper ores segment is expected to hold 36.0% of ore type revenue in the heap leach additives market in 2026. Long heap runs create repeat needs for solution contact, scale control and metal dissolving.
Which application leads the heap leach additives market in 2026?
The leach kinetics improvement segment is forecast to represent 30.0% of application revenue in the heap leach additives market in 2026. Faster recovery can free pad space sooner when the extra reagent cost still pays back.
Which countries are projected to record the highest growth in the heap leach additives market?
Australia is projected to grow at 6.4% CAGR, followed by South Africa at 6.1% and Brazil at 5.7% through 2036. Each country has a different project pipeline, support network and site-test process.
Which companies are active in the heap leach additives market?
Key companies operating in the heap leach additives market include BASF, Solvay, Clariant, Kemira, Orica, SNF, Syensqo, Solenis, Nalco Water and Chevron Phillips Chemical. They supply direct leach chemistry, metal-extraction reagents, polymers, water control and field support.
Preview the report firsthand - request a free sample
Get SampleGet the brochure for pricing and purchase details.
Get PDFTable of Content
- Key Takeaways
- Market Size and CAGR
- Top Growth Driver
- Fastest Growing Segment
- Leading Region
- Key Companies
- Emerging Opportunities
- Executive Summary
- Global Market Outlook
- Demand-side Trends
- Supply-side Trends
- Technology Roadmap Analysis
- Analysis and Recommendations
- Analyst Perspective (What is happening? Why now? What should investors know?)
- Key Questions Answered
- How large is the market?
- What is the CAGR?
- What are key trends?
- Which region dominates?
- Who are the leaders?
- Market Overview
- Market Coverage / Taxonomy
- Market Definition / Scope / Limitations
- Research Methodology
- Chapter Orientation
- Analytical Lens and Working Hypotheses
- Market Structure, Signals, and Trend Drivers
- Benchmarking and Cross-market Comparability
- Market Sizing, Forecasting, and Opportunity Mapping
- Research Design and Evidence Framework
- Desk Research Programme (Secondary Evidence)
- Expert Input and Fieldwork (Primary Evidence)
- Tooling, Models, and Reference Databases
- Data Engineering and Model Build
- Quality Assurance and Audit Trail
- Market Background
- Market Dynamics (Drivers, Restraints, Opportunity, Trends)
- Scenario Forecast (Optimistic, Likely, Conservative)
- Impact Analysis
- AI Impact
- Sustainability Impact
- Regulatory Impact
- Technology Impact
- Consumer / Buyer Analysis
- Purchase Drivers
- Adoption Barriers
- Buyer Journey
- Opportunity Map Analysis
- Product Life Cycle Analysis
- Supply Chain Analysis
- Investment Feasibility Matrix
- Value Chain Analysis
- PESTLE and Porter's Analysis
- Regulatory Landscape
- Regional Parent Market Outlook
- Production and Consumption Statistics
- Import and Export Statistics
- Global Market Analysis and Forecast, 2021 to 2036
- Historical Market Size Value (USD Million) Analysis, 2021 to 2025
- Current and Future Market Size Value (USD Million) Projections, 2026 to 2036
- Y-o-Y Growth Trend Analysis
- Absolute $ Opportunity Analysis
- Global Market Pricing Analysis, 2021 to 2036
- Global Market Analysis and Forecast, By Additive Type, 2021 to 2036
- Introduction / Key Findings
- Historical Market Size Value (USD Million) Analysis By Additive Type, 2021 to 2025
- Current and Future Market Size Value (USD Million) Analysis and Forecast By Additive Type, 2026 to 2036
- Wetting agents
- Permeability enhancers
- Agglomeration aids
- Anti-scalants
- Bioleach enhancers
- Y-o-Y Growth Trend Analysis By Additive Type, 2021 to 2025
- Absolute $ Opportunity Analysis By Additive Type, 2026 to 2036
- Global Market Analysis and Forecast, By Ore Type, 2021 to 2036
- Introduction / Key Findings
- Historical Market Size Value (USD Million) Analysis By Ore Type, 2021 to 2025
- Current and Future Market Size Value (USD Million) Analysis and Forecast By Ore Type, 2026 to 2036
- Copper ores
- Gold ores
- Uranium ores
- Nickel-cobalt ores
- Mixed oxide ores
- Y-o-Y Growth Trend Analysis By Ore Type, 2021 to 2025
- Absolute $ Opportunity Analysis By Ore Type, 2026 to 2036
- Global Market Analysis and Forecast, By Application, 2021 to 2036
- Introduction / Key Findings
- Historical Market Size Value (USD Million) Analysis By Application, 2021 to 2025
- Current and Future Market Size Value (USD Million) Analysis and Forecast By Application, 2026 to 2036
- Leach kinetics improvement
- Solution distribution
- Ore agglomeration
- Scale control
- Recovery improvement
- Y-o-Y Growth Trend Analysis By Application, 2021 to 2025
- Absolute $ Opportunity Analysis By Application, 2026 to 2036
- Global Market Analysis and Forecast, By End Use, 2021 to 2036
- Introduction / Key Findings
- Historical Market Size Value (USD Million) Analysis By End Use, 2021 to 2025
- Current and Future Market Size Value (USD Million) Analysis and Forecast By End Use, 2026 to 2036
- Copper mines
- Gold mines
- Uranium operations
- Battery metal projects
- Pilot leach pads
- Y-o-Y Growth Trend Analysis By End Use, 2021 to 2025
- Absolute $ Opportunity Analysis By End Use, 2026 to 2036
- Global Market Analysis and Forecast, By Sales Channel, 2021 to 2036
- Introduction / Key Findings
- Historical Market Size Value (USD Million) Analysis By Sales Channel, 2021 to 2025
- Current and Future Market Size Value (USD Million) Analysis and Forecast By Sales Channel, 2026 to 2036
- Mining chemical suppliers
- Direct mine contracts
- EPC/process consultants
- Distributors
- Y-o-Y Growth Trend Analysis By Sales Channel, 2021 to 2025
- Absolute $ Opportunity Analysis By Sales Channel, 2026 to 2036
- Global Market Analysis and Forecast, By Region, 2021 to 2036
- Introduction
- Historical Market Size Value (USD Million) Analysis By Region, 2021 to 2025
- Current Market Size Value (USD Million) Analysis and Forecast By Region, 2026 to 2036
- North America
- Latin America
- Western Europe
- Eastern Europe
- East Asia
- South Asia and Pacific
- Middle East and Africa
- Market Attractiveness Analysis By Region
- North America Market Analysis and Forecast, By Country, 2021 to 2036
- Historical Market Size Value (USD Million) Trend Analysis By Market Taxonomy, 2021 to 2025
- Market Size Value (USD Million) Forecast By Market Taxonomy, 2026 to 2036
- By Country
- United States
- Canada
- By Additive Type
- By Ore Type
- By Application
- By End Use
- By Sales Channel
- By Country
- Market Attractiveness Analysis
- By Country
- By Additive Type
- By Ore Type
- By Application
- By End Use
- By Sales Channel
- Key Takeaways
- Latin America Market Analysis and Forecast, By Country
- Historical Market Size Value (USD Million) Trend Analysis By Market Taxonomy, 2021 to 2025
- Market Size Value (USD Million) Forecast By Market Taxonomy, 2026 to 2036
- By Country
- Brazil
- Mexico
- Argentina
- Chile
- By Additive Type
- By Ore Type
- By Application
- By End Use
- By Sales Channel
- By Country
- Market Attractiveness Analysis
- By Country
- By Additive Type
- By Ore Type
- By Application
- By End Use
- By Sales Channel
- Key Takeaways
- Western Europe Market Analysis and Forecast, By Country
- Historical Market Size Value (USD Million) Trend Analysis By Market Taxonomy, 2021 to 2025
- Market Size Value (USD Million) Forecast By Market Taxonomy, 2026 to 2036
- By Country
- Germany
- France
- United Kingdom
- Italy
- Spain
- Benelux
- Nordics
- By Additive Type
- By Ore Type
- By Application
- By End Use
- By Sales Channel
- By Country
- Market Attractiveness Analysis
- By Country
- By Additive Type
- By Ore Type
- By Application
- By End Use
- By Sales Channel
- Key Takeaways
- Eastern Europe Market Analysis and Forecast, By Country
- Historical Market Size Value (USD Million) Trend Analysis By Market Taxonomy, 2021 to 2025
- Market Size Value (USD Million) Forecast By Market Taxonomy, 2026 to 2036
- By Country
- Poland
- Czech Republic
- Romania
- Hungary
- By Additive Type
- By Ore Type
- By Application
- By End Use
- By Sales Channel
- By Country
- Market Attractiveness Analysis
- By Country
- By Additive Type
- By Ore Type
- By Application
- By End Use
- By Sales Channel
- Key Takeaways
- East Asia Market Analysis and Forecast, By Country
- Historical Market Size Value (USD Million) Trend Analysis By Market Taxonomy, 2021 to 2025
- Market Size Value (USD Million) Forecast By Market Taxonomy, 2026 to 2036
- By Country
- China
- Japan
- South Korea
- By Additive Type
- By Ore Type
- By Application
- By End Use
- By Sales Channel
- By Country
- Market Attractiveness Analysis
- By Country
- By Additive Type
- By Ore Type
- By Application
- By End Use
- By Sales Channel
- Key Takeaways
- South Asia and Pacific Market Analysis and Forecast, By Country
- Historical Market Size Value (USD Million) Trend Analysis By Market Taxonomy, 2021 to 2025
- Market Size Value (USD Million) Forecast By Market Taxonomy, 2026 to 2036
- By Country
- India
- ASEAN
- Australia and New Zealand
- By Additive Type
- By Ore Type
- By Application
- By End Use
- By Sales Channel
- By Country
- Market Attractiveness Analysis
- By Country
- By Additive Type
- By Ore Type
- By Application
- By End Use
- By Sales Channel
- Key Takeaways
- Middle East and Africa Market Analysis and Forecast, By Country
- Historical Market Size Value (USD Million) Trend Analysis By Market Taxonomy, 2021 to 2025
- Market Size Value (USD Million) Forecast By Market Taxonomy, 2026 to 2036
- By Country
- GCC Countries
- South Africa
- Türkiye
- Israel
- By Additive Type
- By Ore Type
- By Application
- By End Use
- By Sales Channel
- By Country
- Market Attractiveness Analysis
- By Country
- By Additive Type
- By Ore Type
- By Application
- By End Use
- By Sales Channel
- Key Takeaways
- Key Countries Market Analysis
- United States
- Pricing Analysis
- Market Share Analysis, 2025
- By Additive Type
- By Ore Type
- By Application
- By End Use
- By Sales Channel
- Canada
- Pricing Analysis
- Market Share Analysis, 2025
- By Additive Type
- By Ore Type
- By Application
- By End Use
- By Sales Channel
- Mexico
- Pricing Analysis
- Market Share Analysis, 2025
- By Additive Type
- By Ore Type
- By Application
- By End Use
- By Sales Channel
- Brazil
- Pricing Analysis
- Market Share Analysis, 2025
- By Additive Type
- By Ore Type
- By Application
- By End Use
- By Sales Channel
- Chile
- Pricing Analysis
- Market Share Analysis, 2025
- By Additive Type
- By Ore Type
- By Application
- By End Use
- By Sales Channel
- Germany
- Pricing Analysis
- Market Share Analysis, 2025
- By Additive Type
- By Ore Type
- By Application
- By End Use
- By Sales Channel
- United Kingdom
- Pricing Analysis
- Market Share Analysis, 2025
- By Additive Type
- By Ore Type
- By Application
- By End Use
- By Sales Channel
- Italy
- Pricing Analysis
- Market Share Analysis, 2025
- By Additive Type
- By Ore Type
- By Application
- By End Use
- By Sales Channel
- Spain
- Pricing Analysis
- Market Share Analysis, 2025
- By Additive Type
- By Ore Type
- By Application
- By End Use
- By Sales Channel
- France
- Pricing Analysis
- Market Share Analysis, 2025
- By Additive Type
- By Ore Type
- By Application
- By End Use
- By Sales Channel
- India
- Pricing Analysis
- Market Share Analysis, 2025
- By Additive Type
- By Ore Type
- By Application
- By End Use
- By Sales Channel
- ASEAN
- Pricing Analysis
- Market Share Analysis, 2025
- By Additive Type
- By Ore Type
- By Application
- By End Use
- By Sales Channel
- Australia and New Zealand
- Pricing Analysis
- Market Share Analysis, 2025
- By Additive Type
- By Ore Type
- By Application
- By End Use
- By Sales Channel
- China
- Pricing Analysis
- Market Share Analysis, 2025
- By Additive Type
- By Ore Type
- By Application
- By End Use
- By Sales Channel
- Japan
- Pricing Analysis
- Market Share Analysis, 2025
- By Additive Type
- By Ore Type
- By Application
- By End Use
- By Sales Channel
- South Korea
- Pricing Analysis
- Market Share Analysis, 2025
- By Additive Type
- By Ore Type
- By Application
- By End Use
- By Sales Channel
- Poland
- Pricing Analysis
- Market Share Analysis, 2025
- By Additive Type
- By Ore Type
- By Application
- By End Use
- By Sales Channel
- Hungary
- Pricing Analysis
- Market Share Analysis, 2025
- By Additive Type
- By Ore Type
- By Application
- By End Use
- By Sales Channel
- Türkiye
- Pricing Analysis
- Market Share Analysis, 2025
- By Additive Type
- By Ore Type
- By Application
- By End Use
- By Sales Channel
- South Africa
- Pricing Analysis
- Market Share Analysis, 2025
- By Additive Type
- By Ore Type
- By Application
- By End Use
- By Sales Channel
- Australia
- Pricing Analysis
- Market Share Analysis, 2025
- By Additive Type
- By Ore Type
- By Application
- By End Use
- By Sales Channel
- United States
- Market Structure Analysis
- Competition Dashboard
- Competition Benchmarking
- Market Share Analysis of Top Players
- By Regional
- By Additive Type
- By Ore Type
- By Application
- By End Use
- By Sales Channel
- Emerging Startups
- Innovation Benchmarking
- Competition Analysis
- Competition Deep Dive
- BASF
- Overview
- Product Portfolio
- Profitability by Market Segments
- Sales Footprint
- Strategy Overview
- Marketing Strategy
- Product Strategy
- Channel Strategy
- Solvay
- Clariant
- Kemira
- Orica
- SNF
- Syensqo
- Solenis
- Nalco Water, an Ecolab company
- Chevron Phillips Chemical
- BASF
- Case Studies
- Success Stories
- Recent Developments
- Competition Deep Dive
- Assumptions & Acronyms Used


