Herpes Labialis Treatment Market Size and Share Forecast Outlook 2025 to 2035

The global herpes labialis treatment market is estimated to be valued at USD 1,238.7 million in 2025 and is projected to reach USD 1,887.1 million by 2035, registering a CAGR of 4.3% over the forecast period.
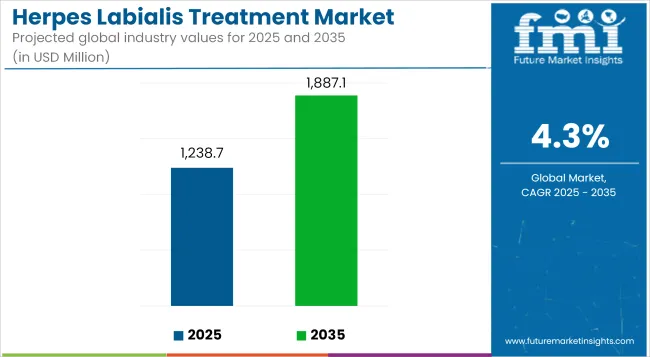
Quick Stats for Herpes Labialis Treatment Market

  • Industry Value (2025): USD 1,238.7 million
  • Forecast Value (2035): USD 1,887.1 million
  • Forecast CAGR: 4.3%
  • Leading Segment in 2025: Acyclovir
  • Key Growth Regions: North America, Europe, Asia-Pacific (China, India)
  • Top Key Players:
    • GlaxoSmithKline plc
    • Pfizer Inc.
    • Roche Holding AG
    • Mylan N.V.
    • Teva Pharmaceutical Industries Ltd.

Herpes Labialis Treatment Market Industry Value Analysis

Metric Value
Market Size (2025) USD 1,238.7 Million
Market Value (2035) USD 1,887.1 Million
CAGR (2025 to 2035) 4.3%

The herpes labialis treatment market has expanded steadily as recurrent cold sores remain a widespread health burden across geographies. Increasing patient awareness of early intervention benefits and the need for symptom suppression have driven consistent demand for both prescription antivirals and over-the-counter therapies.

Pharmaceutical manufacturers have prioritized reformulation of acyclovir, penciclovir, and valacyclovir into patient-friendly topical gels and patches to improve adherence and treatment efficacy. Regulatory approvals of novel delivery systems and bioequivalent generics have further broadened therapeutic options. Healthcare providers have emphasized timely initiation of therapy at prodromal stages, fueling prescription volumes and reinforcing the clinical value of suppressive regimens for frequent recurrences
Analyzing Herpes Labialis Treatment Market by Top Investment Segments

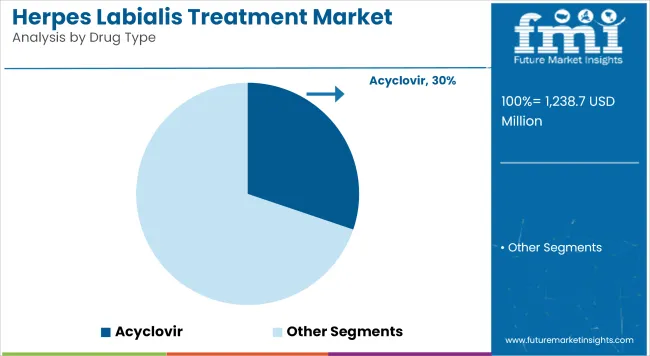
Acyclovir Leads the Market with Established Efficacy, Cost-Effectiveness, and Widespread Physician Acceptance

Herpes Labialis Treatment Market Analysis By Drug Type

Acyclovir accounts for a revenue share of 30.2% has been attributed to acyclovir, underscoring its position as the first-line antiviral therapy for herpes labialis. This segment is driven by its well-documented safety profile, broad clinical experience, and consistent efficacy in reducing lesion duration and viral shedding.

Physicians have favored acyclovir due to its proven performance in both episodic and suppressive regimens, supporting high prescription volumes across primary care and dermatology practices. The widespread availability of affordable generics has further reinforced adoption among patients with recurrent outbreaks.

Regulatory endorsements and inclusion in treatment guidelines have solidified acyclovir’s position as the preferred antiviral agent. These factors have established acyclovir as the dominant drug type segment, with sustained growth expected as HSV-1 infection rates remain high globally.
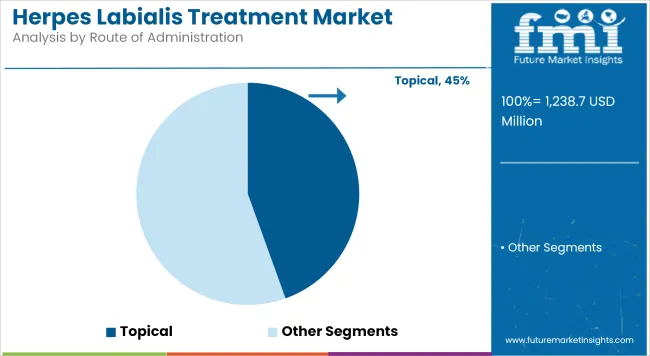
Topical Formulations Dominate the Market Due to Rapid Onset of Action and High Patient Preference for Localized Treatment

Herpes Labialis Treatment Market Analysis By Route Of Administration

Topical Route contributes 44.5% revenue share in the overall market, reflecting their prominence in acute management of herpes labialis. This segment has been driven by the preference for localized therapy that directly targets lesions and minimizes systemic exposure.

Patients have favored topical antivirals for their ease of application, rapid symptom relief, and convenience during early outbreak stages. Manufacturers have invested in developing fast-absorbing gels, patches, and cream formulations that improve bioavailability and reduce dosing frequency. Healthcare providers have recommended topical therapies as first-line treatment for uncomplicated cases, reinforcing market share
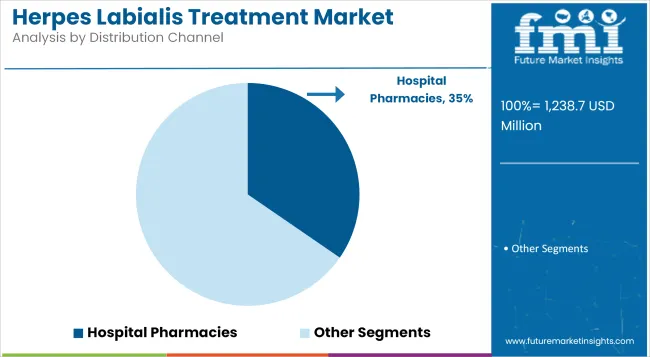
Hospital Pharmacies Hold a Leading Share Due to Reliable Access to Prescription Antivirals and Specialist Care

Herpes Labialis Treatment Market Analysis By Distribution Channel

Hospital Pharmacies holds 34.6% revenue share due to their role in dispensing prescription antivirals and supporting comprehensive herpes labialis management. Utilization has been driven by hospitals’ ability to maintain consistent stock of branded and generic antiviral therapies, especially for patients with severe or immunocompromised conditions requiring specialist oversight.

Physicians have relied on hospital-based dispensing to ensure adherence to treatment regimens and monitor potential drug interactions. Hospital pharmacies have also facilitated patient education and timely initiation of suppressive therapy during acute flare-ups.

Challenges and Opportunities

Challenges

Recurring Nature of Infection and Resistance Issues

Herpes labialis, in common parlance, cold sores, would pose significant challenges due to the recurrent feature of this particular virus. Frequent reactivation of these viruses in patients requires repetitive treatment cycles, as well. Longer-term use of antiviral drugs can lead to resistance against the standard therapies of their choice, such as acyclovir and valacyclovir.

Limited Treatment Scope and Social Stigma

Treatments are addressing symptoms, they are not geared toward the eradication of the virus. This inability to get rid of HSV-1 from the system limits the long-term efficacy of the different therapeutics used. Furthermore, the presence of cold sores incurs a social stigma that distresses patients psychologically, therefore increasing demand for rapid and cosmetically acceptable therapies.

Opportunities

Growing Awareness and Early Diagnosis

The growing awareness of herpes labialis due to public health campaigns and improved health diagnostics, therefore, have allowed early intervention to take place. Such interventions, said to include treatment on offer, would not only shorten the duration of the outbreak but also ameliorate its severity, hence cultivating demand for affordable over-the-counter or prescription options.

Advances in Therapeutics and Delivery Mechanisms

Emerging therapies, such as topical antivirals that act rapidly, in conjunction with new delivery formats like patches and nano- carriers, offers new growth opportunities for the market. Research on vaccines for HSV and other gene-silencing approaches is providing the platform for other future options of long-term solutions.
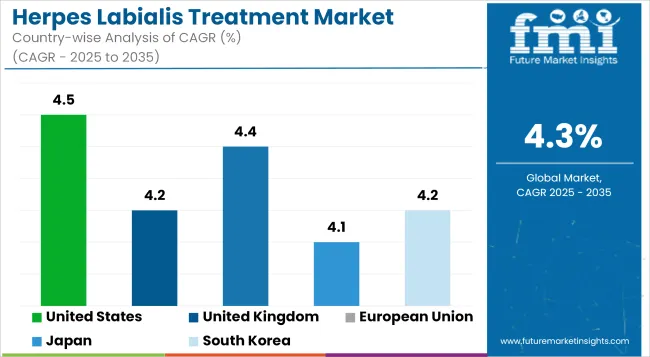
Country-wise Outlook

Herpes Labialis Treatment Market Cagr Analysis By Country

United States

The Herpes Labialis Treatment Market in the United States is on an impressive growth trajectory as more individuals end up developing HSV-1 infections. Due to the increasing aged population coupled with the rising number of individuals suffering from cold sores, demand for new treatment continues to improve.

The nation's strong healthcare infrastructure, reputable pharmaceutical market, and available health insurance coverage ensure the vast access to treatment.

Country CAGR (2025 to 2035)
United States 4.5%

United Kingdom

In the United Kingdom, the Herpes Labialis Treatment Market is being fomented by public healthcare policies and initiatives by private health organizations. The National Health Service (NHS) is involved in making treatment options available; private health organizations make available more advanced tailor-made care.

The growing trend toward prophylactic treatment and early initiation is mainly responsible for the expanding market. Most consumers in the UK are opting for combination antiviral therapy, which allows faster relief and prevents a cold sore recurrence.

Country CAGR (2025 to 2035)
United Kingdom 4.2%

European Union

The Herpes Labialis Treatment Market across the European Union (EU) supplements the Herpes Labialis Treatment Market in the United Kingdom by virtue of its wider, heterogeneous population and strong pharmaceutical industries. With the rising prescription demand for antiviral treatments and over-the-counter remedies for herpes labialis, there are increasing market chances.

Country CAGR (2025 to 2035)
European Union 4.4%

Japan

In Japan, the Herpes Labialis Treatment Market is being stimulated by individual interest in and emphasis upon health awareness and preventive medicine. Thus, the early intervention and treatment of viral infections such as HSV-1 have increasingly been adopted by the populace.

Further, Japan counts highly on this highly advanced healthcare system for speedy treatment and access to effective antiviral drugs. New treatment options, such as combination therapies and new topical formulations, are part of the evolution shaping the changing demography seen in the market.

Country CAGR (2025 to 2035)
Japan 4.1%

South Korea

Herpes Labialis Treatment Market in South Korea is significantly stoked by the fast uptake of advanced dermatological treatments combined with the rise in incidence rates of herpes simplex virus infections. The strong healthcare system in the country in combination with high access to medications has been major drivers for this market. South Korea is really oriented towards the individual toward wellness in general-most encompassing therein would be skin health.

Country CAGR (2025 to 2035)
South Korea 4.2%

Competition Outlook

The competitive landscape has been shaped by manufacturers investing in novel topical delivery systems, fast-dissolving patches, and combination regimens to differentiate products. Leading players have prioritized lifecycle management strategies, including pediatric formulations and single-dose options, to expand market reach.

Generic manufacturers have introduced cost-competitive alternatives that maintain adherence to regulatory standards. Digital marketing initiatives and patient education campaigns have increased awareness of early treatment benefits. These activities are expected to sustain strong competition and drive innovation in herpes labialis therapeutics over the coming years.

Key Development

In 2025, Theralase® Technologies announced that their drug, Ruvidar™, proved more effective in treating Herpes Simplex Virus, Type 1 (HSV-1). Preclinical animal model results showed superiority over FDA-approved standard treatments, Acyclovir (5%) and Abreva (10% Docosanol)..

In 2024, GSK announced the completion of primary data analysis from its phase II TH HSV REC-003 trial. This early-stage study assessed the potential efficacy of GSK3943104, a therapeutic herpes simplex virus (HSV) vaccine candidate, as a crucial step before further clinical development.

Companies

  • Novartis AG., Ltd
  • Valeant Pharmaceuticals International Inc. (Bausch Health)
  • Pfizer Inc.
  • Abbott laboratories
  • Mylan N.V.,
  • Teva Pharmaceutical Industries Ltd.
  • GlaxoSmithKline Plc.
  • Dr. Reddy’s Laboratories
  • F. Hoffmann-La Roche Ltd.
  • Agenus, Inc.
  • Maruho Co. Ltd.
  • Sanofi Pasteur SA.
  • Chimerix
  • Admedus
  • iCuris Anti-infective Cures GmbH
  • Apotex Inc.
  • Zydus Pharmaceuticals

Key Segmentation 

By Drug Type:

  • Acyclovir
  • Valacyclovir
  • Penciclovir
  • Famciclovir
  • Docosanol

By Route of Administration:

  • Oral
  • Topical
  • Combination

By Distribution Channel:

  • Hospital Pharmacies
  • Retail Pharmacies
  • Drug Stores
  • Online Pharmacies

By Region:

  • North America
  • Latin America
  • Western Europe
  • Eastern Europe
  • Asia Pacific excluding Japan
  • Japan
  • The Middle East & Africa

Table of Content

  1. Executive Summary
  2. Industry Introduction, including Taxonomy and Market Definition
  3. Market Trends and Success Factors, including Macro-economic Factors, Market Dynamics, and Recent Industry Developments
  4. Market Demand Analysis 2020 to 2024 and Forecast 2025 to 2035, including Historical Analysis and Future Projections
  5. Pricing Analysis
  6. Market Analysis 2020 to 2024 and Forecast 2025 to 2035
    • Drug Type
    • Route of Administration
    • Distribution Channel
  7. Market Analysis 2020 to 2024 and Forecast 2025 to 2035, By Drug Type
    • Acyclovir
    • Valacyclovir
    • Penciclovir
    • Famciclovir
  8. Market Analysis 2020 to 2024 and Forecast 2025 to 2035, By Route of Administration
    • Oral
    • Topical
    • Combination
  9. Market Analysis 2020 to 2024 and Forecast 2025 to 2035, By Distribution Channel
    • Hospital Pharmacies
    • Retail Pharmacies
    • Drug Stores
    • Online Pharmacies
  10. Market Analysis 2020 to 2024 and Forecast 2025 to 2035, By Region
    • North America
    • Latin America
    • Western Europe
    • Eastern Europe
    • East Asia
    • South Asia Pacific
    • Middle East and Africa
  11. North America Sales Analysis 2020 to 2024 and Forecast 2025 to 2035, by Key Segments and Countries
  12. Latin America Sales Analysis 2020 to 2024 and Forecast 2025 to 2035, by Key Segments and Countries
  13. Western Europe Sales Analysis 2020 to 2024 and Forecast 2025 to 2035, by Key Segments and Countries
  14. Eastern Europe Sales Analysis 2020 to 2024 and Forecast 2025 to 2035, by Key Segments and Countries
  15. East Asia Sales Analysis 2020 to 2024 and Forecast 2025 to 2035, by Key Segments and Countries
  16. South Asia Pacific Sales Analysis 2020 to 2024 and Forecast 2025 to 2035, by Key Segments and Countries
  17. Middle East and Africa Sales Analysis 2020 to 2024 and Forecast 2025 to 2035, by Key Segments and Countries
  18. Sales Forecast 2025 to 2035 by Drug Type, Route of Administration, and Distribution Channel for 30 Countries
  19. Competition Outlook, including Market Structure Analysis, Company Share Analysis by Key Players, and Competition Dashboard
  20. Company Profile
    • Novartis AG
    • Valeant Pharmaceuticals International Inc.
    • Teva Pharmaceuticals Industries Ltd.
    • Sun Pharmaceuticals
    • Abbott Laboratories
    • Mylan N.V.
    • Pfizer Inc.
    • GlaxoSmithKline PLC
    • Dr. Reddy’s Laboratories
    • Merck & Co., Inc.

List of Tables

  • Table 1: Global Market Value (USD Million) Forecast by Region, 2020 to 2035
  • Table 2: Global Market Value (USD Million) Forecast by Drug Type, 2020 to 2035
  • Table 3: Global Market Value (USD Million) Forecast by Route of Administration, 2020 to 2035
  • Table 4: Global Market Value (USD Million) Forecast by Distribution Channel, 2020 to 2035
  • Table 5: North America Market Value (USD Million) Forecast by Country, 2020 to 2035
  • Table 6: North America Market Value (USD Million) Forecast by Drug Type, 2020 to 2035
  • Table 7: North America Market Value (USD Million) Forecast by Route of Administration, 2020 to 2035
  • Table 8: North America Market Value (USD Million) Forecast by Distribution Channel, 2020 to 2035
  • Table 9: Latin America Market Value (USD Million) Forecast by Country, 2020 to 2035
  • Table 10: Latin America Market Value (USD Million) Forecast by Drug Type, 2020 to 2035
  • Table 11: Latin America Market Value (USD Million) Forecast by Route of Administration, 2020 to 2035
  • Table 12: Latin America Market Value (USD Million) Forecast by Distribution Channel, 2020 to 2035
  • Table 13: Europe Market Value (USD Million) Forecast by Country, 2020 to 2035
  • Table 14: Europe Market Value (USD Million) Forecast by Drug Type, 2020 to 2035
  • Table 15: Europe Market Value (USD Million) Forecast by Route of Administration, 2020 to 2035
  • Table 16: Europe Market Value (USD Million) Forecast by Distribution Channel, 2020 to 2035
  • Table 17: South Asia Market Value (USD Million) Forecast by Country, 2020 to 2035
  • Table 18: South Asia Market Value (USD Million) Forecast by Drug Type, 2020 to 2035
  • Table 19: South Asia Market Value (USD Million) Forecast by Route of Administration, 2020 to 2035
  • Table 20: South Asia Market Value (USD Million) Forecast by Distribution Channel, 2020 to 2035
  • Table 21: East Asia Market Value (USD Million) Forecast by Country, 2020 to 2035
  • Table 22: East Asia Market Value (USD Million) Forecast by Drug Type, 2020 to 2035
  • Table 23: East Asia Market Value (USD Million) Forecast by Route of Administration, 2020 to 2035
  • Table 24: East Asia Market Value (USD Million) Forecast by Distribution Channel, 2020 to 2035
  • Table 25: Oceania Market Value (USD Million) Forecast by Country, 2020 to 2035
  • Table 26: Oceania Market Value (USD Million) Forecast by Drug Type, 2020 to 2035
  • Table 27: Oceania Market Value (USD Million) Forecast by Route of Administration, 2020 to 2035
  • Table 28: Oceania Market Value (USD Million) Forecast by Distribution Channel, 2020 to 2035
  • Table 29: MEA Market Value (USD Million) Forecast by Country, 2020 to 2035
  • Table 30: MEA Market Value (USD Million) Forecast by Drug Type, 2020 to 2035
  • Table 31: MEA Market Value (USD Million) Forecast by Route of Administration, 2020 to 2035
  • Table 32: MEA Market Value (USD Million) Forecast by Distribution Channel, 2020 to 2035

List of Figures

  • Figure 1: Global Market Value (USD Million) by Drug Type, 2025 to 2035
  • Figure 2: Global Market Value (USD Million) by Route of Administration, 2025 to 2035
  • Figure 3: Global Market Value (USD Million) by Distribution Channel, 2025 to 2035
  • Figure 4: Global Market Value (USD Million) by Region, 2025 to 2035
  • Figure 5: Global Market Value (USD Million) Analysis by Region, 2020 to 2035
  • Figure 6: Global Market Value Share (%) and BPS Analysis by Region, 2025 to 2035
  • Figure 7: Global Market Y-o-Y Growth (%) Projections by Region, 2025 to 2035
  • Figure 8: Global Market Value (USD Million) Analysis by Drug Type, 2020 to 2035
  • Figure 9: Global Market Value Share (%) and BPS Analysis by Drug Type, 2025 to 2035
  • Figure 10: Global Market Y-o-Y Growth (%) Projections by Drug Type, 2025 to 2035
  • Figure 11: Global Market Value (USD Million) Analysis by Route of Administration, 2020 to 2035
  • Figure 12: Global Market Value Share (%) and BPS Analysis by Route of Administration, 2025 to 2035
  • Figure 13: Global Market Y-o-Y Growth (%) Projections by Route of Administration, 2025 to 2035
  • Figure 14: Global Market Value (USD Million) Analysis by Distribution Channel, 2020 to 2035
  • Figure 15: Global Market Value Share (%) and BPS Analysis by Distribution Channel, 2025 to 2035
  • Figure 16: Global Market Y-o-Y Growth (%) Projections by Distribution Channel, 2025 to 2035
  • Figure 17: Global Market Attractiveness by Drug Type, 2025 to 2035
  • Figure 18: Global Market Attractiveness by Route of Administration, 2025 to 2035
  • Figure 19: Global Market Attractiveness by Distribution Channel, 2025 to 2035
  • Figure 20: Global Market Attractiveness by Region, 2025 to 2035
  • Figure 21: North America Market Value (USD Million) by Drug Type, 2025 to 2035
  • Figure 22: North America Market Value (USD Million) by Route of Administration, 2025 to 2035
  • Figure 23: North America Market Value (USD Million) by Distribution Channel, 2025 to 2035
  • Figure 24: North America Market Value (USD Million) by Country, 2025 to 2035
  • Figure 25: North America Market Value (USD Million) Analysis by Country, 2020 to 2035
  • Figure 26: North America Market Value Share (%) and BPS Analysis by Country, 2025 to 2035
  • Figure 27: North America Market Y-o-Y Growth (%) Projections by Country, 2025 to 2035
  • Figure 28: North America Market Value (USD Million) Analysis by Drug Type, 2020 to 2035
  • Figure 29: North America Market Value Share (%) and BPS Analysis by Drug Type, 2025 to 2035
  • Figure 30: North America Market Y-o-Y Growth (%) Projections by Drug Type, 2025 to 2035
  • Figure 31: North America Market Value (USD Million) Analysis by Route of Administration, 2020 to 2035
  • Figure 32: North America Market Value Share (%) and BPS Analysis by Route of Administration, 2025 to 2035
  • Figure 33: North America Market Y-o-Y Growth (%) Projections by Route of Administration, 2025 to 2035
  • Figure 34: North America Market Value (USD Million) Analysis by Distribution Channel, 2020 to 2035
  • Figure 35: North America Market Value Share (%) and BPS Analysis by Distribution Channel, 2025 to 2035
  • Figure 36: North America Market Y-o-Y Growth (%) Projections by Distribution Channel, 2025 to 2035
  • Figure 37: North America Market Attractiveness by Drug Type, 2025 to 2035
  • Figure 38: North America Market Attractiveness by Route of Administration, 2025 to 2035
  • Figure 39: North America Market Attractiveness by Distribution Channel, 2025 to 2035
  • Figure 40: North America Market Attractiveness by Country, 2025 to 2035
  • Figure 41: Latin America Market Value (USD Million) by Drug Type, 2025 to 2035
  • Figure 42: Latin America Market Value (USD Million) by Route of Administration, 2025 to 2035
  • Figure 43: Latin America Market Value (USD Million) by Distribution Channel, 2025 to 2035
  • Figure 44: Latin America Market Value (USD Million) by Country, 2025 to 2035
  • Figure 45: Latin America Market Value (USD Million) Analysis by Country, 2020 to 2035
  • Figure 46: Latin America Market Value Share (%) and BPS Analysis by Country, 2025 to 2035
  • Figure 47: Latin America Market Y-o-Y Growth (%) Projections by Country, 2025 to 2035
  • Figure 48: Latin America Market Value (USD Million) Analysis by Drug Type, 2020 to 2035
  • Figure 49: Latin America Market Value Share (%) and BPS Analysis by Drug Type, 2025 to 2035
  • Figure 50: Latin America Market Y-o-Y Growth (%) Projections by Drug Type, 2025 to 2035
  • Figure 51: Latin America Market Value (USD Million) Analysis by Route of Administration, 2020 to 2035
  • Figure 52: Latin America Market Value Share (%) and BPS Analysis by Route of Administration, 2025 to 2035
  • Figure 53: Latin America Market Y-o-Y Growth (%) Projections by Route of Administration, 2025 to 2035
  • Figure 54: Latin America Market Value (USD Million) Analysis by Distribution Channel, 2020 to 2035
  • Figure 55: Latin America Market Value Share (%) and BPS Analysis by Distribution Channel, 2025 to 2035
  • Figure 56: Latin America Market Y-o-Y Growth (%) Projections by Distribution Channel, 2025 to 2035
  • Figure 57: Latin America Market Attractiveness by Drug Type, 2025 to 2035
  • Figure 58: Latin America Market Attractiveness by Route of Administration, 2025 to 2035
  • Figure 59: Latin America Market Attractiveness by Distribution Channel, 2025 to 2035
  • Figure 60: Latin America Market Attractiveness by Country, 2025 to 2035
  • Figure 61: Europe Market Value (USD Million) by Drug Type, 2025 to 2035
  • Figure 62: Europe Market Value (USD Million) by Route of Administration, 2025 to 2035
  • Figure 63: Europe Market Value (USD Million) by Distribution Channel, 2025 to 2035
  • Figure 64: Europe Market Value (USD Million) by Country, 2025 to 2035
  • Figure 65: Europe Market Value (USD Million) Analysis by Country, 2020 to 2035
  • Figure 66: Europe Market Value Share (%) and BPS Analysis by Country, 2025 to 2035
  • Figure 67: Europe Market Y-o-Y Growth (%) Projections by Country, 2025 to 2035
  • Figure 68: Europe Market Value (USD Million) Analysis by Drug Type, 2020 to 2035
  • Figure 69: Europe Market Value Share (%) and BPS Analysis by Drug Type, 2025 to 2035
  • Figure 70: Europe Market Y-o-Y Growth (%) Projections by Drug Type, 2025 to 2035
  • Figure 71: Europe Market Value (USD Million) Analysis by Route of Administration, 2020 to 2035
  • Figure 72: Europe Market Value Share (%) and BPS Analysis by Route of Administration, 2025 to 2035
  • Figure 73: Europe Market Y-o-Y Growth (%) Projections by Route of Administration, 2025 to 2035
  • Figure 74: Europe Market Value (USD Million) Analysis by Distribution Channel, 2020 to 2035
  • Figure 75: Europe Market Value Share (%) and BPS Analysis by Distribution Channel, 2025 to 2035
  • Figure 76: Europe Market Y-o-Y Growth (%) Projections by Distribution Channel, 2025 to 2035
  • Figure 77: Europe Market Attractiveness by Drug Type, 2025 to 2035
  • Figure 78: Europe Market Attractiveness by Route of Administration, 2025 to 2035
  • Figure 79: Europe Market Attractiveness by Distribution Channel, 2025 to 2035
  • Figure 80: Europe Market Attractiveness by Country, 2025 to 2035
  • Figure 81: South Asia Market Value (USD Million) by Drug Type, 2025 to 2035
  • Figure 82: South Asia Market Value (USD Million) by Route of Administration, 2025 to 2035
  • Figure 83: South Asia Market Value (USD Million) by Distribution Channel, 2025 to 2035
  • Figure 84: South Asia Market Value (USD Million) by Country, 2025 to 2035
  • Figure 85: South Asia Market Value (USD Million) Analysis by Country, 2020 to 2035
  • Figure 86: South Asia Market Value Share (%) and BPS Analysis by Country, 2025 to 2035
  • Figure 87: South Asia Market Y-o-Y Growth (%) Projections by Country, 2025 to 2035
  • Figure 88: South Asia Market Value (USD Million) Analysis by Drug Type, 2020 to 2035
  • Figure 89: South Asia Market Value Share (%) and BPS Analysis by Drug Type, 2025 to 2035
  • Figure 90: South Asia Market Y-o-Y Growth (%) Projections by Drug Type, 2025 to 2035
  • Figure 91: South Asia Market Value (USD Million) Analysis by Route of Administration, 2020 to 2035
  • Figure 92: South Asia Market Value Share (%) and BPS Analysis by Route of Administration, 2025 to 2035
  • Figure 93: South Asia Market Y-o-Y Growth (%) Projections by Route of Administration, 2025 to 2035
  • Figure 94: South Asia Market Value (USD Million) Analysis by Distribution Channel, 2020 to 2035
  • Figure 95: South Asia Market Value Share (%) and BPS Analysis by Distribution Channel, 2025 to 2035
  • Figure 96: South Asia Market Y-o-Y Growth (%) Projections by Distribution Channel, 2025 to 2035
  • Figure 97: South Asia Market Attractiveness by Drug Type, 2025 to 2035
  • Figure 98: South Asia Market Attractiveness by Route of Administration, 2025 to 2035
  • Figure 99: South Asia Market Attractiveness by Distribution Channel, 2025 to 2035
  • Figure 100: South Asia Market Attractiveness by Country, 2025 to 2035
  • Figure 101: East Asia Market Value (USD Million) by Drug Type, 2025 to 2035
  • Figure 102: East Asia Market Value (USD Million) by Route of Administration, 2025 to 2035
  • Figure 103: East Asia Market Value (USD Million) by Distribution Channel, 2025 to 2035
  • Figure 104: East Asia Market Value (USD Million) by Country, 2025 to 2035
  • Figure 105: East Asia Market Value (USD Million) Analysis by Country, 2020 to 2035
  • Figure 106: East Asia Market Value Share (%) and BPS Analysis by Country, 2025 to 2035
  • Figure 107: East Asia Market Y-o-Y Growth (%) Projections by Country, 2025 to 2035
  • Figure 108: East Asia Market Value (USD Million) Analysis by Drug Type, 2020 to 2035
  • Figure 109: East Asia Market Value Share (%) and BPS Analysis by Drug Type, 2025 to 2035
  • Figure 110: East Asia Market Y-o-Y Growth (%) Projections by Drug Type, 2025 to 2035
  • Figure 111: East Asia Market Value (USD Million) Analysis by Route of Administration, 2020 to 2035
  • Figure 112: East Asia Market Value Share (%) and BPS Analysis by Route of Administration, 2025 to 2035
  • Figure 113: East Asia Market Y-o-Y Growth (%) Projections by Route of Administration, 2025 to 2035
  • Figure 114: East Asia Market Value (USD Million) Analysis by Distribution Channel, 2020 to 2035
  • Figure 115: East Asia Market Value Share (%) and BPS Analysis by Distribution Channel, 2025 to 2035
  • Figure 116: East Asia Market Y-o-Y Growth (%) Projections by Distribution Channel, 2025 to 2035
  • Figure 117: East Asia Market Attractiveness by Drug Type, 2025 to 2035
  • Figure 118: East Asia Market Attractiveness by Route of Administration, 2025 to 2035
  • Figure 119: East Asia Market Attractiveness by Distribution Channel, 2025 to 2035
  • Figure 120: East Asia Market Attractiveness by Country, 2025 to 2035
  • Figure 121: Oceania Market Value (USD Million) by Drug Type, 2025 to 2035
  • Figure 122: Oceania Market Value (USD Million) by Route of Administration, 2025 to 2035
  • Figure 123: Oceania Market Value (USD Million) by Distribution Channel, 2025 to 2035
  • Figure 124: Oceania Market Value (USD Million) by Country, 2025 to 2035
  • Figure 125: Oceania Market Value (USD Million) Analysis by Country, 2020 to 2035
  • Figure 126: Oceania Market Value Share (%) and BPS Analysis by Country, 2025 to 2035
  • Figure 127: Oceania Market Y-o-Y Growth (%) Projections by Country, 2025 to 2035
  • Figure 128: Oceania Market Value (USD Million) Analysis by Drug Type, 2020 to 2035
  • Figure 129: Oceania Market Value Share (%) and BPS Analysis by Drug Type, 2025 to 2035
  • Figure 130: Oceania Market Y-o-Y Growth (%) Projections by Drug Type, 2025 to 2035
  • Figure 131: Oceania Market Value (USD Million) Analysis by Route of Administration, 2020 to 2035
  • Figure 132: Oceania Market Value Share (%) and BPS Analysis by Route of Administration, 2025 to 2035
  • Figure 133: Oceania Market Y-o-Y Growth (%) Projections by Route of Administration, 2025 to 2035
  • Figure 134: Oceania Market Value (USD Million) Analysis by Distribution Channel, 2020 to 2035
  • Figure 135: Oceania Market Value Share (%) and BPS Analysis by Distribution Channel, 2025 to 2035
  • Figure 136: Oceania Market Y-o-Y Growth (%) Projections by Distribution Channel, 2025 to 2035
  • Figure 137: Oceania Market Attractiveness by Drug Type, 2025 to 2035
  • Figure 138: Oceania Market Attractiveness by Route of Administration, 2025 to 2035
  • Figure 139: Oceania Market Attractiveness by Distribution Channel, 2025 to 2035
  • Figure 140: Oceania Market Attractiveness by Country, 2025 to 2035
  • Figure 141: MEA Market Value (USD Million) by Drug Type, 2025 to 2035
  • Figure 142: MEA Market Value (USD Million) by Route of Administration, 2025 to 2035
  • Figure 143: MEA Market Value (USD Million) by Distribution Channel, 2025 to 2035
  • Figure 144: MEA Market Value (USD Million) by Country, 2025 to 2035
  • Figure 145: MEA Market Value (USD Million) Analysis by Country, 2020 to 2035
  • Figure 146: MEA Market Value Share (%) and BPS Analysis by Country, 2025 to 2035
  • Figure 147: MEA Market Y-o-Y Growth (%) Projections by Country, 2025 to 2035
  • Figure 148: MEA Market Value (USD Million) Analysis by Drug Type, 2020 to 2035
  • Figure 149: MEA Market Value Share (%) and BPS Analysis by Drug Type, 2025 to 2035
  • Figure 150: MEA Market Y-o-Y Growth (%) Projections by Drug Type, 2025 to 2035
  • Figure 151: MEA Market Value (USD Million) Analysis by Route of Administration, 2020 to 2035
  • Figure 152: MEA Market Value Share (%) and BPS Analysis by Route of Administration, 2025 to 2035
  • Figure 153: MEA Market Y-o-Y Growth (%) Projections by Route of Administration, 2025 to 2035
  • Figure 154: MEA Market Value (USD Million) Analysis by Distribution Channel, 2020 to 2035
  • Figure 155: MEA Market Value Share (%) and BPS Analysis by Distribution Channel, 2025 to 2035
  • Figure 156: MEA Market Y-o-Y Growth (%) Projections by Distribution Channel, 2025 to 2035
  • Figure 157: MEA Market Attractiveness by Drug Type, 2025 to 2035
  • Figure 158: MEA Market Attractiveness by Route of Administration, 2025 to 2035
  • Figure 159: MEA Market Attractiveness by Distribution Channel, 2025 to 2035
  • Figure 160: MEA Market Attractiveness by Country, 2025 to 2035

Frequently Asked Questions

What was the overall size of the Herpes Labialis Treatment market in 2025?

The overall market size for Herpes Labialis Treatment market was USD 1,238.7 Million in 2025.

How big the bio is based Herpes Labialis Treatment market expected in 2035?

The Herpes Labialis Treatment market is expected to reach USD 1,887.1 Million in 2035.

What will drive the demand for Herpes Labialis Treatment market during the forecast period?

The demand for herpes labialis treatment will be driven by increasing prevalence of cold sores, advancements in antiviral drugs.

List the top 5 countries contributing in Herpes Labialis Treatment market?

The top 5 countries which drives the development of Herpes Labialis Treatment market are USA, European Union, Japan, South Korea and UK.

Which segment in type is expected to lead Herpes Labialis Treatment market?

Acyclovir demand supplier to command significant share over the assessment period.

Explore Similar Insights

Future Market Insights

Herpes Labialis Treatment Market