Reports

- Global Locations -

Headquarters

Future Market Insights, Inc.

Christiana Corporate, 200
Continental Drive, Suite 401,
Newark, Delaware - 19713,
United States

T: +1-845-579-5705

Americas

Future Market Insights, Inc.

616 Corporate Way, Suite 2-9018,
Valley Cottage, NY 10989, United States

T: +1-347-918-3531

MEA

Future Market Insights

1602-6 Jumeirah Bay X2 Tower, Plot No: JLT-PH2-X2A,
Jumeirah Lakes Towers, Dubai,
United Arab Emirates

Europe

Future Market Insights

3rd Floor, 207 Regent Street,
W1B 3HH London
United Kingdom

T: + 44 (0) 20 8123 9659
D: +44 (0) 20 3287 4268

Asia Pacific

Future Market Insights

IndiaLand Global Tech Park, Unit UG-1, Behind Grand HighStreet, Phase 1, Hinjawadi, MH, Pune – 411057, India

Home Healthcare Market Outlook

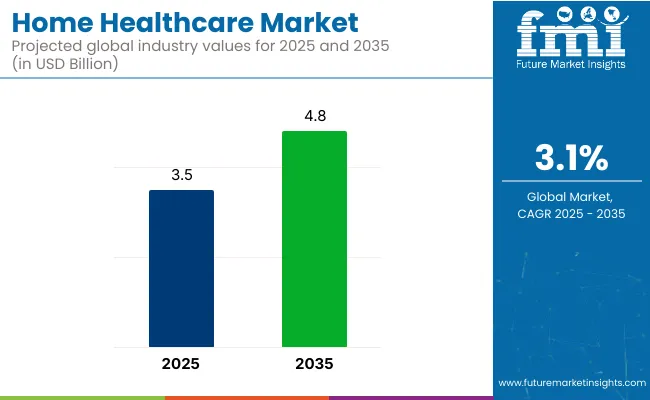
The home healthcare market is predicted to capture a valuation of US$ 3.2 billion in 2023 and is estimated to grow at US$ 4.4 billion by 2033. The market is estimated to register a CAGR of 3.1% during the forecast period. Factors that drive the market size are given below:

  • The increasing aged population and chronic patients are accelerating the demand for home healthcare.
  • Rising complex medications, unable to receive regular treatment in hospitals, and inability to walk are increasing the adoption of home healthcare.
  • The growing demand for advanced home-care technology is driving market opportunities.
  • Increasing demand for home healthcare, due to easily available home healthcare services without making efforts to make hospital queues.
  • Innovations in in-home healthcare services are increasing to reduce emergency visits and pay huge costs of nursing.
  • The adoption of remote patient monitoring devices to transmit patients' healthcare information is increasing demand for home healthcare by service providers.

Don't pay for what you don't need

Customize your report by selecting specific countries or regions and save 30%!

What Challenges Limit the Market Growth?

  • The shortage of professional home healthcare service providers is estimated to decrease the market growth.
  • The increasing cost of evaluations, such as providing medical facilities and health hygiene, limits market growth.
  • The unavailability of home healthcare devices and low production are other factors restraining the market growth.

How are Manufacturers Making Efforts in the Market Expansion?

Prominent manufacturers are developing advanced healthcare devices to enhance the quality of treatment among patients. These manufacturers are making highly supportive devices that are easy to access, increasing patients' demand for home healthcare. Manufacturers' focus on providing environment-friendly medical devices propels market opportunities during the forecast period.

The adoption of telemedicine and digital monitoring equipment in emergencies are surging market opportunities. This equipment reduces a load of treatment due to its feature of easy to access and monitor patient's health. These are the few factors advancing the market growth with the manufacturer's innovations in the healthcare sector.

Attributes Details
Market CAGR (2023 to 2033) 3.1%
Market Valuation (2023) US$ 3.2 billion
Market Valuation (2033) US$ 4.4 billion
Sabyasachi Ghosh
Sabyasachi Ghosh

Principal Consultant

Talk to Analyst

Find your sweet spots for generating winning opportunities in this market.

Home Healthcare Market, 2017 to 2022 Historical Sales, Compared to 2023 to 2033 Future Outlook

According to Future Market Insights, the global home healthcare market is predicted at a healthy 3.1% CAGR during the forecast period. Historically, the market registered a CAGR of 2.6% between 2017 and 2022.

Introducing easy-to-use and portable medical devices have shifted patients' demand from hospitals to home healthcare in recent years. Increase in daily medical checkups and elder age people staying at home are fuelling the demand for home healthcare. The adoption of Artificial Intelligence and the Internet of Things are developing smart devices which have taken the place of traditional healthcare systems.

Through these smart devices patients can check and manage their insulin levels with the use of insulin pens. The adoption of remote system devices for monitoring and reducing the overall cost are increasing the demand for home healthcare. Improvement in the quality of healthcare through relationship-based home care models for the disabled and geriatrics is fueling the market expansion.

  • Short Term (2023 to 2026): Growing demand for home healthcare due to the increasing old-age population and low-cost treatments.
  • Medium Term (2026 to 2029): The increasing adoption of home healthcare services to maintain comfort, reduce emergency visits, and increase complex medication.
  • Long Term (2029 to 2033): The innovation of advanced healthcare devices, robotic services, and remote patient monitoring are driving the market opportunities.

The market is estimated to reach US$ 4.4 billion during the forecast period. Historically, the market stood at US$ 3.1 billion from 2017 to 2022.

Comparative Analysis of Adjacent Markets

Home Healthcare Market:

Attributes Home Healthcare Market
CAGR (2023 to 2033) 3.1%
Value (2023) US$ 3.2 billion
Value (2033) US$ 4.4 billion
Trends The increasing adoption of home healthcare services to maintain comfort, reduce emergency visits, and increase complex medication.
Opportunities Innovation of advanced healthcare devices, robotic services, and remote patient monitoring are driving market opportunities.

Digital Health Market:

Attributes Digital Health Market
CAGR (2023 to 2033) 17.9%
Value (2023) US$ 237.63 billion
Value (2033) US$ 1,233.22 billion
Trends Rising adoption of wearable devices, communication technology, and remote monitoring services.
Opportunities Advancement of blood pressure monitor and rising governments initiative for health concerns

Chronic Disease Management Market:

Attributes Chronic Disease Management Market
CAGR (2023 to 2033) 13.4%
Value (2023) US$ 4.88 billion
Value (2033) US$ 17.16 billion
Trends Increasing screening, daily check-ups, and coordinating treatment.
Opportunities Improvement in quality of life, advanced medical attention and expanding research, and development activities.

Get the data you need at a Fraction of the cost

Personalize your report by choosing insights you need
and save 40%!

Top Two Segment in the Market

Segments Product Type
Top Category Infusion Systems
Historic CAGR 2.6%
Forecast CAGR 3.0%
Segments Application
Top Category Stoma Care
Historic CAGR 2.6%
Forecast CAGR 3.6%

Which Category is Leading the Home Healthcare Product Type?

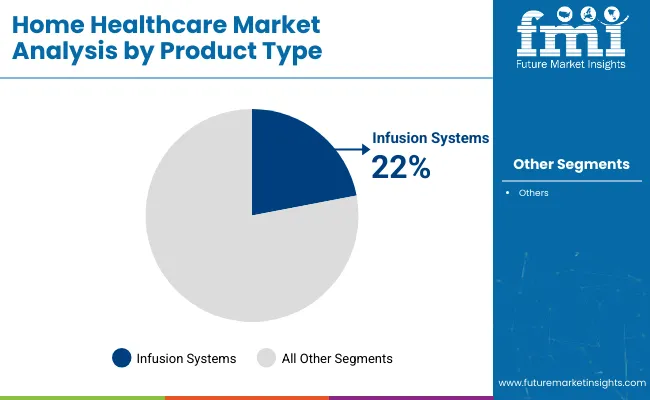
Based on product type, the infusion systems dominate the global market by occupying a CAGR of 3.0% during the forecast period. The adoption of infusion systems in-home healthcare services boosts market opportunities. As a result, infusion systems capture a huge revenue in the global market to supply liquid to patients’ bodies.

The rising adoption of infusion pumps is to deliver nutrients, pain relievers, antibiotics, and other medical doses. Clinical settings such as hospitals, nursing homes, and private residences drive market growth.

Additional features such as sirens, security measures, and other warnings are growing the sales of infusion systems. Historically, the infusion systems captured a CAGR of 2.6% between 2017 and 2022.

Which Application Emerging as a Key Market Contributor?

The stoma care application is expected to account for a CAGR of 3.6% during the forecast period. Adopting stoma care in home healthcare contributes to treat infections and rashes. The nurses and stoma specialists provide stoma care at home, traveling and ensuring convenience to the patients.

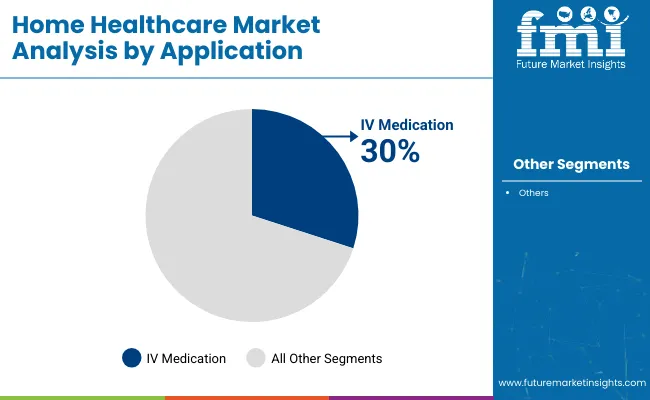
Intravenous (IV) medication is also expected to offer potential growth avenues to manufacturers of home healthcare systems. By 2033, the application area would represent a multi-billion-dollar opportunity. Historically, stoma care secured a CAGR of 2.6% between 2017 and 2022.

Top Countries Data Table Mentioned Below:

Country United States
CAGR (2017 to 2022) 2.9%
CAGR (2023 to 2023) 3.5%
Valuation (2023 to 2033) US$ 1.3 billion
Country United Kingdom
CAGR (2017 to 2022) 3.2%
CAGR (2023 to 2023) 3.9%
Valuation (2023 to 2033) US$ 357.5 million
Country China
CAGR (2017 to 2022) 2.4%
CAGR (2023 to 2023) 2.9%
Valuation (2023 to 2033) US$ 316 million
Country Japan
CAGR (2017 to 2022) 2.9%
CAGR (2023 to 2023) 3.4%
Valuation (2023 to 2033) US$ 246.6 million
Country South Korea
CAGR (2017 to 2022) 1.9%
CAGR (2023 to 2023) 2.4%
Valuation (2023 to 2033) US$ 49.7 million

The United States Exhibits Steady Growth in the Market?

The United States secures a CAGR of 3.5% with a valuation of US$ 1.3 billion during the forecast period. Rising advanced healthcare infrastructure, the shift towards in-home healthcare services, and the growing generic population are expanding the United States home healthcare market. The increasing demand for nursing homes for private home health aides in the United States propels market share.

The growing aging population, wearable patient monitoring devices, and disposable income are accelerating the demand for home healthcare in the United States. Historically, the United States captured a CAGR of 2.9% between 2017 and 2022.

Innovation in Medical Home Healthcare Drives China Market?

China is expected to progress at significant growth by securing a CAGR of 2.9% with a valuation of US$ 316 million during the forecast period. The growing significant urbanization, healthcare infrastructure, and advanced healthcare equipment drive China's home healthcare market. The rising chronic patients is increasing the adoption of home healthcare products and services.

Increasing medical supervision, individualized healthcare services, and home medical devices are the important factors driving the China market. Historically, China captured a CAGR of 2.4% between 2017 and 2022.

Growing Healthcare Infrastructure increases Japan Market Opportunities

Japan is securing a significant CAGR of 3.4% with a valuation of US$ 246.6 million during the forecast period. Furthermore, Japan is continuously growing the Asia Pacific market share through the initiative hospital at-home program, which reduced the cost of treatment by over 30%. In addition, the government is promoting home healthcare services to uplift the Japan home healthcare market growth.

There are various healthcare sectors that offer home care to patients, including baby and mother care, elderly care, and others. Additionally, the adoption of home healthcare also includes personalized and medical supervision healthcare services. Historically, Japan captured a CAGR of 2.9% between 2017 and 2022.

Government Initiative Plan Propels the United Kingdom Market

The United Kingdom secures a CAGR of 3.9% with valuation of US$ 357.5 million during the forecast period. The rising disposable income, patients' preferences for treatment at home, and chronic diseases are increasing the demand for home healthcare in the country. In addition, rising government initiatives presence of healthcare providers and key manufacturers are the crucial factors bolstering the United Kingdom home healthcare market. Historically, the United Kingdom captured a CAGR of 3.2% between 2017 and 2022.

Competitive Landscape

The prominent players are fragments of the global market by occupying a significant revenue. The market players are developing innovative devices and medical equipment to maintain daily check-ups at home. These devices are advanced and equipped with artificial intelligence, and new technology is flourishing the market expansion.

Healthcare providers prefer these devices to check patients' daily healthcare routine at the hospital, home, or any place. These players focus on developing easy-to-use equipment and adopting several marketing strategies to increase home healthcare sales. The rising popularity of online distribution channel is easy to reach relevant consumers and acquire huge market revenue.

Key Players operating in the Market are:

  • Coloplast A/S
  • B. Braun Melsungen AG
  • Baxter International Inc.
  • Hollister Incorporated
  • Becton Dickinson and Co
  • ConvaTec Group Plc
  • Medtronic plc.
  • Amedisys Home Health and Hospice Care
  • American Well
  • CVS Health
  • Humana Inc.
  • LHC Group Inc.
  • Kindred Healthcare

Recent Developments

  • In Aug 2020, Fresenius Medical Care acquired United States-based InterWell Health for expertise in kidney care and enhanced its performance.
  • In Aug 2022, the United States-based Contessa partnered with Mount Sinai Health System to offer home-care facilities such as rehabilitation at home and hospital at home with skilled nursing services.
  • In July 2022, the United States-based Invacare Corporation introduced a new generation healthcare device, e-fix eco power assist in transferring wheelchairs.

Scope of Report

Attribute Details
Forecast Period 2023 to 2033
Historical Data Available for 2017 to 2022
Market Analysis US$ billion for Value
Key Countries Covered United States, Canada, Germany, United Kingdom, France, Italy, Spain, Russia, China, Japan, South Korea, India, Thailand, Malaysia, Indonesia, Australia, New Zealand, GCC Countries, Northern Africa, and South Africa, Türkiye
Key Segments Covered
  • Product Type
  • Application
  • Region
Key Companies Profiled
  • Coloplast A/S
  • B. Braun Melsungen AG
  • Baxter International Inc.
  • Hollister Incorporated
  • Becton Dickinson and Co
  • ConvaTec Group Plc
  • Medtronic plc.
  • Amedisys Home Health and Hospice Care
  • American Well
  • CVS Health
  • Humana Inc.
  • LHC Group Inc.
  • Kindred Healthcare
Report Coverage Market Forecast, Company Share Analysis, Competition Intelligence, DROT Analysis, Market Dynamics and Challenges, and Strategic Growth Initiatives
Customization & Pricing Available upon Request

Home Healthcare Market Segmentation by Category

By Product Type:

  • Infusion Systems
    • Ambulatory Infusion Pumps
    • Implantable Infusion Pumps
    • Infusion Disposable Sets
    • Syringe Pumps
    • Volumetric Pumps
  • Pressure Relief Devices
    • Mattress Overlays
    • Mattresses
    • Specialty Beds
  • Hydrocolloids Dressings
  • Hydrofibres Dressings
  • Hydrogels Dressings
  • Semi-permeable Films Dressings
  • Superabsorbents Dressings
  • Wound Contact Layers
  • Gauze Sponges
  • Gauzes
  • Sponges
  • Ostomy Drainage Bags

By Application:

  • Total Parenteral Nutrition
  • IV Medication
  • Pressure Ulcer
  • Stoma Care

By Region:

  • North America
  • Latin America
  • Europe
  • South Asia & Pacific
  • East Asia
  • The Middle East & Africa (MEA)

Frequently Asked Questions

How is the Home Healthcare Market Growing?

The home healthcare market is predicted to record a 3.1% CAGR through 2033.

What Drives the Home Healthcare Market?

Hospital sector drives the home healthcare market.

What is the Future Scope of Growth for the Home Healthcare Market?

The home healthcare market is expected to surpass US$ 4.4 billion by 2033.

What is the Home Healthcare Market Size?

The home healthcare market is anticipated to be US$ 3.2 billion in 2023.

Which Country Leads the Home Healthcare Market?

The United States leads the home healthcare market during the forecast period.

Table of Content

1. Executive Summary | Home Healthcare Market

    1.1. Global Market Outlook

    1.2. Demand-side Trends

    1.3. Supply-side Trends

    1.4. Technology Roadmap Analysis

    1.5. Analysis and Recommendations

2. Market Overview

    2.1. Market Coverage / Taxonomy

    2.2. Market Definition / Scope / Limitations

3. Market Background

    3.1. Market Dynamics

        3.1.1. Drivers

        3.1.2. Restraints

        3.1.3. Opportunity

        3.1.4. Trends

    3.2. Scenario Forecast

        3.2.1. Demand in Optimistic Scenario

        3.2.2. Demand in Likely Scenario

        3.2.3. Demand in Conservative Scenario

    3.3. Opportunity Map Analysis

    3.4. Product Life Cycle Analysis

    3.5. Supply Chain Analysis

        3.5.1. Supply Side Participants and their Roles

            3.5.1.1. Producers

            3.5.1.2. Mid-Level Participants (Traders/ Agents/ Brokers)

            3.5.1.3. Wholesalers and Distributors

        3.5.2. Value Added and Value Created at Node in the Supply Chain

        3.5.3. List of Raw Material Suppliers

        3.5.4. List of Existing and Potential Buyer’s

    3.6. Investment Feasibility Matrix

    3.7. Value Chain Analysis

        3.7.1. Profit Margin Analysis

        3.7.2. Wholesalers and Distributors

        3.7.3. Retailers

    3.8. PESTLE and Porter’s Analysis

    3.9. Regulatory Landscape

        3.9.1. By Key Regions

        3.9.2. By Key Countries

    3.10. Regional Parent Market Outlook

    3.11. Production and Consumption Statistics

    3.12. Import and Export Statistics

4. Global Market Analysis 2017 to 2022 and Forecast, 2023 to 2033

    4.1. Historical Market Size Value (US$ Million) & Volume (Units) Analysis, 2017 to 2022

    4.2. Current and Future Market Size Value (US$ Million) & Volume (Units) Projections, 2023 to 2033

        4.2.1. Y-o-Y Growth Trend Analysis

        4.2.2. Absolute $ Opportunity Analysis

5. Global Market Analysis 2017 to 2022 and Forecast 2023 to 2033, By Product Type

    5.1. Introduction / Key Findings

    5.2. Historical Market Size Value (US$ Million) & Volume (Units) Analysis By Product Type, 2017 to 2022

    5.3. Current and Future Market Size Value (US$ Million) & Volume (Units) Analysis and Forecast By Product Type, 2023 to 2033

        5.3.1. Infusion Systems

            5.3.1.1. Ambulatory Infusion Pumps

            5.3.1.2. Implantable Infusion Pumps

            5.3.1.3. Infusion Disposable Sets

            5.3.1.4. Syringe Pumps

            5.3.1.5. Volumetric Pumps

        5.3.2. Pressure Relief Devices

            5.3.2.1. Mattress Overlays

            5.3.2.2. Mattresses

            5.3.2.3. Specialty Beds

        5.3.3. Hydrocolloids Dressings

        5.3.4. Hydrofibres Dressings

        5.3.5. Hydrogels Dressings

        5.3.6. Semi-Permeable Films Dressings

        5.3.7. Superabsorbents Dressings

        5.3.8. Wound Contact Layers

        5.3.9. Gauze Sponges

        5.3.10. Gauzes

        5.3.11. Sponges

        5.3.12. Ostomy Drainage Bags

    5.4. Y-o-Y Growth Trend Analysis By Product Type, 2017 to 2022

    5.5. Absolute $ Opportunity Analysis By Product Type, 2023 to 2033

6. Global Market Analysis 2017 to 2022 and Forecast 2023 to 2033, By Application

    6.1. Introduction / Key Findings

    6.2. Historical Market Size Value (US$ Million) & Volume (Units) Analysis By Application, 2017 to 2022

    6.3. Current and Future Market Size Value (US$ Million) & Volume (Units) Analysis and Forecast By Application, 2023 to 2033

        6.3.1. Total Parenteral Nutrition

        6.3.2. IV Medication

        6.3.3. Pressure Ulcer

        6.3.4. Stoma Care

    6.4. Y-o-Y Growth Trend Analysis By Application, 2017 to 2022

    6.5. Absolute $ Opportunity Analysis By Application, 2023 to 2033

7. Global Market Analysis 2017 to 2022 and Forecast 2023 to 2033, By Region

    7.1. Introduction

    7.2. Historical Market Size Value (US$ Million) & Volume (Units) Analysis By Region, 2017 to 2022

    7.3. Current Market Size Value (US$ Million) & Volume (Units) Analysis and Forecast By Region, 2023 to 2033

        7.3.1. North America

        7.3.2. Latin America

        7.3.3. Europe

        7.3.4. East Asia

        7.3.5. South Asia

        7.3.6. Oceania

        7.3.7. Middle East and Africa

    7.4. Market Attractiveness Analysis By Region

8. North America Market Analysis 2017 to 2022 and Forecast 2023 to 2033, By Country

    8.1. Historical Market Size Value (US$ Million) & Volume (Units) Trend Analysis By Market Taxonomy, 2017 to 2022

    8.2. Market Size Value (US$ Million) & Volume (Units) Forecast By Market Taxonomy, 2023 to 2033

        8.2.1. By Country

            8.2.1.1. The USA

            8.2.1.2. Canada

        8.2.2. By Product Type

        8.2.3. By Application

    8.3. Market Attractiveness Analysis

        8.3.1. By Country

        8.3.2. By Product Type

        8.3.3. By Application

    8.4. Key Takeaways

9. Latin America Market Analysis 2017 to 2022 and Forecast 2023 to 2033, By Country

    9.1. Historical Market Size Value (US$ Million) & Volume (Units) Trend Analysis By Market Taxonomy, 2017 to 2022

    9.2. Market Size Value (US$ Million) & Volume (Units) Forecast By Market Taxonomy, 2023 to 2033

        9.2.1. By Country

            9.2.1.1. Brazil

            9.2.1.2. Mexico

            9.2.1.3. Argentina

            9.2.1.4. Rest of Latin America

        9.2.2. By Product Type

        9.2.3. By Application

    9.3. Market Attractiveness Analysis

        9.3.1. By Country

        9.3.2. By Product Type

        9.3.3. By Application

    9.4. Key Takeaways

10. Europe Market Analysis 2017 to 2022 and Forecast 2023 to 2033, By Country

    10.1. Historical Market Size Value (US$ Million) & Volume (Units) Trend Analysis By Market Taxonomy, 2017 to 2022

    10.2. Market Size Value (US$ Million) & Volume (Units) Forecast By Market Taxonomy, 2023 to 2033

        10.2.1. By Country

            10.2.1.1. United Kingdom (UK)

            10.2.1.2. Germany

            10.2.1.3. France

            10.2.1.4. Italy

            10.2.1.5. Spain

            10.2.1.6. Russia

            10.2.1.7. Rest of Europe

        10.2.2. By Product Type

        10.2.3. By Application

    10.3. Market Attractiveness Analysis

        10.3.1. By Country

        10.3.2. By Product Type

        10.3.3. By Application

    10.4. Key Takeaways

11. East Asia Market Analysis 2017 to 2022 and Forecast 2023 to 2033, By Country

    11.1. Historical Market Size Value (US$ Million) & Volume (Units) Trend Analysis By Market Taxonomy, 2017 to 2022

    11.2. Market Size Value (US$ Million) & Volume (Units) Forecast By Market Taxonomy, 2023 to 2033

        11.2.1. By Country

            11.2.1.1. China

            11.2.1.2. Japan

            11.2.1.3. South Korea

        11.2.2. By Product Type

        11.2.3. By Application

    11.3. Market Attractiveness Analysis

        11.3.1. By Country

        11.3.2. By Product Type

        11.3.3. By Application

    11.4. Key Takeaways

12. South Asia Market Analysis 2017 to 2022 and Forecast 2023 to 2033, By Country

    12.1. Historical Market Size Value (US$ Million) & Volume (Units) Trend Analysis By Market Taxonomy, 2017 to 2022

    12.2. Market Size Value (US$ Million) & Volume (Units) Forecast By Market Taxonomy, 2023 to 2033

        12.2.1. By Country

            12.2.1.1. India

            12.2.1.2. Indonesia

            12.2.1.3. Thailand

            12.2.1.4. Malaysia

            12.2.1.5. Rest of South Asia

        12.2.2. By Product Type

        12.2.3. By Application

    12.3. Market Attractiveness Analysis

        12.3.1. By Country

        12.3.2. By Product Type

        12.3.3. By Application

    12.4. Key Takeaways

13. Oceania Market Analysis 2017 to 2022 and Forecast 2023 to 2033, By Country

    13.1. Historical Market Size Value (US$ Million) & Volume (Units) Trend Analysis By Market Taxonomy, 2017 to 2022

    13.2. Market Size Value (US$ Million) & Volume (Units) Forecast By Market Taxonomy, 2023 to 2033

        13.2.1. By Country

            13.2.1.1. Australia

            13.2.1.2. New Zealand

        13.2.2. By Product Type

        13.2.3. By Application

    13.3. Market Attractiveness Analysis

        13.3.1. By Country

        13.3.2. By Product Type

        13.3.3. By Application

    13.4. Key Takeaways

14. Middle East and Africa Market Analysis 2017 to 2022 and Forecast 2023 to 2033, By Country

    14.1. Historical Market Size Value (US$ Million) & Volume (Units) Trend Analysis By Market Taxonomy, 2017 to 2022

    14.2. Market Size Value (US$ Million) & Volume (Units) Forecast By Market Taxonomy, 2023 to 2033

        14.2.1. By Country

            14.2.1.1. South Africa

            14.2.1.2. Türkiye

            14.2.1.3. GCC Countries

            14.2.1.4. Rest of Middle East and Africa

        14.2.2. By Product Type

        14.2.3. By Application

    14.3. Market Attractiveness Analysis

        14.3.1. By Country

        14.3.2. By Product Type

        14.3.3. By Application

    14.4. Key Takeaways

15. Key Countries Market Analysis

    15.1. USA

        15.1.1. Pricing Analysis

        15.1.2. Market Share Analysis, 2022

            15.1.2.1. By Product Type

            15.1.2.2. By Application

    15.2. Canada

        15.2.1. Pricing Analysis

        15.2.2. Market Share Analysis, 2022

            15.2.2.1. By Product Type

            15.2.2.2. By Application

    15.3. Brazil

        15.3.1. Pricing Analysis

        15.3.2. Market Share Analysis, 2022

            15.3.2.1. By Product Type

            15.3.2.2. By Application

    15.4. Mexico

        15.4.1. Pricing Analysis

        15.4.2. Market Share Analysis, 2022

            15.4.2.1. By Product Type

            15.4.2.2. By Application

    15.5. Argentina

        15.5.1. Pricing Analysis

        15.5.2. Market Share Analysis, 2022

            15.5.2.1. By Product Type

            15.5.2.2. By Application

    15.6. UK

        15.6.1. Pricing Analysis

        15.6.2. Market Share Analysis, 2022

            15.6.2.1. By Product Type

            15.6.2.2. By Application

    15.7. Germany

        15.7.1. Pricing Analysis

        15.7.2. Market Share Analysis, 2022

            15.7.2.1. By Product Type

            15.7.2.2. By Application

    15.8. France

        15.8.1. Pricing Analysis

        15.8.2. Market Share Analysis, 2022

            15.8.2.1. By Product Type

            15.8.2.2. By Application

    15.9. Italy

        15.9.1. Pricing Analysis

        15.9.2. Market Share Analysis, 2022

            15.9.2.1. By Product Type

            15.9.2.2. By Application

    15.10. Spain

        15.10.1. Pricing Analysis

        15.10.2. Market Share Analysis, 2022

            15.10.2.1. By Product Type

            15.10.2.2. By Application

    15.11. Russia

        15.11.1. Pricing Analysis

        15.11.2. Market Share Analysis, 2022

            15.11.2.1. By Product Type

            15.11.2.2. By Application

    15.12. China

        15.12.1. Pricing Analysis

        15.12.2. Market Share Analysis, 2022

            15.12.2.1. By Product Type

            15.12.2.2. By Application

    15.13. Japan

        15.13.1. Pricing Analysis

        15.13.2. Market Share Analysis, 2022

            15.13.2.1. By Product Type

            15.13.2.2. By Application

    15.14. South Korea

        15.14.1. Pricing Analysis

        15.14.2. Market Share Analysis, 2022

            15.14.2.1. By Product Type

            15.14.2.2. By Application

    15.15. India

        15.15.1. Pricing Analysis

        15.15.2. Market Share Analysis, 2022

            15.15.2.1. By Product Type

            15.15.2.2. By Application

    15.16. Indonesia

        15.16.1. Pricing Analysis

        15.16.2. Market Share Analysis, 2022

            15.16.2.1. By Product Type

            15.16.2.2. By Application

    15.17. Thailand

        15.17.1. Pricing Analysis

        15.17.2. Market Share Analysis, 2022

            15.17.2.1. By Product Type

            15.17.2.2. By Application

    15.18. Malaysia

        15.18.1. Pricing Analysis

        15.18.2. Market Share Analysis, 2022

            15.18.2.1. By Product Type

            15.18.2.2. By Application

    15.19. Australia

        15.19.1. Pricing Analysis

        15.19.2. Market Share Analysis, 2022

            15.19.2.1. By Product Type

            15.19.2.2. By Application

    15.20. New Zealand

        15.20.1. Pricing Analysis

        15.20.2. Market Share Analysis, 2022

            15.20.2.1. By Product Type

            15.20.2.2. By Application

    15.21. South Africa

        15.21.1. Pricing Analysis

        15.21.2. Market Share Analysis, 2022

            15.21.2.1. By Product Type

            15.21.2.2. By Application

    15.22. Türkiye

        15.22.1. Pricing Analysis

        15.22.2. Market Share Analysis, 2022

            15.22.2.1. By Product Type

            15.22.2.2. By Application

    15.23. GCC Countries

        15.23.1. Pricing Analysis

        15.23.2. Market Share Analysis, 2022

            15.23.2.1. By Product Type

            15.23.2.2. By Application

16. Market Structure Analysis

    16.1. Competition Dashboard

    16.2. Competition Benchmarking

    16.3. Market Share Analysis of Top Players

        16.3.1. By Regional

        16.3.2. By Product Type

        16.3.3. By Application

17. Competition Analysis

    17.1. Competition Deep Dive

        17.1.1. Coloplast A/S

            17.1.1.1. Overview

            17.1.1.2. Product Portfolio

            17.1.1.3. Profitability by Market Segments

            17.1.1.4. Sales Footprint

            17.1.1.5. Strategy Overview

                17.1.1.5.1. Marketing Strategy

                17.1.1.5.2. Product Strategy

                17.1.1.5.3. Channel Strategy

        17.1.2. B. Braun Melsungen AG

            17.1.2.1. Overview

            17.1.2.2. Product Portfolio

            17.1.2.3. Profitability by Market Segments

            17.1.2.4. Sales Footprint

            17.1.2.5. Strategy Overview

                17.1.2.5.1. Marketing Strategy

                17.1.2.5.2. Product Strategy

                17.1.2.5.3. Channel Strategy

        17.1.3. Baxter International Inc.

            17.1.3.1. Overview

            17.1.3.2. Product Portfolio

            17.1.3.3. Profitability by Market Segments

            17.1.3.4. Sales Footprint

            17.1.3.5. Strategy Overview

                17.1.3.5.1. Marketing Strategy

                17.1.3.5.2. Product Strategy

                17.1.3.5.3. Channel Strategy

        17.1.4. Hollister Incorporated

            17.1.4.1. Overview

            17.1.4.2. Product Portfolio

            17.1.4.3. Profitability by Market Segments

            17.1.4.4. Sales Footprint

            17.1.4.5. Strategy Overview

                17.1.4.5.1. Marketing Strategy

                17.1.4.5.2. Product Strategy

                17.1.4.5.3. Channel Strategy

        17.1.5. Becton Dickinson and Co

            17.1.5.1. Overview

            17.1.5.2. Product Portfolio

            17.1.5.3. Profitability by Market Segments

            17.1.5.4. Sales Footprint

            17.1.5.5. Strategy Overview

                17.1.5.5.1. Marketing Strategy

                17.1.5.5.2. Product Strategy

                17.1.5.5.3. Channel Strategy

        17.1.6. ConvaTec Group Plc

            17.1.6.1. Overview

            17.1.6.2. Product Portfolio

            17.1.6.3. Profitability by Market Segments

            17.1.6.4. Sales Footprint

            17.1.6.5. Strategy Overview

                17.1.6.5.1. Marketing Strategy

                17.1.6.5.2. Product Strategy

                17.1.6.5.3. Channel Strategy

        17.1.7. Medtronic plc.

            17.1.7.1. Overview

            17.1.7.2. Product Portfolio

            17.1.7.3. Profitability by Market Segments

            17.1.7.4. Sales Footprint

            17.1.7.5. Strategy Overview

                17.1.7.5.1. Marketing Strategy

                17.1.7.5.2. Product Strategy

                17.1.7.5.3. Channel Strategy

        17.1.8. Amedisys Home Health and Hospice Care

            17.1.8.1. Overview

            17.1.8.2. Product Portfolio

            17.1.8.3. Profitability by Market Segments

            17.1.8.4. Sales Footprint

            17.1.8.5. Strategy Overview

                17.1.8.5.1. Marketing Strategy

                17.1.8.5.2. Product Strategy

                17.1.8.5.3. Channel Strategy

        17.1.9. American Well

            17.1.9.1. Overview

            17.1.9.2. Product Portfolio

            17.1.9.3. Profitability by Market Segments

            17.1.9.4. Sales Footprint

            17.1.9.5. Strategy Overview

                17.1.9.5.1. Marketing Strategy

                17.1.9.5.2. Product Strategy

                17.1.9.5.3. Channel Strategy

        17.1.10. CVS Health

            17.1.10.1. Overview

            17.1.10.2. Product Portfolio

            17.1.10.3. Profitability by Market Segments

            17.1.10.4. Sales Footprint

            17.1.10.5. Strategy Overview

                17.1.10.5.1. Marketing Strategy

                17.1.10.5.2. Product Strategy

                17.1.10.5.3. Channel Strategy

        17.1.11. Humana Inc.

            17.1.11.1. Overview

            17.1.11.2. Product Portfolio

            17.1.11.3. Profitability by Market Segments

            17.1.11.4. Sales Footprint

            17.1.11.5. Strategy Overview

                17.1.11.5.1. Marketing Strategy

                17.1.11.5.2. Product Strategy

                17.1.11.5.3. Channel Strategy

        17.1.12. LHC Group Inc.

            17.1.12.1. Overview

            17.1.12.2. Product Portfolio

            17.1.12.3. Profitability by Market Segments

            17.1.12.4. Sales Footprint

            17.1.12.5. Strategy Overview

                17.1.12.5.1. Marketing Strategy

                17.1.12.5.2. Product Strategy

                17.1.12.5.3. Channel Strategy

        17.1.13. Kindred Healthcare

            17.1.13.1. Overview

            17.1.13.2. Product Portfolio

            17.1.13.3. Profitability by Market Segments

            17.1.13.4. Sales Footprint

            17.1.13.5. Strategy Overview

                17.1.13.5.1. Marketing Strategy

                17.1.13.5.2. Product Strategy

                17.1.13.5.3. Channel Strategy

18. Assumptions & Acronyms Used

19. Research Methodology

Don't pay for what you don't need

Customize your report by selecting specific countries or regions and save 30%!

List of Tables

Table 1: Global Market Value (US$ Million) Forecast by Region, 2017 to 2033

Table 2: Global Market Volume (Units) Forecast by Region, 2017 to 2033

Table 3: Global Market Value (US$ Million) Forecast by Product Type, 2017 to 2033

Table 4: Global Market Volume (Units) Forecast by Product Type, 2017 to 2033

Table 5: Global Market Value (US$ Million) Forecast by Application, 2017 to 2033

Table 6: Global Market Volume (Units) Forecast by Application, 2017 to 2033

Table 7: North America Market Value (US$ Million) Forecast by Country, 2017 to 2033

Table 8: North America Market Volume (Units) Forecast by Country, 2017 to 2033

Table 9: North America Market Value (US$ Million) Forecast by Product Type, 2017 to 2033

Table 10: North America Market Volume (Units) Forecast by Product Type, 2017 to 2033

Table 11: North America Market Value (US$ Million) Forecast by Application, 2017 to 2033

Table 12: North America Market Volume (Units) Forecast by Application, 2017 to 2033

Table 13: Latin America Market Value (US$ Million) Forecast by Country, 2017 to 2033

Table 14: Latin America Market Volume (Units) Forecast by Country, 2017 to 2033

Table 15: Latin America Market Value (US$ Million) Forecast by Product Type, 2017 to 2033

Table 16: Latin America Market Volume (Units) Forecast by Product Type, 2017 to 2033

Table 17: Latin America Market Value (US$ Million) Forecast by Application, 2017 to 2033

Table 18: Latin America Market Volume (Units) Forecast by Application, 2017 to 2033

Table 19: Europe Market Value (US$ Million) Forecast by Country, 2017 to 2033

Table 20: Europe Market Volume (Units) Forecast by Country, 2017 to 2033

Table 21: Europe Market Value (US$ Million) Forecast by Product Type, 2017 to 2033

Table 22: Europe Market Volume (Units) Forecast by Product Type, 2017 to 2033

Table 23: Europe Market Value (US$ Million) Forecast by Application, 2017 to 2033

Table 24: Europe Market Volume (Units) Forecast by Application, 2017 to 2033

Table 25: East Asia Market Value (US$ Million) Forecast by Country, 2017 to 2033

Table 26: East Asia Market Volume (Units) Forecast by Country, 2017 to 2033

Table 27: East Asia Market Value (US$ Million) Forecast by Product Type, 2017 to 2033

Table 28: East Asia Market Volume (Units) Forecast by Product Type, 2017 to 2033

Table 29: East Asia Market Value (US$ Million) Forecast by Application, 2017 to 2033

Table 30: East Asia Market Volume (Units) Forecast by Application, 2017 to 2033

Table 31: South Asia Market Value (US$ Million) Forecast by Country, 2017 to 2033

Table 32: South Asia Market Volume (Units) Forecast by Country, 2017 to 2033

Table 33: South Asia Market Value (US$ Million) Forecast by Product Type, 2017 to 2033

Table 34: South Asia Market Volume (Units) Forecast by Product Type, 2017 to 2033

Table 35: South Asia Market Value (US$ Million) Forecast by Application, 2017 to 2033

Table 36: South Asia Market Volume (Units) Forecast by Application, 2017 to 2033

Table 37: Oceania Market Value (US$ Million) Forecast by Country, 2017 to 2033

Table 38: Oceania Market Volume (Units) Forecast by Country, 2017 to 2033

Table 39: Oceania Market Value (US$ Million) Forecast by Product Type, 2017 to 2033

Table 40: Oceania Market Volume (Units) Forecast by Product Type, 2017 to 2033

Table 41: Oceania Market Value (US$ Million) Forecast by Application, 2017 to 2033

Table 42: Oceania Market Volume (Units) Forecast by Application, 2017 to 2033

Table 43: Middle East and Africa Market Value (US$ Million) Forecast by Country, 2017 to 2033

Table 44: Middle East and Africa Market Volume (Units) Forecast by Country, 2017 to 2033

Table 45: Middle East and Africa Market Value (US$ Million) Forecast by Product Type, 2017 to 2033

Table 46: Middle East and Africa Market Volume (Units) Forecast by Product Type, 2017 to 2033

Table 47: Middle East and Africa Market Value (US$ Million) Forecast by Application, 2017 to 2033

Table 48: Middle East and Africa Market Volume (Units) Forecast by Application, 2017 to 2033
Sabyasachi Ghosh
Sabyasachi Ghosh

Principal Consultant

Talk to Analyst

Find your sweet spots for generating winning opportunities in this market.

List of Charts

Figure 1: Global Market Value (US$ Million) by Product Type, 2023 to 2033

Figure 2: Global Market Value (US$ Million) by Application, 2023 to 2033

Figure 3: Global Market Value (US$ Million) by Region, 2023 to 2033

Figure 4: Global Market Value (US$ Million) Analysis by Region, 2017 to 2033

Figure 5: Global Market Volume (Units) Analysis by Region, 2017 to 2033

Figure 6: Global Market Value Share (%) and BPS Analysis by Region, 2023 to 2033

Figure 7: Global Market Y-o-Y Growth (%) Projections by Region, 2023 to 2033

Figure 8: Global Market Value (US$ Million) Analysis by Product Type, 2017 to 2033

Figure 9: Global Market Volume (Units) Analysis by Product Type, 2017 to 2033

Figure 10: Global Market Value Share (%) and BPS Analysis by Product Type, 2023 to 2033

Figure 11: Global Market Y-o-Y Growth (%) Projections by Product Type, 2023 to 2033

Figure 12: Global Market Value (US$ Million) Analysis by Application, 2017 to 2033

Figure 13: Global Market Volume (Units) Analysis by Application, 2017 to 2033

Figure 14: Global Market Value Share (%) and BPS Analysis by Application, 2023 to 2033

Figure 15: Global Market Y-o-Y Growth (%) Projections by Application, 2023 to 2033

Figure 16: Global Market Attractiveness by Product Type, 2023 to 2033

Figure 17: Global Market Attractiveness by Application, 2023 to 2033

Figure 18: Global Market Attractiveness by Region, 2023 to 2033

Figure 19: North America Market Value (US$ Million) by Product Type, 2023 to 2033

Figure 20: North America Market Value (US$ Million) by Application, 2023 to 2033

Figure 21: North America Market Value (US$ Million) by Country, 2023 to 2033

Figure 22: North America Market Value (US$ Million) Analysis by Country, 2017 to 2033

Figure 23: North America Market Volume (Units) Analysis by Country, 2017 to 2033

Figure 24: North America Market Value Share (%) and BPS Analysis by Country, 2023 to 2033

Figure 25: North America Market Y-o-Y Growth (%) Projections by Country, 2023 to 2033

Figure 26: North America Market Value (US$ Million) Analysis by Product Type, 2017 to 2033

Figure 27: North America Market Volume (Units) Analysis by Product Type, 2017 to 2033

Figure 28: North America Market Value Share (%) and BPS Analysis by Product Type, 2023 to 2033

Figure 29: North America Market Y-o-Y Growth (%) Projections by Product Type, 2023 to 2033

Figure 30: North America Market Value (US$ Million) Analysis by Application, 2017 to 2033

Figure 31: North America Market Volume (Units) Analysis by Application, 2017 to 2033

Figure 32: North America Market Value Share (%) and BPS Analysis by Application, 2023 to 2033

Figure 33: North America Market Y-o-Y Growth (%) Projections by Application, 2023 to 2033

Figure 34: North America Market Attractiveness by Product Type, 2023 to 2033

Figure 35: North America Market Attractiveness by Application, 2023 to 2033

Figure 36: North America Market Attractiveness by Country, 2023 to 2033

Figure 37: Latin America Market Value (US$ Million) by Product Type, 2023 to 2033

Figure 38: Latin America Market Value (US$ Million) by Application, 2023 to 2033

Figure 39: Latin America Market Value (US$ Million) by Country, 2023 to 2033

Figure 40: Latin America Market Value (US$ Million) Analysis by Country, 2017 to 2033

Figure 41: Latin America Market Volume (Units) Analysis by Country, 2017 to 2033

Figure 42: Latin America Market Value Share (%) and BPS Analysis by Country, 2023 to 2033

Figure 43: Latin America Market Y-o-Y Growth (%) Projections by Country, 2023 to 2033

Figure 44: Latin America Market Value (US$ Million) Analysis by Product Type, 2017 to 2033

Figure 45: Latin America Market Volume (Units) Analysis by Product Type, 2017 to 2033

Figure 46: Latin America Market Value Share (%) and BPS Analysis by Product Type, 2023 to 2033

Figure 47: Latin America Market Y-o-Y Growth (%) Projections by Product Type, 2023 to 2033

Figure 48: Latin America Market Value (US$ Million) Analysis by Application, 2017 to 2033

Figure 49: Latin America Market Volume (Units) Analysis by Application, 2017 to 2033

Figure 50: Latin America Market Value Share (%) and BPS Analysis by Application, 2023 to 2033

Figure 51: Latin America Market Y-o-Y Growth (%) Projections by Application, 2023 to 2033

Figure 52: Latin America Market Attractiveness by Product Type, 2023 to 2033

Figure 53: Latin America Market Attractiveness by Application, 2023 to 2033

Figure 54: Latin America Market Attractiveness by Country, 2023 to 2033

Figure 55: Europe Market Value (US$ Million) by Product Type, 2023 to 2033

Figure 56: Europe Market Value (US$ Million) by Application, 2023 to 2033

Figure 57: Europe Market Value (US$ Million) by Country, 2023 to 2033

Figure 58: Europe Market Value (US$ Million) Analysis by Country, 2017 to 2033

Figure 59: Europe Market Volume (Units) Analysis by Country, 2017 to 2033

Figure 60: Europe Market Value Share (%) and BPS Analysis by Country, 2023 to 2033

Figure 61: Europe Market Y-o-Y Growth (%) Projections by Country, 2023 to 2033

Figure 62: Europe Market Value (US$ Million) Analysis by Product Type, 2017 to 2033

Figure 63: Europe Market Volume (Units) Analysis by Product Type, 2017 to 2033

Figure 64: Europe Market Value Share (%) and BPS Analysis by Product Type, 2023 to 2033

Figure 65: Europe Market Y-o-Y Growth (%) Projections by Product Type, 2023 to 2033

Figure 66: Europe Market Value (US$ Million) Analysis by Application, 2017 to 2033

Figure 67: Europe Market Volume (Units) Analysis by Application, 2017 to 2033

Figure 68: Europe Market Value Share (%) and BPS Analysis by Application, 2023 to 2033

Figure 69: Europe Market Y-o-Y Growth (%) Projections by Application, 2023 to 2033

Figure 70: Europe Market Attractiveness by Product Type, 2023 to 2033

Figure 71: Europe Market Attractiveness by Application, 2023 to 2033

Figure 72: Europe Market Attractiveness by Country, 2023 to 2033

Figure 73: East Asia Market Value (US$ Million) by Product Type, 2023 to 2033

Figure 74: East Asia Market Value (US$ Million) by Application, 2023 to 2033

Figure 75: East Asia Market Value (US$ Million) by Country, 2023 to 2033

Figure 76: East Asia Market Value (US$ Million) Analysis by Country, 2017 to 2033

Figure 77: East Asia Market Volume (Units) Analysis by Country, 2017 to 2033

Figure 78: East Asia Market Value Share (%) and BPS Analysis by Country, 2023 to 2033

Figure 79: East Asia Market Y-o-Y Growth (%) Projections by Country, 2023 to 2033

Figure 80: East Asia Market Value (US$ Million) Analysis by Product Type, 2017 to 2033

Figure 81: East Asia Market Volume (Units) Analysis by Product Type, 2017 to 2033

Figure 82: East Asia Market Value Share (%) and BPS Analysis by Product Type, 2023 to 2033

Figure 83: East Asia Market Y-o-Y Growth (%) Projections by Product Type, 2023 to 2033

Figure 84: East Asia Market Value (US$ Million) Analysis by Application, 2017 to 2033

Figure 85: East Asia Market Volume (Units) Analysis by Application, 2017 to 2033

Figure 86: East Asia Market Value Share (%) and BPS Analysis by Application, 2023 to 2033

Figure 87: East Asia Market Y-o-Y Growth (%) Projections by Application, 2023 to 2033

Figure 88: East Asia Market Attractiveness by Product Type, 2023 to 2033

Figure 89: East Asia Market Attractiveness by Application, 2023 to 2033

Figure 90: East Asia Market Attractiveness by Country, 2023 to 2033

Figure 91: South Asia Market Value (US$ Million) by Product Type, 2023 to 2033

Figure 92: South Asia Market Value (US$ Million) by Application, 2023 to 2033

Figure 93: South Asia Market Value (US$ Million) by Country, 2023 to 2033

Figure 94: South Asia Market Value (US$ Million) Analysis by Country, 2017 to 2033

Figure 95: South Asia Market Volume (Units) Analysis by Country, 2017 to 2033

Figure 96: South Asia Market Value Share (%) and BPS Analysis by Country, 2023 to 2033

Figure 97: South Asia Market Y-o-Y Growth (%) Projections by Country, 2023 to 2033

Figure 98: South Asia Market Value (US$ Million) Analysis by Product Type, 2017 to 2033

Figure 99: South Asia Market Volume (Units) Analysis by Product Type, 2017 to 2033

Figure 100: South Asia Market Value Share (%) and BPS Analysis by Product Type, 2023 to 2033

Figure 101: South Asia Market Y-o-Y Growth (%) Projections by Product Type, 2023 to 2033

Figure 102: South Asia Market Value (US$ Million) Analysis by Application, 2017 to 2033

Figure 103: South Asia Market Volume (Units) Analysis by Application, 2017 to 2033

Figure 104: South Asia Market Value Share (%) and BPS Analysis by Application, 2023 to 2033

Figure 105: South Asia Market Y-o-Y Growth (%) Projections by Application, 2023 to 2033

Figure 106: South Asia Market Attractiveness by Product Type, 2023 to 2033

Figure 107: South Asia Market Attractiveness by Application, 2023 to 2033

Figure 108: South Asia Market Attractiveness by Country, 2023 to 2033

Figure 109: Oceania Market Value (US$ Million) by Product Type, 2023 to 2033

Figure 110: Oceania Market Value (US$ Million) by Application, 2023 to 2033

Figure 111: Oceania Market Value (US$ Million) by Country, 2023 to 2033

Figure 112: Oceania Market Value (US$ Million) Analysis by Country, 2017 to 2033

Figure 113: Oceania Market Volume (Units) Analysis by Country, 2017 to 2033

Figure 114: Oceania Market Value Share (%) and BPS Analysis by Country, 2023 to 2033

Figure 115: Oceania Market Y-o-Y Growth (%) Projections by Country, 2023 to 2033

Figure 116: Oceania Market Value (US$ Million) Analysis by Product Type, 2017 to 2033

Figure 117: Oceania Market Volume (Units) Analysis by Product Type, 2017 to 2033

Figure 118: Oceania Market Value Share (%) and BPS Analysis by Product Type, 2023 to 2033

Figure 119: Oceania Market Y-o-Y Growth (%) Projections by Product Type, 2023 to 2033

Figure 120: Oceania Market Value (US$ Million) Analysis by Application, 2017 to 2033

Figure 121: Oceania Market Volume (Units) Analysis by Application, 2017 to 2033

Figure 122: Oceania Market Value Share (%) and BPS Analysis by Application, 2023 to 2033

Figure 123: Oceania Market Y-o-Y Growth (%) Projections by Application, 2023 to 2033

Figure 124: Oceania Market Attractiveness by Product Type, 2023 to 2033

Figure 125: Oceania Market Attractiveness by Application, 2023 to 2033

Figure 126: Oceania Market Attractiveness by Country, 2023 to 2033

Figure 127: Middle East and Africa Market Value (US$ Million) by Product Type, 2023 to 2033

Figure 128: Middle East and Africa Market Value (US$ Million) by Application, 2023 to 2033

Figure 129: Middle East and Africa Market Value (US$ Million) by Country, 2023 to 2033

Figure 130: Middle East and Africa Market Value (US$ Million) Analysis by Country, 2017 to 2033

Figure 131: Middle East and Africa Market Volume (Units) Analysis by Country, 2017 to 2033

Figure 132: Middle East and Africa Market Value Share (%) and BPS Analysis by Country, 2023 to 2033

Figure 133: Middle East and Africa Market Y-o-Y Growth (%) Projections by Country, 2023 to 2033

Figure 134: Middle East and Africa Market Value (US$ Million) Analysis by Product Type, 2017 to 2033

Figure 135: Middle East and Africa Market Volume (Units) Analysis by Product Type, 2017 to 2033

Figure 136: Middle East and Africa Market Value Share (%) and BPS Analysis by Product Type, 2023 to 2033

Figure 137: Middle East and Africa Market Y-o-Y Growth (%) Projections by Product Type, 2023 to 2033

Figure 138: Middle East and Africa Market Value (US$ Million) Analysis by Application, 2017 to 2033

Figure 139: Middle East and Africa Market Volume (Units) Analysis by Application, 2017 to 2033

Figure 140: Middle East and Africa Market Value Share (%) and BPS Analysis by Application, 2023 to 2033

Figure 141: Middle East and Africa Market Y-o-Y Growth (%) Projections by Application, 2023 to 2033

Figure 142: Middle East and Africa Market Attractiveness by Product Type, 2023 to 2033

Figure 143: Middle East and Africa Market Attractiveness by Application, 2023 to 2033

Figure 144: Middle East and Africa Market Attractiveness by Country, 2023 to 2033

Recommendations

Healthcare

Pediatric Home Healthcare Market

Published : January 2023

Healthcare

Home Healthcare Software Market

Published : September 2022

Explore Healthcare Insights

View Reports