The hypercoagulability treatment market is estimated to be valued at USD 767.1 million in 2025 and is projected to reach USD 1509.0 million by 2035, registering a compound annual growth rate (CAGR) of 7.0% over the forecast period.
Hematologists evaluate hypercoagulability treatment protocols based on thrombotic risk stratification, bleeding complication profiles, and patient compliance characteristics when managing Factor V Leiden carriers, antiphospholipid syndrome patients, and malignancy-associated thrombosis cases requiring individualized anticoagulation strategies. Therapeutic selection involves analyzing direct oral anticoagulant mechanisms, warfarin monitoring requirements, and low molecular weight heparin administration protocols while considering renal function limitations, drug interaction potentials, and pregnancy safety considerations necessary for optimal patient outcomes. Treatment decisions balance thrombosis prevention effectiveness against hemorrhage risks, incorporating genetic testing results, biomarker assessments, and clinical presentation severity that influence anticoagulation intensity and duration recommendations.
Clinical management requires specialized coagulation laboratories, point-of-care monitoring devices, and multidisciplinary consultation systems that ensure appropriate therapeutic targeting while maintaining safety surveillance throughout diverse patient presentations and treatment phases. Care coordination involves managing laboratory monitoring schedules, dose adjustment protocols, and emergency reversal procedures while addressing patient education, dietary counseling, and activity restriction guidance across varying thrombotic risk categories. Quality assurance procedures encompass therapeutic range maintenance, adverse event documentation, and outcome tracking that validate treatment effectiveness while supporting evidence-based protocol refinement and patient safety optimization.
Interdisciplinary coordination involves hematology specialists, clinical pharmacists, and laboratory technicians collaborating to optimize anticoagulation management that balances therapeutic efficacy with safety monitoring while addressing specific patient characteristics and comorbidity factors. Treatment implementation encompasses baseline assessment completion, monitoring schedule establishment, and patient counseling provision while coordinating with primary care physicians, surgical specialists, and emergency departments. Support systems address medication adherence enhancement, lifestyle modification guidance, and emergency response planning essential for comprehensive hypercoagulability management and optimal patient safety throughout extended treatment periods.
Therapeutic advancement prioritizes personalized anticoagulation strategies, biomarker-guided therapy selection, and reversal agent development that address individual patient risk profiles while reducing treatment-related complications throughout hypercoagulability management. Innovation initiatives include factor-specific inhibitors, targeted thrombin modulators, and platelet function suppressors that expand treatment options while improving safety profiles and patient convenience. Research encompasses genetic risk prediction, artificial intelligence-supported dosing, and real-time coagulation monitoring that optimize therapeutic effectiveness while minimizing adverse events and improving treatment adherence.
Treatment specialization addresses inherited thrombophilias requiring lifelong management strategies, pregnancy-associated hypercoagulability needing specialized monitoring protocols, and malignancy-related thrombosis demanding cancer treatment coordination that leverage anticoagulation expertise for diverse clinical presentations. Healthcare providers coordinate with genetic counselors, obstetric specialists, and oncology teams to establish comprehensive treatment programs that address condition-specific requirements while maintaining therapeutic effectiveness and safety standards. Specialized services encompass anticoagulation clinic management, emergency reversal protocols, and patient education programs that require multidisciplinary expertise and coordinated care delivery.
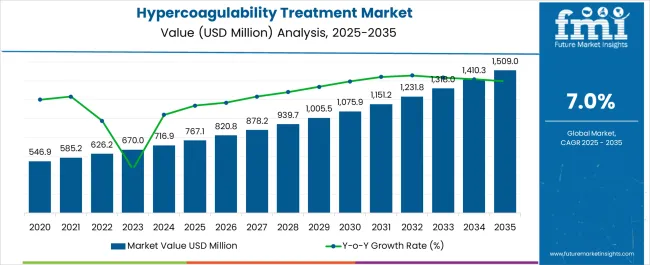
| Metric | Value |
|---|---|
| Hypercoagulability Treatment Market Estimated Value in (2025 E) | USD 767.1 million |
| Hypercoagulability Treatment Market Forecast Value in (2035 F) | USD 1509.0 million |
| Forecast CAGR (2025 to 2035) | 7.0% |
The hypercoagulability treatment market is expanding steadily due to the rising incidence of thrombotic disorders, increasing prevalence of cardiovascular diseases, and the growing adoption of anticoagulant therapies. Heightened awareness regarding early diagnosis and timely intervention has led to greater prescription rates across both developed and emerging economies.
Technological advances in drug formulation, improved patient compliance through oral therapies, and supportive government health initiatives are driving adoption. Additionally, the increasing burden of lifestyle related disorders and the aging global population are further boosting the demand for long term treatment options.
Regulatory focus on ensuring safe and effective therapies is reinforcing confidence among healthcare providers and patients alike. The overall outlook remains positive as innovations in anticoagulant therapy and precision medicine continue to pave the way for more efficient and safer treatment pathways.
The market is segmented by Drugs, Route of Administration, and End Users and region. By Drugs, the market is divided into Heparin, Warfarin, and Direct Thrombin Inhibitor. In terms of Route of Administration, the market is classified into Oral and Injectable. Based on End Users, the market is segmented into Hospitals and Speciality Centers. Regionally, the market is classified into North America, Latin America, Western Europe, Eastern Europe, Balkan & Baltic Countries, Russia & Belarus, Central Asia, East Asia, South Asia & Pacific, and the Middle East & Africa.
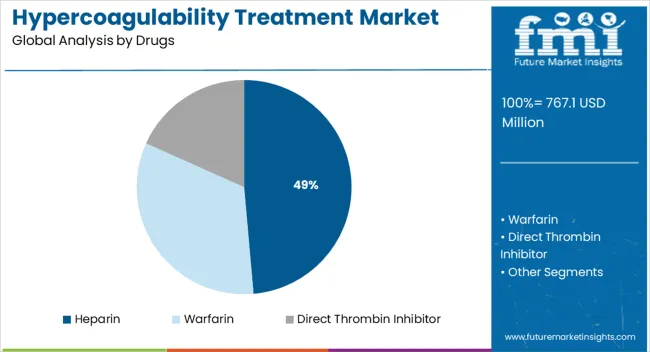
The heparin segment is projected to contribute 48.60% of total market revenue by 2025 within the drug category, establishing it as the leading segment. Its dominance is attributed to its proven efficacy in preventing and treating blood clots, rapid onset of action, and widespread availability in both generic and branded forms.
Hospitals and clinics continue to rely on heparin as a first line treatment due to its established clinical outcomes and cost effectiveness. The segment’s prominence is further supported by ongoing demand for injectable anticoagulants in acute care settings and surgical procedures.
The ability of heparin to address a broad spectrum of thrombotic conditions has reinforced its leadership within the drug category.
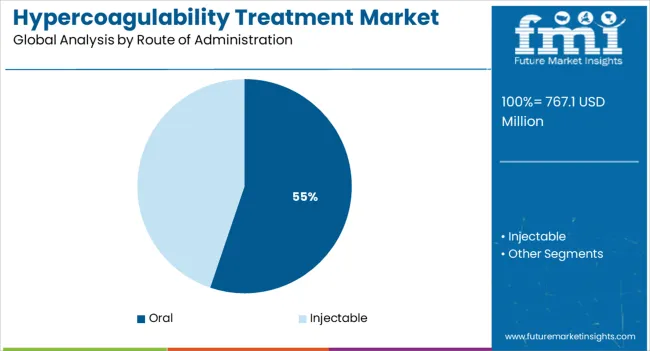
The oral route of administration segment is expected to hold 55.20% of total revenue by 2025, making it the most dominant mode of treatment delivery. This growth is being driven by patient preference for non invasive therapies, improved adherence rates, and convenience of self administration.
Oral anticoagulants have gained significant traction due to their ease of dosing, reduced need for hospitalization, and compatibility with long term management of hypercoagulable conditions. Advancements in novel oral anticoagulants have provided safer alternatives with fewer dietary restrictions and limited monitoring requirements.
These factors have collectively positioned oral therapies as the preferred option across a wide range of patient populations.
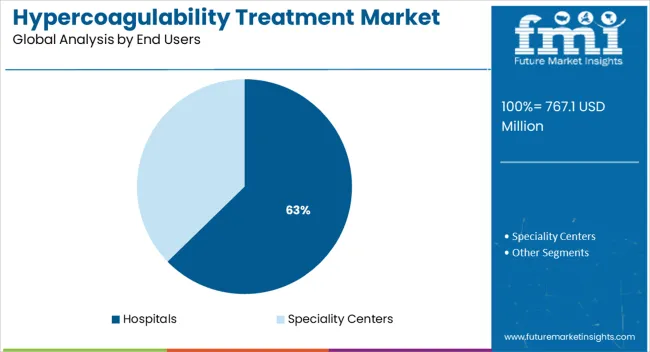
The hospitals segment is projected to account for 62.70% of market revenue by 2025 within the end user category, highlighting its leading role. This dominance is attributed to the high volume of patients treated for acute thrombotic conditions, availability of specialized healthcare professionals, and advanced diagnostic and monitoring facilities.
Hospitals remain the primary centers for managing severe cases, post surgical interventions, and complex anticoagulation therapies. Additionally, the adoption of advanced drug delivery systems and integration of multidisciplinary care teams have strengthened the role of hospitals in hypercoagulability treatment.
As critical care and surgical procedures continue to rise globally, hospitals will remain the cornerstone of this market segment.
According to market research and competitive intelligence provider, Future Market Insights- the market for Hypercoagulability Treatment reflected a value of 4% during the historical period, 2020 to 2025.
The market for hypercoagulability treatment is gaining prominence as it can increase the risk of dangerous blood clots forming in veins and arteries, leading to serious health problems such as deep vein thrombosis, pulmonary embolism, and stroke. Furthermore, the growing incidence of conditions that increase the risk of hypercoagulability, such as cancer and heart disease, is expected to drive demand for these treatments.
In its new study, Future Market Insights (FMI) offers insights about key factors driving demand for Hypercoagulability Treatment. In the years to come, increasing focus by government organizations and private agencies like WHO and pharmaceutical companies to create awareness of Hypercoagulability Treatments is fuelling the market growth. Thus, the market for Hypercoagulability Treatment is expected to register a CAGR of 7% in the forecast period 2025 to 2035.
Growing awareness amongst the population for the treatment of hypercoagulability treatment to push the market growth
The global market for Hypercoagulability Treatment is primarily driven by the increasing prevalence of the disease, the development of new and effective treatment options, advancements in treatment technologies and development of new diagnostic technologies and the availability of more effective treatments. In addition, increased awareness of Hypercoagulability (HE), has led to a higher healthcare expenditure, globally contributing to the growth of the market.
Furthermore, the aging population is another factor contributing to the growth of the hypercoagulability treatment market. As people get older, their risk of developing conditions that increase the risk of hypercoagulability increases, which is expected to drive demand for these treatments.
Furthermore, the prevalence of Hypercoagulability Treatment (HE) is high in low and middle-income countries, offering a significant market opportunity for companies to expand their product offerings. The prevalence of Hypercoagulability Treatment (HE) has increased in recent years, driven by a combination of demographic, technological, and awareness factors.
In September 2025, the nanoparticle therapy was developed by researchers at University Hospitals and Case Western Reserve University targets overactive neutrophils, a type of white blood cell, to prevent blood clots. The therapy shows promise in reducing clotting risk without increasing bleeding risk.
Historically, arterial and venous thrombosis have been treated separately with antiplatelet agents and anticoagulants, but recent studies suggest commonalities between the two events that can be leveraged for novel therapeutic targets. The new study uses animal models to show that overactive neutrophils play a role in both arterial and venous thrombosis and increase the production of key factors used in clot formation. These findings may lead to safer ways to treat patients impacted by blood clots.
Expensive Cost of Treatment to restrict Market Growth
The market is projected to get significantly affected by the challenging factors such as limited availability and high cost of advanced Hypercoagulability Treatment options. Expensive treatments and related costs such as hospitalization, intensive care, or specialized diagnostic tests, is expected to hinder the market growth.
Furthermore, poor healthcare infrastructure, especially in developing countries, can limit access to Hypercoagulability Treatment and the availability of diagnostic and therapeutic options.
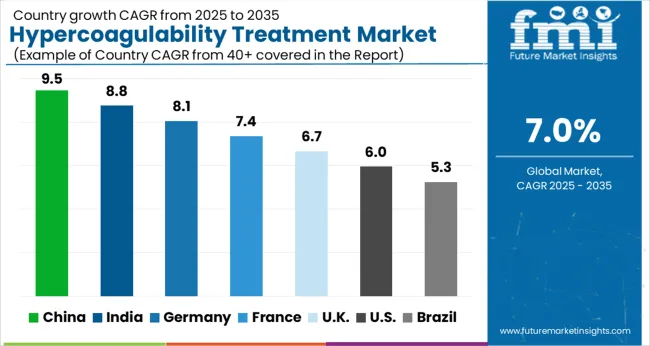
Improvement in healthcare spending propelling growth of Hypercoagulability Treatment in Asia Pacific
The Asia Pacific is expected to exhibit the significant growth rate of all regions over the forecast period, with a share of 20% during the forecast period.
The growth is owed to increased awareness, significant increases in healthcare spending, and a rising frequency of the Hypercoagulability Treatment Market in the region. Asia Pacific is an emerging market due to the increase in point of care approach to health & care. Increasing number of hospitals in India and China makes a promising market for the market worldwide.
Increasing Prevalence of Skin Conditions Shaping Landscape for Hypercoagulability Treatment in North America
North America is anticipated to acquire a market share of about 40% in the forecast period. This growth is attributable to the rising prevalence of the condition in the region.
The United States of America holds the highest share in the North American market, followed by Canada. Presence of a large number of pharmaceutical companies, which are investing heavily in the development of new, targeted treatments for hypercoagulability, high level of healthcare expenditure and a growing aging population are some of the factors responsible for the growth of the market in the region.
Hospitals to take the lead and drive market growth
According to the FMI analysis, Hospital pharmacy accounts for the largest market share. The requirement for several hospital stays and visits during the Hypercoagulability Treatment treatment facilitates the growth of this segment. Majority of the serious venous diseases involving blood clotting are treated in hospitals, and with the availability of trained medical personnel, it is simpler to control an individual's health more correctly.
Key startups in the Hypercoagulability Treatment market include-
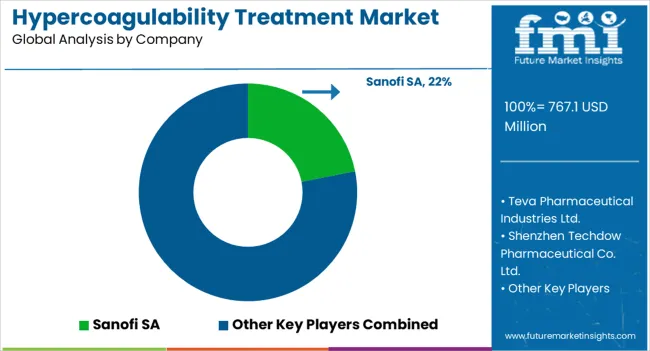
The hypercoagulability treatment market is expanding as rising incidences of thrombosis, cardiovascular disorders, and genetic coagulation abnormalities drive demand for advanced anticoagulant therapies and diagnostic innovations. Sanofi S.A. and Teva Pharmaceutical Industries Ltd. are at the forefront, offering a comprehensive range of heparin-based and direct oral anticoagulant (DOAC) therapies that address both acute and chronic hypercoagulable conditions. Their research efforts focus on enhancing efficacy, minimizing bleeding risks, and improving patient adherence through novel formulations.
Novartis AG and Pfizer Inc. are strengthening their portfolios with next-generation anticoagulants and biologics aimed at modulating coagulation pathways and reducing thrombotic complications in high-risk populations. Shenzhen Techdow Pharmaceutical Co. Ltd. contributes significantly as a global supplier of low molecular weight heparins, expanding accessibility across emerging markets.
Medical device leaders such as Teleflex Inc., Boston Scientific Corporation, AngioDynamics Inc., and Stryker Corporation complement the pharmaceutical landscape through catheter-based delivery systems and thrombectomy devices that enhance clinical precision and patient outcomes in acute care settings. F. Hoffmann-La Roche Ltd. supports the market through advanced diagnostic assays for coagulation profiling and patient monitoring. Overall, competition centers on integrating drug-device therapies and advancing personalized anticoagulation strategies to mitigate clotting risks effectively.
| Report Attribute | Details |
|---|---|
| Market Value in 2025 | USD 767.1 million |
| Market Value in 2035 | USD 1509.0 million |
| Growth Rate | CAGR of 7% from 2025 to 2035 |
| Base Year for Estimation | 2025 |
| Historical Data | 2020 to 2025 |
| Forecast Period | 2025 to 2035 |
| Quantitative Units | Revenue in USD Million and CAGR from 2025 to 2035 |
| Report Coverage | Revenue Forecast, Volume Forecast, Company Ranking, Competitive Landscape, Growth Factors, Trends, and Pricing Analysis |
| Segments Covered | Drugs, Route of Administration, End Users, Region |
| Regions Covered | North America; Latin America; Western Europe; Eastern Europe; Asia Pacific; Middle East & Africa |
| Key Countries Profiled | USA, Canada, Brazil, Mexico, BENELUX, France, Germany, Italy, Nordics, Spain, UK, Poland, Russia, India, Malaysia, Singapore, Thailand, Australia, New Zealand, GCC Countries, South Africa, Israel |
| Key Companies Profiled |
Sanofi S.A., Teva Pharmaceutical Industries Ltd., Shenzhen Techdow Pharmaceutical Co. Ltd., Novartis AG, Teleflex Inc., Boston Scientific Corporation, AngioDynamics Inc., Stryker Corporation, F. Hoffmann-La Roche Ltd., Pfizer Inc. |
| Customization | Available Upon Request |
The global hypercoagulability treatment market is estimated to be valued at USD 767.1 million in 2025.
The market size for the hypercoagulability treatment market is projected to reach USD 1,509.0 million by 2035.
The hypercoagulability treatment market is expected to grow at a 7.0% CAGR between 2025 and 2035.
The key product types in hypercoagulability treatment market are heparin, warfarin and direct thrombin inhibitor.
In terms of route of administration, oral segment to command 55.2% share in the hypercoagulability treatment market in 2025.


Our Research Products

The "Full Research Suite" delivers actionable market intel, deep dives on markets or technologies, so clients act faster, cut risk, and unlock growth.

The Leaderboard benchmarks and ranks top vendors, classifying them as Established Leaders, Leading Challengers, or Disruptors & Challengers.

Locates where complements amplify value and substitutes erode it, forecasting net impact by horizon

We deliver granular, decision-grade intel: market sizing, 5-year forecasts, pricing, adoption, usage, revenue, and operational KPIs—plus competitor tracking, regulation, and value chains—across 60 countries broadly.

Spot the shifts before they hit your P&L. We track inflection points, adoption curves, pricing moves, and ecosystem plays to show where demand is heading, why it is changing, and what to do next across high-growth markets and disruptive tech

Real-time reads of user behavior. We track shifting priorities, perceptions of today’s and next-gen services, and provider experience, then pace how fast tech moves from trial to adoption, blending buyer, consumer, and channel inputs with social signals (#WhySwitch, #UX).

Partner with our analyst team to build a custom report designed around your business priorities. From analysing market trends to assessing competitors or crafting bespoke datasets, we tailor insights to your needs.
Supplier Intelligence
Discovery & Profiling
Capacity & Footprint
Performance & Risk
Compliance & Governance
Commercial Readiness
Who Supplies Whom
Scorecards & Shortlists
Playbooks & Docs
Category Intelligence
Definition & Scope
Demand & Use Cases
Cost Drivers
Market Structure
Supply Chain Map
Trade & Policy
Operating Norms
Deliverables
Buyer Intelligence
Account Basics
Spend & Scope
Procurement Model
Vendor Requirements
Terms & Policies
Entry Strategy
Pain Points & Triggers
Outputs
Pricing Analysis
Benchmarks
Trends
Should-Cost
Indexation
Landed Cost
Commercial Terms
Deliverables
Brand Analysis
Positioning & Value Prop
Share & Presence
Customer Evidence
Go-to-Market
Digital & Reputation
Compliance & Trust
KPIs & Gaps
Outputs
Full Research Suite comprises of:
Market outlook & trends analysis
Interviews & case studies
Strategic recommendations
Vendor profiles & capabilities analysis
5-year forecasts
8 regions and 60+ country-level data splits
Market segment data splits
12 months of continuous data updates
DELIVERED AS:
PDF EXCEL ONLINE
Treatment-Resistant Hypertension Management Market Size and Share Forecast Outlook 2025 to 2035
Treatment-Resistant Depression Treatment Market Size and Share Forecast Outlook 2025 to 2035
Treatment Pumps Market Insights Growth & Demand Forecast 2025 to 2035
Pretreatment Coatings Market Size and Share Forecast Outlook 2025 to 2035
Air Treatment Ozone Generator Market Size and Share Forecast Outlook 2025 to 2035
CNS Treatment and Therapy Market Insights - Trends & Growth Forecast 2025 to 2035
Seed Treatment Materials Market Size and Share Forecast Outlook 2025 to 2035
Acne Treatment Solutions Market Size and Share Forecast Outlook 2025 to 2035
Scar Treatment Market Overview - Growth & Demand Forecast 2025 to 2035
Soil Treatment Chemicals Market
Water Treatment System Market Size and Share Forecast Outlook 2025 to 2035
Water Treatment Chemical Market Size and Share Forecast Outlook 2025 to 2035
Algae Treatment Chemical Market Forecast and Outlook 2025 to 2035
Water Treatment Market Size and Share Forecast Outlook 2025 to 2035
Water Treatment Ozone Generator Market Size and Share Forecast Outlook 2025 to 2035
Water Treatment Equipment Market Size and Share Forecast Outlook 2025 to 2035
Burns Treatment Market Overview – Growth, Demand & Forecast 2025 to 2035
CRBSI Treatment Market Insights - Growth, Trends & Forecast 2025 to 2035
Water Treatment Polymers Market Growth & Demand 2025 to 2035
Asthma Treatment Market Forecast and Outlook 2025 to 2035

Thank you!
You will receive an email from our Business Development Manager. Please be sure to check your SPAM/JUNK folder too.
Chat With
MaRIA