Imitation Whipped Cream Market Outlook from 2025 to 2035

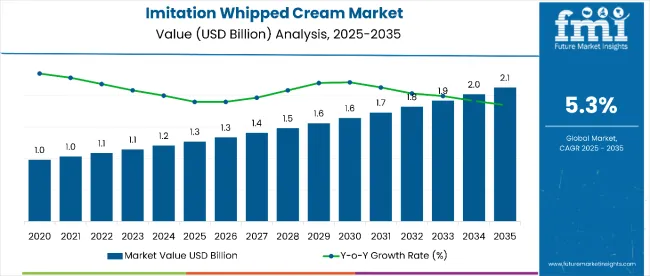
The demand for Imitation Whipped Cream market is expected to be valued at USD 1.27 Billion in 2025, forecasted at a CAGR of 5.6%to have an estimated value of USD 2.19 Billion from 2025 to 2035. From 2020 to 2025 a CAGR of 5.3% was registered for the market.

Healthy dessert options are flooding the dairy industry. Consequently, in order to satisfy consumer preferences manufacturers, launch creative substitutes like imitation whipped cream. Customers with long-term conditions like diabetes are the primary target market for companies in the imitation whipped cream industry.

People seek out substitutes like artificial whipped creams because overindulging in fatty foods like cakes with added sugar is one of the primary causes of diabetes. In the upcoming decade there will be a huge demand for imitation whipped cream due to its low-fat content affordability and use of a liquid vegetable oil-water emulsion for consistent foam creation.

The demand for vegan foods due to their health benefits and growing concerns about animal welfare is driving the demand for non-dairy whipped creams in the food industry. Over the next ten years the number of lactose intolerant consumers will rise making them one of the main target markets for imitation whipped cream which is also frequently used in lactose-free products.

Attributes Description
Estimated Global Industry Size (2025E) USD 1.27 Billion
Projected Global Industry Value (2035F) USD 2.19 Billion
Value-based CAGR (2025 to 2035) 5.6%

Making non-dairy or imitation whipped creams presents a number of difficulties because their lower fat content makes it harder for them to form foam. The challenges encountered in creating imitation whipped cream that foams perfectly impede the markets expansion.

Category-wise Insights

Conventional Dominates Imitation Whipped Cream Market

Segment Value Share (2025)
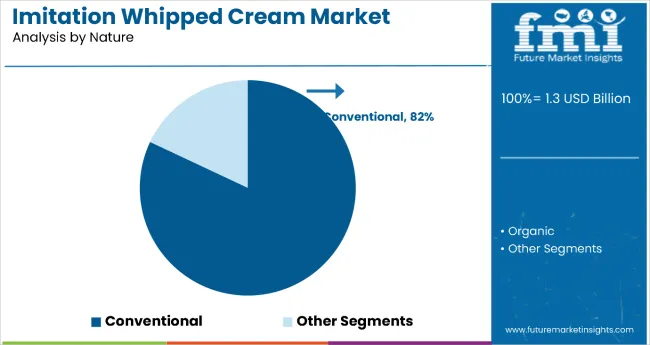
Conventional (Nature) 82%

Conventional artificial whipped cream has a substantial market share of 82% in 2025 indicating the high demand for it. As conventional imitation whipped cream has a longer shelf life than homemade cream there is a growing demand for them.

Synthetic whipped cream manufacturers create a market for imitation whipped cream by adding well-known flavors and textures in a traditional manner. Traditional imitation whipped cream has many uses and recipes that appeal to consumers in the global food and beverage industry.

Powder Rules the Imitation Whipped Cream Market

Segment Value Share (2025)
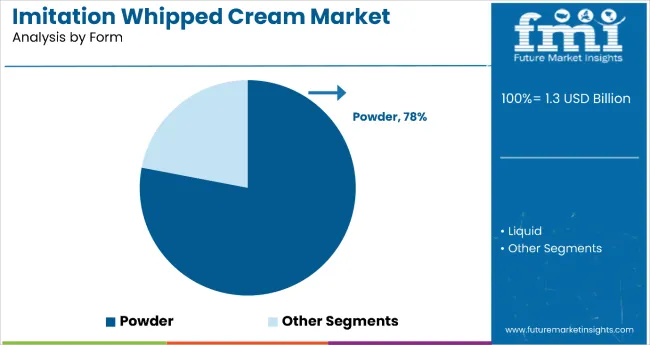
Powder (Form) 78%

By form, powder segment dominates the market. It has a market share of 78%. It is expected to grow even further during the forecasted period.

Key Industry Highlights

Demand for Vegan Diet is Driving the Market Growth

By utilizing plant-based ingredients like almond coconut and soymilk the imitation whipped cream market is well-known for creating vegan and dairy-free solutions. Compared to their conventional counterparts’ plant-based food substitutes have a smoother softer texture and can be flavored with natural ingredients like fruit and spices. By incorporating plant-based food substitutes confectionery manufacturers are able to meet consumer demand for imitation whipped cream.

Availability of Raw Materials Driving the Market Growth

The ease of access to a variety of raw materials is allowing manufacturers to create new flavors for imitation whipped creams. As imitation whipped cream incorporates stabilizers milk proteins and vegetable oils to extend its shelf life its demand is marginally higher than that of traditional whipped cream.

Imitation whipped cream is easier to make and more affordable which increases demand from both manufacturers and consumers. As people prefer easy and useful substitutes for traditional whipped cream there is a greater demand for imitation whipped cream.

2020 to 2024 Imitation Whipped Cream Sales Analysis Compared to Demand Forecasts for 2025 to 2035

During the period 2020 to 2024, the sales grew at a CAGR of 5.3%, and it is predicted to continue to grow at a CAGR of 5.6% during the forecast period of 2025 to 2035. High taxes uniform food standards efficient service management obtaining premium ingredients and costly inventory shipping and packaging costs are some of the challenges facing the sales of imitation whipped cream.

Important considerations that will affect the demand for fake whipped cream through 2035. Market participants are expected to present a profitable opportunity by launching innovative food items that include ingredients for cakes cookies and other baked goods as well as artificial whipped toppings.

There are chances to increase demand for vegan whipped cream in order to satisfy legal requirements and consumers who care about the environment. The market for imitation whipped cream is driven by the growing demand from manufacturers of baked goods ice cream RTD drinks and other products. Since these difficult characteristics set the industry up for success in the next ten years market participants will want to be cautious and adaptable during the anticipated period.

Market Concentration

Tier 1 companies comprises industry leaders acquiring a 40% share in the global business market. These leaders are distinguished by their extensive product portfolio and high production capacity. These industry leaders stand out due to their broad geographic reach, in-depth knowledge of manufacturing and reconditioning across various formats and strong customer base. They offer a variety of services and manufacturing with the newest technology while adhering to legal requirements for the best quality.

Tier 2 companies comprises of mid-size players having a presence in some regions and highly influencing the local commerce and has a market share of 30%. These are distinguished by their robust global presence and solid business acumen. These industry participants may not have cutting-edge technology or a broad global reach but they do have good technology and guarantee regulatory compliance.

Tier 3 companies comprises mostly of small-scale businesses serving niche economies and serving at the local presence having a market share of 30%. Due to their notable focus on meeting local needs these businesses are categorized as belonging to the tier 3 share segment, they are minor players with a constrained geographic scope. As an unorganized ecosystem Tier 3 in this context refers to a sector that in contrast to its organized competitors, lacks extensive structure and formalization.

Country wise Insights

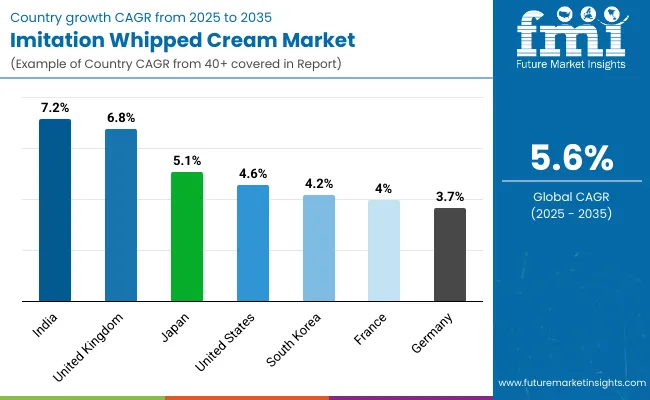
The following table shows the forecasted growth rates of the significant three geographies revenues. USA, Germany and India come under the exhibit of high consumption, recording CAGRs of 4.6%, 3.7% and 7.2%, respectively, through 2035.

Countries CAGR, 2025 to 2035
United States 4.6%
Germany 3.7%
India 7.2%

USA Dominates the North America Imitation Whipped Cream Market

From 2025 to 2035 the USA market for imitation whipped cream is expected to grow at a compound annual growth rate (CAGR) of 4.6%. For the expanded global consumer base, the USA food and beverage market created a demand for imitation whipped cream.

American consumers like whipped cream but most of them prefer imitation whipped cream as the countrys plant-based diet grows. In order to increase consumer health and boost sales companies in the USA non-dairy whipped cream market are creating healthier product substitutes.

India Contributes to the Imitation Whipped Cream Market Growth

Through 2035 the Indian market for imitation whipped cream is anticipated to grow at a CAGR of 7.2%. In the food and beverage industry demand for high-end products like vegan cream is driven by Indian culinary heritage and the focus on food quality and presentation.

In India imitation whipped cream provides a modified form of dairy-based cream to guarantee freshness integrity and customer confidence across the supply chain. By enhancing product quality imitation whipped cream helps customers recognize the superiority of Indian food and drink items which in turn influences their purchase decisions.

Germany Emerges in Imitation Whipped Cream Market

During the forecast period the German market for imitation whipped cream is anticipated to grow at a CAGR of 3.7%. New baked goods with artificial whipped cream are expected to be created by German bakers.

Germanys confectioners combine imitation whipped cream with a range of desserts including cheesecake strudel and more. Because they complement the flavor of German desserts German producers are using non-dairy ingredients like coconut almonds and soymilk items.

Competition Outlook

Manufacturers of imitation whipped cream must employ strategic methods to gain a competitive edge in the highly competitive market. These tactics include making investments in the development of new products entering new markets and combining and growing companies.

Acquisitions allow businesses to expand their product lines acquire new technology and strengthen their positions in the market. Plans for expansion aim to open up new markets increase manufacturing capacity and strengthen distribution networks through partnerships and international expansion.

Success in the market for imitation whipped cream also depends on product innovation. To develop innovative state-of-the-art imitation whipped cream products that improve flavor have a more complex taste and offer customizable options food and beverage companies invest a substantial amount of RandD.

Making their products stand out from those of their competitors while meeting the evolving needs and preferences of their customers is the goal. Market players need to be adaptable and sensitive to changing consumer preferences and market trends in order to succeed in this competitive and fast-paced setting.

Investing in innovation implementing sustainable practices and establishing strong partnerships with suppliers and distributors are expected to be top priorities for businesses. In the global imitation whipped cream market companies that employ these strategies ought to be able to gain a competitive advantage and thrive.

Leading Manufacturers

  • Kraft Heinz Company
  • Nestlé S.A
  • Rich Products Corporation
  • Danone
  • Grupo Chantilly SA de CV
  • Trader Joe's Company
  • IlsaFrigo, Kerry
  • Eurocas Group of Companies
  • Dos Anclas
  • PURATOS
  • Hydrosol GmbH & Co. KG
  • Arla Foods

Report Coverage for Global Imitation Whipped Cream Market

Report Attributes Details
Current Total Market Size (2025) USD 1.27 billion
Projected Market Size (2035) USD 2.19 billion
Overall Market CAGR (2025 to 2035) 5.6%
Base Year for Estimation 2024
Historical Period 2020 to 2024
Projections Period 2025 to 2035
Analysis Paramter Revenue in USD billion/Volume in Metric Tons
By Nature Segments Conventional, Organic
By Form Segments Powder, Liquid
Regions Covered North America, Latin America, Western Europe, Eastern Europe, Balkans & Baltic, Russia & Belarus, Central Asia, East Asia, South Asia & Pacific, Middle East & Africa.
Countries Covered United States, Japan, Germany, India, United Kingdom, France, Italy, Brazil, Canada, South Korea, Australia, Spain, Netherlands, Saudi Arabia, Switzerland
Key Players Kraft Heinz Company, Nestlé S.A, Rich Products Corporation, Danone, Grupo Chantilly SA de CV, Trader Joe's Company, Ilsa Frigo, Kerry, Eurocas Group of Companies, Dos Anclas, PURATOS.
Additional Attributes Technological Innovations, Regulatory Compliance, Sustainability Initiatives, Market Dynamics
Customization and Pricing Available upon request

Key Segments

By Nature:

By nature, methods industry has been categorized into conventional and organic

By Form:

By form, industry has been categorized into powder and liquid

By Region:

The market spans North America, Latin America, Western Europe, Eastern Europe, South Asia & Pacific, East Asia, Central Asia, Balkan and Baltic Countries, Russia and Belarus, and The Middle East & Africa.

Table of Content

  1. Executive Summary
  2. Industry Introduction, including Taxonomy and Market Definition
  3. Market Trends and Success Factors, including Macro-economic Factors, Market Dynamics, and Recent Industry Developments
  4. Global Market Demand Analysis 2020 to 2024 and Forecast 2025 to 2035, including Historical Analysis and Future Projections
  5. Pricing Analysis
  6. Global Market Analysis 2020 to 2024 and Forecast 2025 to 2035
    • Nature
    • Form
  7. Global Market Analysis 2020 to 2024 and Forecast 2025 to 2035 By Nature
    • Conventional
    • Organic
  8. Global Market Analysis 2020 to 2024 and Forecast 2025 to 2035 By Form
    • Powder
    • Liquid
  9. Global Market Analysis 2020 to 2024 and Forecast 2025 to 2035 By Region
    • North America
    • Latin America
    • Western Europe
    • Eastern Europe
    • Balkans & Baltic
    • Russia & Belarus
    • Central Asia
    • East Asia
    • South Asia & Pacific
    • Middle East & Africa
  10. North America Sales Analysis 2020 to 2024 and Forecast 2025 to 2035, by Key Segments and Countries
  11. Latin America Sales Analysis 2020 to 2024 and Forecast 2025 to 2035, by Key Segments and Countries
  12. Western Europe Sales Analysis 2020 to 2024 and Forecast 2025 to 2035, by Key Segments and Countries
  13. Eastern Europe Sales Analysis 2020 to 2024 and Forecast 2025 to 2035, by Key Segments and Countries
  14. Balkans & Baltic Sales Analysis 2020 to 2024 and Forecast 2025 to 2035, by Key Segments and Countries
  15. Russia & Belarus Sales Analysis 2020 to 2024 and Forecast 2025 to 2035, by Key Segments and Countries
  16. Central Asia Sales Analysis 2020 to 2024 and Forecast 2025 to 2035, by Key Segments and Countries
  17. East Asia Sales Analysis 2020 to 2024 and Forecast 2025 to 2035, by Key Segments and Countries
  18. South Asia & Pacific Sales Analysis 2020 to 2024 and Forecast 2025 to 2035, by Key Segments and Countries
  19. Middle East & Africa Sales Analysis 2020 to 2024 and Forecast 2025 to 2035, by Key Segments and Countries
  20. Sales Forecast to 2035 by Nature and Form for 30 Countries
  21. Competitive Assessment, Company Share Analysis by Key Players, and Competition Dashboard
  22. Company Profile
    • Kraft Heinz Company
    • Nestlé S.A
    • Rich Products Corporation
    • Danone
    • Grupo Chantilly SA de CV
    • Trader Joe's Company
    • Ilsa Frigo, Kerry
    • Eurocas Group of Companies
    • Dos Anclas
    • PURATOS

List of Tables

Table 1: Global Market Value (US$ Million) Forecast by Region, 2019 to 2034

Table 2: Global Market Volume (Tons) Forecast by Region, 2019 to 2034

Table 3: Global Market Value (US$ Million) Forecast by Nature, 2019 to 2034

Table 4: Global Market Volume (Tons) Forecast by Nature, 2019 to 2034

Table 5: Global Market Value (US$ Million) Forecast by Form, 2019 to 2034

Table 6: Global Market Volume (Tons) Forecast by Form, 2019 to 2034

Table 7: Global Market Value (US$ Million) Forecast by Product Type, 2019 to 2034

Table 8: Global Market Volume (Tons) Forecast by Product Type, 2019 to 2034

Table 9: Global Market Value (US$ Million) Forecast by End-Use, 2019 to 2034

Table 10: Global Market Volume (Tons) Forecast by End-Use, 2019 to 2034

Table 11: Global Market Value (US$ Million) Forecast by Sales-Channel, 2019 to 2034

Table 12: Global Market Volume (Tons) Forecast by Sales-Channel, 2019 to 2034

Table 13: North America Market Value (US$ Million) Forecast by Country, 2019 to 2034

Table 14: North America Market Volume (Tons) Forecast by Country, 2019 to 2034

Table 15: North America Market Value (US$ Million) Forecast by Nature, 2019 to 2034

Table 16: North America Market Volume (Tons) Forecast by Nature, 2019 to 2034

Table 17: North America Market Value (US$ Million) Forecast by Form, 2019 to 2034

Table 18: North America Market Volume (Tons) Forecast by Form, 2019 to 2034

Table 19: North America Market Value (US$ Million) Forecast by Product Type, 2019 to 2034

Table 20: North America Market Volume (Tons) Forecast by Product Type, 2019 to 2034

Table 21: North America Market Value (US$ Million) Forecast by End-Use, 2019 to 2034

Table 22: North America Market Volume (Tons) Forecast by End-Use, 2019 to 2034

Table 23: North America Market Value (US$ Million) Forecast by Sales-Channel, 2019 to 2034

Table 24: North America Market Volume (Tons) Forecast by Sales-Channel, 2019 to 2034

Table 25: Latin America Market Value (US$ Million) Forecast by Country, 2019 to 2034

Table 26: Latin America Market Volume (Tons) Forecast by Country, 2019 to 2034

Table 27: Latin America Market Value (US$ Million) Forecast by Nature, 2019 to 2034

Table 28: Latin America Market Volume (Tons) Forecast by Nature, 2019 to 2034

Table 29: Latin America Market Value (US$ Million) Forecast by Form, 2019 to 2034

Table 30: Latin America Market Volume (Tons) Forecast by Form, 2019 to 2034

Table 31: Latin America Market Value (US$ Million) Forecast by Product Type, 2019 to 2034

Table 32: Latin America Market Volume (Tons) Forecast by Product Type, 2019 to 2034

Table 33: Latin America Market Value (US$ Million) Forecast by End-Use, 2019 to 2034

Table 34: Latin America Market Volume (Tons) Forecast by End-Use, 2019 to 2034

Table 35: Latin America Market Value (US$ Million) Forecast by Sales-Channel, 2019 to 2034

Table 36: Latin America Market Volume (Tons) Forecast by Sales-Channel, 2019 to 2034

Table 37: Western Europe Market Value (US$ Million) Forecast by Country, 2019 to 2034

Table 38: Western Europe Market Volume (Tons) Forecast by Country, 2019 to 2034

Table 39: Western Europe Market Value (US$ Million) Forecast by Nature, 2019 to 2034

Table 40: Western Europe Market Volume (Tons) Forecast by Nature, 2019 to 2034

Table 41: Western Europe Market Value (US$ Million) Forecast by Form, 2019 to 2034

Table 42: Western Europe Market Volume (Tons) Forecast by Form, 2019 to 2034

Table 43: Western Europe Market Value (US$ Million) Forecast by Product Type, 2019 to 2034

Table 44: Western Europe Market Volume (Tons) Forecast by Product Type, 2019 to 2034

Table 45: Western Europe Market Value (US$ Million) Forecast by End-Use, 2019 to 2034

Table 46: Western Europe Market Volume (Tons) Forecast by End-Use, 2019 to 2034

Table 47: Western Europe Market Value (US$ Million) Forecast by Sales-Channel, 2019 to 2034

Table 48: Western Europe Market Volume (Tons) Forecast by Sales-Channel, 2019 to 2034

Table 49: Eastern Europe Market Value (US$ Million) Forecast by Country, 2019 to 2034

Table 50: Eastern Europe Market Volume (Tons) Forecast by Country, 2019 to 2034

Table 51: Eastern Europe Market Value (US$ Million) Forecast by Nature, 2019 to 2034

Table 52: Eastern Europe Market Volume (Tons) Forecast by Nature, 2019 to 2034

Table 53: Eastern Europe Market Value (US$ Million) Forecast by Form, 2019 to 2034

Table 54: Eastern Europe Market Volume (Tons) Forecast by Form, 2019 to 2034

Table 55: Eastern Europe Market Value (US$ Million) Forecast by Product Type, 2019 to 2034

Table 56: Eastern Europe Market Volume (Tons) Forecast by Product Type, 2019 to 2034

Table 57: Eastern Europe Market Value (US$ Million) Forecast by End-Use, 2019 to 2034

Table 58: Eastern Europe Market Volume (Tons) Forecast by End-Use, 2019 to 2034

Table 59: Eastern Europe Market Value (US$ Million) Forecast by Sales-Channel, 2019 to 2034

Table 60: Eastern Europe Market Volume (Tons) Forecast by Sales-Channel, 2019 to 2034

Table 61: South Asia and Pacific Market Value (US$ Million) Forecast by Country, 2019 to 2034

Table 62: South Asia and Pacific Market Volume (Tons) Forecast by Country, 2019 to 2034

Table 63: South Asia and Pacific Market Value (US$ Million) Forecast by Nature, 2019 to 2034

Table 64: South Asia and Pacific Market Volume (Tons) Forecast by Nature, 2019 to 2034

Table 65: South Asia and Pacific Market Value (US$ Million) Forecast by Form, 2019 to 2034

Table 66: South Asia and Pacific Market Volume (Tons) Forecast by Form, 2019 to 2034

Table 67: South Asia and Pacific Market Value (US$ Million) Forecast by Product Type, 2019 to 2034

Table 68: South Asia and Pacific Market Volume (Tons) Forecast by Product Type, 2019 to 2034

Table 69: South Asia and Pacific Market Value (US$ Million) Forecast by End-Use, 2019 to 2034

Table 70: South Asia and Pacific Market Volume (Tons) Forecast by End-Use, 2019 to 2034

Table 71: South Asia and Pacific Market Value (US$ Million) Forecast by Sales-Channel, 2019 to 2034

Table 72: South Asia and Pacific Market Volume (Tons) Forecast by Sales-Channel, 2019 to 2034

Table 73: East Asia Market Value (US$ Million) Forecast by Country, 2019 to 2034

Table 74: East Asia Market Volume (Tons) Forecast by Country, 2019 to 2034

Table 75: East Asia Market Value (US$ Million) Forecast by Nature, 2019 to 2034

Table 76: East Asia Market Volume (Tons) Forecast by Nature, 2019 to 2034

Table 77: East Asia Market Value (US$ Million) Forecast by Form, 2019 to 2034

Table 78: East Asia Market Volume (Tons) Forecast by Form, 2019 to 2034

Table 79: East Asia Market Value (US$ Million) Forecast by Product Type, 2019 to 2034

Table 80: East Asia Market Volume (Tons) Forecast by Product Type, 2019 to 2034

Table 81: East Asia Market Value (US$ Million) Forecast by End-Use, 2019 to 2034

Table 82: East Asia Market Volume (Tons) Forecast by End-Use, 2019 to 2034

Table 83: East Asia Market Value (US$ Million) Forecast by Sales-Channel, 2019 to 2034

Table 84: East Asia Market Volume (Tons) Forecast by Sales-Channel, 2019 to 2034

Table 85: Middle East and Africa Market Value (US$ Million) Forecast by Country, 2019 to 2034

Table 86: Middle East and Africa Market Volume (Tons) Forecast by Country, 2019 to 2034

Table 87: Middle East and Africa Market Value (US$ Million) Forecast by Nature, 2019 to 2034

Table 88: Middle East and Africa Market Volume (Tons) Forecast by Nature, 2019 to 2034

Table 89: Middle East and Africa Market Value (US$ Million) Forecast by Form, 2019 to 2034

Table 90: Middle East and Africa Market Volume (Tons) Forecast by Form, 2019 to 2034

Table 91: Middle East and Africa Market Value (US$ Million) Forecast by Product Type, 2019 to 2034

Table 92: Middle East and Africa Market Volume (Tons) Forecast by Product Type, 2019 to 2034

Table 93: Middle East and Africa Market Value (US$ Million) Forecast by End-Use, 2019 to 2034

Table 94: Middle East and Africa Market Volume (Tons) Forecast by End-Use, 2019 to 2034

Table 95: Middle East and Africa Market Value (US$ Million) Forecast by Sales-Channel, 2019 to 2034

Table 96: Middle East and Africa Market Volume (Tons) Forecast by Sales-Channel, 2019 to 2034

List of Figures

Figure 1: Global Market Value (US$ Million) by Nature, 2024 to 2034

Figure 2: Global Market Value (US$ Million) by Form, 2024 to 2034

Figure 3: Global Market Value (US$ Million) by Product Type, 2024 to 2034

Figure 4: Global Market Value (US$ Million) by End-Use, 2024 to 2034

Figure 5: Global Market Value (US$ Million) by Sales-Channel, 2024 to 2034

Figure 6: Global Market Value (US$ Million) by Region, 2024 to 2034

Figure 7: Global Market Value (US$ Million) Analysis by Region, 2019 to 2034

Figure 8: Global Market Volume (Tons) Analysis by Region, 2019 to 2034

Figure 9: Global Market Value Share (%) and BPS Analysis by Region, 2024 to 2034

Figure 10: Global Market Y-o-Y Growth (%) Projections by Region, 2024 to 2034

Figure 11: Global Market Value (US$ Million) Analysis by Nature, 2019 to 2034

Figure 12: Global Market Volume (Tons) Analysis by Nature, 2019 to 2034

Figure 13: Global Market Value Share (%) and BPS Analysis by Nature, 2024 to 2034

Figure 14: Global Market Y-o-Y Growth (%) Projections by Nature, 2024 to 2034

Figure 15: Global Market Value (US$ Million) Analysis by Form, 2019 to 2034

Figure 16: Global Market Volume (Tons) Analysis by Form, 2019 to 2034

Figure 17: Global Market Value Share (%) and BPS Analysis by Form, 2024 to 2034

Figure 18: Global Market Y-o-Y Growth (%) Projections by Form, 2024 to 2034

Figure 19: Global Market Value (US$ Million) Analysis by Product Type, 2019 to 2034

Figure 20: Global Market Volume (Tons) Analysis by Product Type, 2019 to 2034

Figure 21: Global Market Value Share (%) and BPS Analysis by Product Type, 2024 to 2034

Figure 22: Global Market Y-o-Y Growth (%) Projections by Product Type, 2024 to 2034

Figure 23: Global Market Value (US$ Million) Analysis by End-Use, 2019 to 2034

Figure 24: Global Market Volume (Tons) Analysis by End-Use, 2019 to 2034

Figure 25: Global Market Value Share (%) and BPS Analysis by End-Use, 2024 to 2034

Figure 26: Global Market Y-o-Y Growth (%) Projections by End-Use, 2024 to 2034

Figure 27: Global Market Value (US$ Million) Analysis by Sales-Channel, 2019 to 2034

Figure 28: Global Market Volume (Tons) Analysis by Sales-Channel, 2019 to 2034

Figure 29: Global Market Value Share (%) and BPS Analysis by Sales-Channel, 2024 to 2034

Figure 30: Global Market Y-o-Y Growth (%) Projections by Sales-Channel, 2024 to 2034

Figure 31: Global Market Attractiveness by Nature, 2024 to 2034

Figure 32: Global Market Attractiveness by Form, 2024 to 2034

Figure 33: Global Market Attractiveness by Product Type, 2024 to 2034

Figure 34: Global Market Attractiveness by End-Use, 2024 to 2034

Figure 35: Global Market Attractiveness by Sales-Channel, 2024 to 2034

Figure 36: Global Market Attractiveness by Region, 2024 to 2034

Figure 37: North America Market Value (US$ Million) by Nature, 2024 to 2034

Figure 38: North America Market Value (US$ Million) by Form, 2024 to 2034

Figure 39: North America Market Value (US$ Million) by Product Type, 2024 to 2034

Figure 40: North America Market Value (US$ Million) by End-Use, 2024 to 2034

Figure 41: North America Market Value (US$ Million) by Sales-Channel, 2024 to 2034

Figure 42: North America Market Value (US$ Million) by Country, 2024 to 2034

Figure 43: North America Market Value (US$ Million) Analysis by Country, 2019 to 2034

Figure 44: North America Market Volume (Tons) Analysis by Country, 2019 to 2034

Figure 45: North America Market Value Share (%) and BPS Analysis by Country, 2024 to 2034

Figure 46: North America Market Y-o-Y Growth (%) Projections by Country, 2024 to 2034

Figure 47: North America Market Value (US$ Million) Analysis by Nature, 2019 to 2034

Figure 48: North America Market Volume (Tons) Analysis by Nature, 2019 to 2034

Figure 49: North America Market Value Share (%) and BPS Analysis by Nature, 2024 to 2034

Figure 50: North America Market Y-o-Y Growth (%) Projections by Nature, 2024 to 2034

Figure 51: North America Market Value (US$ Million) Analysis by Form, 2019 to 2034

Figure 52: North America Market Volume (Tons) Analysis by Form, 2019 to 2034

Figure 53: North America Market Value Share (%) and BPS Analysis by Form, 2024 to 2034

Figure 54: North America Market Y-o-Y Growth (%) Projections by Form, 2024 to 2034

Figure 55: North America Market Value (US$ Million) Analysis by Product Type, 2019 to 2034

Figure 56: North America Market Volume (Tons) Analysis by Product Type, 2019 to 2034

Figure 57: North America Market Value Share (%) and BPS Analysis by Product Type, 2024 to 2034

Figure 58: North America Market Y-o-Y Growth (%) Projections by Product Type, 2024 to 2034

Figure 59: North America Market Value (US$ Million) Analysis by End-Use, 2019 to 2034

Figure 60: North America Market Volume (Tons) Analysis by End-Use, 2019 to 2034

Figure 61: North America Market Value Share (%) and BPS Analysis by End-Use, 2024 to 2034

Figure 62: North America Market Y-o-Y Growth (%) Projections by End-Use, 2024 to 2034

Figure 63: North America Market Value (US$ Million) Analysis by Sales-Channel, 2019 to 2034

Figure 64: North America Market Volume (Tons) Analysis by Sales-Channel, 2019 to 2034

Figure 65: North America Market Value Share (%) and BPS Analysis by Sales-Channel, 2024 to 2034

Figure 66: North America Market Y-o-Y Growth (%) Projections by Sales-Channel, 2024 to 2034

Figure 67: North America Market Attractiveness by Nature, 2024 to 2034

Figure 68: North America Market Attractiveness by Form, 2024 to 2034

Figure 69: North America Market Attractiveness by Product Type, 2024 to 2034

Figure 70: North America Market Attractiveness by End-Use, 2024 to 2034

Figure 71: North America Market Attractiveness by Sales-Channel, 2024 to 2034

Figure 72: North America Market Attractiveness by Country, 2024 to 2034

Figure 73: Latin America Market Value (US$ Million) by Nature, 2024 to 2034

Figure 74: Latin America Market Value (US$ Million) by Form, 2024 to 2034

Figure 75: Latin America Market Value (US$ Million) by Product Type, 2024 to 2034

Figure 76: Latin America Market Value (US$ Million) by End-Use, 2024 to 2034

Figure 77: Latin America Market Value (US$ Million) by Sales-Channel, 2024 to 2034

Figure 78: Latin America Market Value (US$ Million) by Country, 2024 to 2034

Figure 79: Latin America Market Value (US$ Million) Analysis by Country, 2019 to 2034

Figure 80: Latin America Market Volume (Tons) Analysis by Country, 2019 to 2034

Figure 81: Latin America Market Value Share (%) and BPS Analysis by Country, 2024 to 2034

Figure 82: Latin America Market Y-o-Y Growth (%) Projections by Country, 2024 to 2034

Figure 83: Latin America Market Value (US$ Million) Analysis by Nature, 2019 to 2034

Figure 84: Latin America Market Volume (Tons) Analysis by Nature, 2019 to 2034

Figure 85: Latin America Market Value Share (%) and BPS Analysis by Nature, 2024 to 2034

Figure 86: Latin America Market Y-o-Y Growth (%) Projections by Nature, 2024 to 2034

Figure 87: Latin America Market Value (US$ Million) Analysis by Form, 2019 to 2034

Figure 88: Latin America Market Volume (Tons) Analysis by Form, 2019 to 2034

Figure 89: Latin America Market Value Share (%) and BPS Analysis by Form, 2024 to 2034

Figure 90: Latin America Market Y-o-Y Growth (%) Projections by Form, 2024 to 2034

Figure 91: Latin America Market Value (US$ Million) Analysis by Product Type, 2019 to 2034

Figure 92: Latin America Market Volume (Tons) Analysis by Product Type, 2019 to 2034

Figure 93: Latin America Market Value Share (%) and BPS Analysis by Product Type, 2024 to 2034

Figure 94: Latin America Market Y-o-Y Growth (%) Projections by Product Type, 2024 to 2034

Figure 95: Latin America Market Value (US$ Million) Analysis by End-Use, 2019 to 2034

Figure 96: Latin America Market Volume (Tons) Analysis by End-Use, 2019 to 2034

Figure 97: Latin America Market Value Share (%) and BPS Analysis by End-Use, 2024 to 2034

Figure 98: Latin America Market Y-o-Y Growth (%) Projections by End-Use, 2024 to 2034

Figure 99: Latin America Market Value (US$ Million) Analysis by Sales-Channel, 2019 to 2034

Figure 100: Latin America Market Volume (Tons) Analysis by Sales-Channel, 2019 to 2034

Figure 101: Latin America Market Value Share (%) and BPS Analysis by Sales-Channel, 2024 to 2034

Figure 102: Latin America Market Y-o-Y Growth (%) Projections by Sales-Channel, 2024 to 2034

Figure 103: Latin America Market Attractiveness by Nature, 2024 to 2034

Figure 104: Latin America Market Attractiveness by Form, 2024 to 2034

Figure 105: Latin America Market Attractiveness by Product Type, 2024 to 2034

Figure 106: Latin America Market Attractiveness by End-Use, 2024 to 2034

Figure 107: Latin America Market Attractiveness by Sales-Channel, 2024 to 2034

Figure 108: Latin America Market Attractiveness by Country, 2024 to 2034

Figure 109: Western Europe Market Value (US$ Million) by Nature, 2024 to 2034

Figure 110: Western Europe Market Value (US$ Million) by Form, 2024 to 2034

Figure 111: Western Europe Market Value (US$ Million) by Product Type, 2024 to 2034

Figure 112: Western Europe Market Value (US$ Million) by End-Use, 2024 to 2034

Figure 113: Western Europe Market Value (US$ Million) by Sales-Channel, 2024 to 2034

Figure 114: Western Europe Market Value (US$ Million) by Country, 2024 to 2034

Figure 115: Western Europe Market Value (US$ Million) Analysis by Country, 2019 to 2034

Figure 116: Western Europe Market Volume (Tons) Analysis by Country, 2019 to 2034

Figure 117: Western Europe Market Value Share (%) and BPS Analysis by Country, 2024 to 2034

Figure 118: Western Europe Market Y-o-Y Growth (%) Projections by Country, 2024 to 2034

Figure 119: Western Europe Market Value (US$ Million) Analysis by Nature, 2019 to 2034

Figure 120: Western Europe Market Volume (Tons) Analysis by Nature, 2019 to 2034

Figure 121: Western Europe Market Value Share (%) and BPS Analysis by Nature, 2024 to 2034

Figure 122: Western Europe Market Y-o-Y Growth (%) Projections by Nature, 2024 to 2034

Figure 123: Western Europe Market Value (US$ Million) Analysis by Form, 2019 to 2034

Figure 124: Western Europe Market Volume (Tons) Analysis by Form, 2019 to 2034

Figure 125: Western Europe Market Value Share (%) and BPS Analysis by Form, 2024 to 2034

Figure 126: Western Europe Market Y-o-Y Growth (%) Projections by Form, 2024 to 2034

Figure 127: Western Europe Market Value (US$ Million) Analysis by Product Type, 2019 to 2034

Figure 128: Western Europe Market Volume (Tons) Analysis by Product Type, 2019 to 2034

Figure 129: Western Europe Market Value Share (%) and BPS Analysis by Product Type, 2024 to 2034

Figure 130: Western Europe Market Y-o-Y Growth (%) Projections by Product Type, 2024 to 2034

Figure 131: Western Europe Market Value (US$ Million) Analysis by End-Use, 2019 to 2034

Figure 132: Western Europe Market Volume (Tons) Analysis by End-Use, 2019 to 2034

Figure 133: Western Europe Market Value Share (%) and BPS Analysis by End-Use, 2024 to 2034

Figure 134: Western Europe Market Y-o-Y Growth (%) Projections by End-Use, 2024 to 2034

Figure 135: Western Europe Market Value (US$ Million) Analysis by Sales-Channel, 2019 to 2034

Figure 136: Western Europe Market Volume (Tons) Analysis by Sales-Channel, 2019 to 2034

Figure 137: Western Europe Market Value Share (%) and BPS Analysis by Sales-Channel, 2024 to 2034

Figure 138: Western Europe Market Y-o-Y Growth (%) Projections by Sales-Channel, 2024 to 2034

Figure 139: Western Europe Market Attractiveness by Nature, 2024 to 2034

Figure 140: Western Europe Market Attractiveness by Form, 2024 to 2034

Figure 141: Western Europe Market Attractiveness by Product Type, 2024 to 2034

Figure 142: Western Europe Market Attractiveness by End-Use, 2024 to 2034

Figure 143: Western Europe Market Attractiveness by Sales-Channel, 2024 to 2034

Figure 144: Western Europe Market Attractiveness by Country, 2024 to 2034

Figure 145: Eastern Europe Market Value (US$ Million) by Nature, 2024 to 2034

Figure 146: Eastern Europe Market Value (US$ Million) by Form, 2024 to 2034

Figure 147: Eastern Europe Market Value (US$ Million) by Product Type, 2024 to 2034

Figure 148: Eastern Europe Market Value (US$ Million) by End-Use, 2024 to 2034

Figure 149: Eastern Europe Market Value (US$ Million) by Sales-Channel, 2024 to 2034

Figure 150: Eastern Europe Market Value (US$ Million) by Country, 2024 to 2034

Figure 151: Eastern Europe Market Value (US$ Million) Analysis by Country, 2019 to 2034

Figure 152: Eastern Europe Market Volume (Tons) Analysis by Country, 2019 to 2034

Figure 153: Eastern Europe Market Value Share (%) and BPS Analysis by Country, 2024 to 2034

Figure 154: Eastern Europe Market Y-o-Y Growth (%) Projections by Country, 2024 to 2034

Figure 155: Eastern Europe Market Value (US$ Million) Analysis by Nature, 2019 to 2034

Figure 156: Eastern Europe Market Volume (Tons) Analysis by Nature, 2019 to 2034

Figure 157: Eastern Europe Market Value Share (%) and BPS Analysis by Nature, 2024 to 2034

Figure 158: Eastern Europe Market Y-o-Y Growth (%) Projections by Nature, 2024 to 2034

Figure 159: Eastern Europe Market Value (US$ Million) Analysis by Form, 2019 to 2034

Figure 160: Eastern Europe Market Volume (Tons) Analysis by Form, 2019 to 2034

Figure 161: Eastern Europe Market Value Share (%) and BPS Analysis by Form, 2024 to 2034

Figure 162: Eastern Europe Market Y-o-Y Growth (%) Projections by Form, 2024 to 2034

Figure 163: Eastern Europe Market Value (US$ Million) Analysis by Product Type, 2019 to 2034

Figure 164: Eastern Europe Market Volume (Tons) Analysis by Product Type, 2019 to 2034

Figure 165: Eastern Europe Market Value Share (%) and BPS Analysis by Product Type, 2024 to 2034

Figure 166: Eastern Europe Market Y-o-Y Growth (%) Projections by Product Type, 2024 to 2034

Figure 167: Eastern Europe Market Value (US$ Million) Analysis by End-Use, 2019 to 2034

Figure 168: Eastern Europe Market Volume (Tons) Analysis by End-Use, 2019 to 2034

Figure 169: Eastern Europe Market Value Share (%) and BPS Analysis by End-Use, 2024 to 2034

Figure 170: Eastern Europe Market Y-o-Y Growth (%) Projections by End-Use, 2024 to 2034

Figure 171: Eastern Europe Market Value (US$ Million) Analysis by Sales-Channel, 2019 to 2034

Figure 172: Eastern Europe Market Volume (Tons) Analysis by Sales-Channel, 2019 to 2034

Figure 173: Eastern Europe Market Value Share (%) and BPS Analysis by Sales-Channel, 2024 to 2034

Figure 174: Eastern Europe Market Y-o-Y Growth (%) Projections by Sales-Channel, 2024 to 2034

Figure 175: Eastern Europe Market Attractiveness by Nature, 2024 to 2034

Figure 176: Eastern Europe Market Attractiveness by Form, 2024 to 2034

Figure 177: Eastern Europe Market Attractiveness by Product Type, 2024 to 2034

Figure 178: Eastern Europe Market Attractiveness by End-Use, 2024 to 2034

Figure 179: Eastern Europe Market Attractiveness by Sales-Channel, 2024 to 2034

Figure 180: Eastern Europe Market Attractiveness by Country, 2024 to 2034

Figure 181: South Asia and Pacific Market Value (US$ Million) by Nature, 2024 to 2034

Figure 182: South Asia and Pacific Market Value (US$ Million) by Form, 2024 to 2034

Figure 183: South Asia and Pacific Market Value (US$ Million) by Product Type, 2024 to 2034

Figure 184: South Asia and Pacific Market Value (US$ Million) by End-Use, 2024 to 2034

Figure 185: South Asia and Pacific Market Value (US$ Million) by Sales-Channel, 2024 to 2034

Figure 186: South Asia and Pacific Market Value (US$ Million) by Country, 2024 to 2034

Figure 187: South Asia and Pacific Market Value (US$ Million) Analysis by Country, 2019 to 2034

Figure 188: South Asia and Pacific Market Volume (Tons) Analysis by Country, 2019 to 2034

Figure 189: South Asia and Pacific Market Value Share (%) and BPS Analysis by Country, 2024 to 2034

Figure 190: South Asia and Pacific Market Y-o-Y Growth (%) Projections by Country, 2024 to 2034

Figure 191: South Asia and Pacific Market Value (US$ Million) Analysis by Nature, 2019 to 2034

Figure 192: South Asia and Pacific Market Volume (Tons) Analysis by Nature, 2019 to 2034

Figure 193: South Asia and Pacific Market Value Share (%) and BPS Analysis by Nature, 2024 to 2034

Figure 194: South Asia and Pacific Market Y-o-Y Growth (%) Projections by Nature, 2024 to 2034

Figure 195: South Asia and Pacific Market Value (US$ Million) Analysis by Form, 2019 to 2034

Figure 196: South Asia and Pacific Market Volume (Tons) Analysis by Form, 2019 to 2034

Figure 197: South Asia and Pacific Market Value Share (%) and BPS Analysis by Form, 2024 to 2034

Figure 198: South Asia and Pacific Market Y-o-Y Growth (%) Projections by Form, 2024 to 2034

Figure 199: South Asia and Pacific Market Value (US$ Million) Analysis by Product Type, 2019 to 2034

Figure 200: South Asia and Pacific Market Volume (Tons) Analysis by Product Type, 2019 to 2034

Figure 201: South Asia and Pacific Market Value Share (%) and BPS Analysis by Product Type, 2024 to 2034

Figure 202: South Asia and Pacific Market Y-o-Y Growth (%) Projections by Product Type, 2024 to 2034

Figure 203: South Asia and Pacific Market Value (US$ Million) Analysis by End-Use, 2019 to 2034

Figure 204: South Asia and Pacific Market Volume (Tons) Analysis by End-Use, 2019 to 2034

Figure 205: South Asia and Pacific Market Value Share (%) and BPS Analysis by End-Use, 2024 to 2034

Figure 206: South Asia and Pacific Market Y-o-Y Growth (%) Projections by End-Use, 2024 to 2034

Figure 207: South Asia and Pacific Market Value (US$ Million) Analysis by Sales-Channel, 2019 to 2034

Figure 208: South Asia and Pacific Market Volume (Tons) Analysis by Sales-Channel, 2019 to 2034

Figure 209: South Asia and Pacific Market Value Share (%) and BPS Analysis by Sales-Channel, 2024 to 2034

Figure 210: South Asia and Pacific Market Y-o-Y Growth (%) Projections by Sales-Channel, 2024 to 2034

Figure 211: South Asia and Pacific Market Attractiveness by Nature, 2024 to 2034

Figure 212: South Asia and Pacific Market Attractiveness by Form, 2024 to 2034

Figure 213: South Asia and Pacific Market Attractiveness by Product Type, 2024 to 2034

Figure 214: South Asia and Pacific Market Attractiveness by End-Use, 2024 to 2034

Figure 215: South Asia and Pacific Market Attractiveness by Sales-Channel, 2024 to 2034

Figure 216: South Asia and Pacific Market Attractiveness by Country, 2024 to 2034

Figure 217: East Asia Market Value (US$ Million) by Nature, 2024 to 2034

Figure 218: East Asia Market Value (US$ Million) by Form, 2024 to 2034

Figure 219: East Asia Market Value (US$ Million) by Product Type, 2024 to 2034

Figure 220: East Asia Market Value (US$ Million) by End-Use, 2024 to 2034

Figure 221: East Asia Market Value (US$ Million) by Sales-Channel, 2024 to 2034

Figure 222: East Asia Market Value (US$ Million) by Country, 2024 to 2034

Figure 223: East Asia Market Value (US$ Million) Analysis by Country, 2019 to 2034

Figure 224: East Asia Market Volume (Tons) Analysis by Country, 2019 to 2034

Figure 225: East Asia Market Value Share (%) and BPS Analysis by Country, 2024 to 2034

Figure 226: East Asia Market Y-o-Y Growth (%) Projections by Country, 2024 to 2034

Figure 227: East Asia Market Value (US$ Million) Analysis by Nature, 2019 to 2034

Figure 228: East Asia Market Volume (Tons) Analysis by Nature, 2019 to 2034

Figure 229: East Asia Market Value Share (%) and BPS Analysis by Nature, 2024 to 2034

Figure 230: East Asia Market Y-o-Y Growth (%) Projections by Nature, 2024 to 2034

Figure 231: East Asia Market Value (US$ Million) Analysis by Form, 2019 to 2034

Figure 232: East Asia Market Volume (Tons) Analysis by Form, 2019 to 2034

Figure 233: East Asia Market Value Share (%) and BPS Analysis by Form, 2024 to 2034

Figure 234: East Asia Market Y-o-Y Growth (%) Projections by Form, 2024 to 2034

Figure 235: East Asia Market Value (US$ Million) Analysis by Product Type, 2019 to 2034

Figure 236: East Asia Market Volume (Tons) Analysis by Product Type, 2019 to 2034

Figure 237: East Asia Market Value Share (%) and BPS Analysis by Product Type, 2024 to 2034

Figure 238: East Asia Market Y-o-Y Growth (%) Projections by Product Type, 2024 to 2034

Figure 239: East Asia Market Value (US$ Million) Analysis by End-Use, 2019 to 2034

Figure 240: East Asia Market Volume (Tons) Analysis by End-Use, 2019 to 2034

Figure 241: East Asia Market Value Share (%) and BPS Analysis by End-Use, 2024 to 2034

Figure 242: East Asia Market Y-o-Y Growth (%) Projections by End-Use, 2024 to 2034

Figure 243: East Asia Market Value (US$ Million) Analysis by Sales-Channel, 2019 to 2034

Figure 244: East Asia Market Volume (Tons) Analysis by Sales-Channel, 2019 to 2034

Figure 245: East Asia Market Value Share (%) and BPS Analysis by Sales-Channel, 2024 to 2034

Figure 246: East Asia Market Y-o-Y Growth (%) Projections by Sales-Channel, 2024 to 2034

Figure 247: East Asia Market Attractiveness by Nature, 2024 to 2034

Figure 248: East Asia Market Attractiveness by Form, 2024 to 2034

Figure 249: East Asia Market Attractiveness by Product Type, 2024 to 2034

Figure 250: East Asia Market Attractiveness by End-Use, 2024 to 2034

Figure 251: East Asia Market Attractiveness by Sales-Channel, 2024 to 2034

Figure 252: East Asia Market Attractiveness by Country, 2024 to 2034

Figure 253: Middle East and Africa Market Value (US$ Million) by Nature, 2024 to 2034

Figure 254: Middle East and Africa Market Value (US$ Million) by Form, 2024 to 2034

Figure 255: Middle East and Africa Market Value (US$ Million) by Product Type, 2024 to 2034

Figure 256: Middle East and Africa Market Value (US$ Million) by End-Use, 2024 to 2034

Figure 257: Middle East and Africa Market Value (US$ Million) by Sales-Channel, 2024 to 2034

Figure 258: Middle East and Africa Market Value (US$ Million) by Country, 2024 to 2034

Figure 259: Middle East and Africa Market Value (US$ Million) Analysis by Country, 2019 to 2034

Figure 260: Middle East and Africa Market Volume (Tons) Analysis by Country, 2019 to 2034

Figure 261: Middle East and Africa Market Value Share (%) and BPS Analysis by Country, 2024 to 2034

Figure 262: Middle East and Africa Market Y-o-Y Growth (%) Projections by Country, 2024 to 2034

Figure 263: Middle East and Africa Market Value (US$ Million) Analysis by Nature, 2019 to 2034

Figure 264: Middle East and Africa Market Volume (Tons) Analysis by Nature, 2019 to 2034

Figure 265: Middle East and Africa Market Value Share (%) and BPS Analysis by Nature, 2024 to 2034

Figure 266: Middle East and Africa Market Y-o-Y Growth (%) Projections by Nature, 2024 to 2034

Figure 267: Middle East and Africa Market Value (US$ Million) Analysis by Form, 2019 to 2034

Figure 268: Middle East and Africa Market Volume (Tons) Analysis by Form, 2019 to 2034

Figure 269: Middle East and Africa Market Value Share (%) and BPS Analysis by Form, 2024 to 2034

Figure 270: Middle East and Africa Market Y-o-Y Growth (%) Projections by Form, 2024 to 2034

Figure 271: Middle East and Africa Market Value (US$ Million) Analysis by Product Type, 2019 to 2034

Figure 272: Middle East and Africa Market Volume (Tons) Analysis by Product Type, 2019 to 2034

Figure 273: Middle East and Africa Market Value Share (%) and BPS Analysis by Product Type, 2024 to 2034

Figure 274: Middle East and Africa Market Y-o-Y Growth (%) Projections by Product Type, 2024 to 2034

Figure 275: Middle East and Africa Market Value (US$ Million) Analysis by End-Use, 2019 to 2034

Figure 276: Middle East and Africa Market Volume (Tons) Analysis by End-Use, 2019 to 2034

Figure 277: Middle East and Africa Market Value Share (%) and BPS Analysis by End-Use, 2024 to 2034

Figure 278: Middle East and Africa Market Y-o-Y Growth (%) Projections by End-Use, 2024 to 2034

Figure 279: Middle East and Africa Market Value (US$ Million) Analysis by Sales-Channel, 2019 to 2034

Figure 280: Middle East and Africa Market Volume (Tons) Analysis by Sales-Channel, 2019 to 2034

Figure 281: Middle East and Africa Market Value Share (%) and BPS Analysis by Sales-Channel, 2024 to 2034

Figure 282: Middle East and Africa Market Y-o-Y Growth (%) Projections by Sales-Channel, 2024 to 2034

Figure 283: Middle East and Africa Market Attractiveness by Nature, 2024 to 2034

Figure 284: Middle East and Africa Market Attractiveness by Form, 2024 to 2034

Figure 285: Middle East and Africa Market Attractiveness by Product Type, 2024 to 2034

Figure 286: Middle East and Africa Market Attractiveness by End-Use, 2024 to 2034

Figure 287: Middle East and Africa Market Attractiveness by Sales-Channel, 2024 to 2034

Figure 288: Middle East and Africa Market Attractiveness by Country, 2024 to 2034

Frequently Asked Questions

At what rate will the industry grow?

The market is expected to grow at a CAGR of 5.6% throughout the forecast period.

What is the expected value of the industry by 2035?

By 2035, the sales value is expected to be worth USD 2.19 Billion.

What are the key factors driving the market?

Demand for vegan food is increasing demand for Powder Induction and Dispersion Systems.

Which region accounts for the highest consumption?

North America is expected to dominate the global consumption.

Who are the key players in manufacturing?

Some of the key players in manufacturing include Dos Anclas, PURATOS, Hydrosol GmbH & Co. KG and more.

Explore Similar Insights

Future Market Insights

Imitation Whipped Cream Market