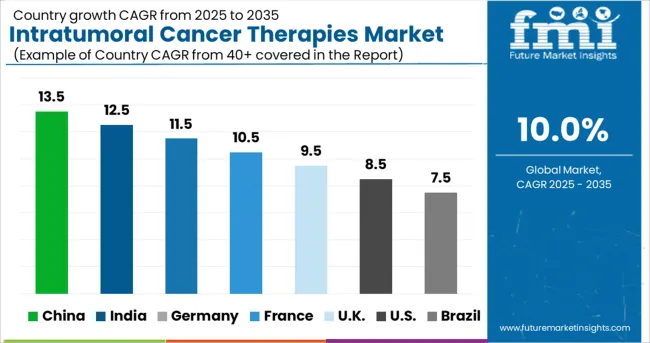
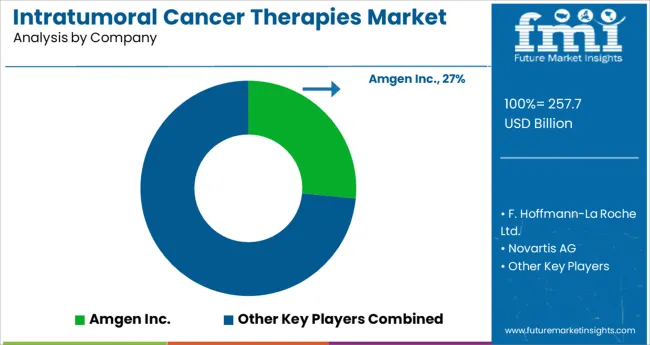
The Intratumoral Cancer Therapies Market is estimated to be valued at USD 257.7 billion in 2025 and is projected to reach USD 668.4 billion by 2035, registering a compound annual growth rate (CAGR) of 10.0% over the forecast period.
The intratumoral cancer therapies market is undergoing significant transformation as advancements in precision medicine, growing oncology burden, and demand for targeted therapies converge. Rising incidence of solid tumors, coupled with limitations of systemic treatments, has accelerated the adoption of localized intratumoral approaches.
These therapies are being viewed as an effective way to enhance immune response, minimize systemic toxicity, and improve patient outcomes. Future growth is expected to be supported by ongoing clinical trials, regulatory support for breakthrough therapies, and the integration of novel delivery platforms with immuno-oncology agents.
Innovations in formulation technologies and strategic collaborations between biopharmaceutical companies and research institutions are paving the path for broader clinical adoption and expansion into additional tumor types.
The market is segmented by Application, Technology Type, and End User and region. By Application, the market is divided into Lung Cancer, Breast Cancer, Colorectal Cancer, Melanoma, Prostate Cancer, Head & Neck Cancer, and Others. In terms of Technology Type, the market is classified into Monoclonal Antibodies, Vaccines, Checkpoint Inhibitors, Cell Therapies, Immune System Modulators, Adoptive Cell Transfer, Cytokines, and Others. Based on End User, the market is segmented into Hospital, Cancer Research Centres, and Clinical. Regionally, the market is classified into North America, Latin America, Western Europe, Eastern Europe, Balkan & Baltic Countries, Russia & Belarus, Central Asia, East Asia, South Asia & Pacific, and the Middle East & Africa.
The market is segmented by Application, Technology Type, and End User and region. By Application, the market is divided into Lung Cancer, Breast Cancer, Colorectal Cancer, Melanoma, Prostate Cancer, Head & Neck Cancer, and Others. In terms of Technology Type, the market is classified into Monoclonal Antibodies, Vaccines, Checkpoint Inhibitors, Cell Therapies, Immune System Modulators, Adoptive Cell Transfer, Cytokines, and Others. Based on End User, the market is segmented into Hospital, Cancer Research Centres, and Clinical. Regionally, the market is classified into North America, Latin America, Western Europe, Eastern Europe, Balkan & Baltic Countries, Russia & Belarus, Central Asia, East Asia, South Asia & Pacific, and the Middle East & Africa.
When segmented by application, lung cancer is projected to contribute 27.5 of the total market revenue in 2025, positioning it as the leading application segment. This leadership is attributed to the high prevalence and mortality rates of lung cancer worldwide, which have necessitated innovative localized treatment options.
The anatomical accessibility of certain lung tumors has facilitated the clinical feasibility of intratumoral injections, while the urgent unmet need in advanced-stage patients has accelerated their inclusion in clinical practice. The ability of these therapies to induce both local and systemic immune responses has been particularly relevant in lung cancer management, where traditional modalities have shown limited efficacy.
Increased awareness among oncologists, patient willingness to explore novel therapies, and promising trial outcomes have further solidified this segment’s prominence within the market.
Segmented by technology type, monoclonal antibodies are expected to account for 25.0 of the intratumoral cancer therapies market revenue in 2025, securing their position as the leading technology segment. This dominance has been driven by their proven specificity, ability to target tumor antigens effectively, and established regulatory pathways.
Their integration into intratumoral delivery has enabled enhanced local concentration at the tumor site, reducing systemic exposure and improving efficacy. The adaptability of monoclonal antibodies to conjugation with cytotoxic agents or immune modulators has further expanded their therapeutic potential in this setting.
Continuous innovation in antibody engineering and the development of bispecific and multifunctional formats have reinforced their relevance in the market, allowing them to maintain a competitive advantage in intratumoral applications.
When segmented by end user, hospitals are forecast to hold 33.0 of the market revenue in 2025, establishing themselves as the leading end user segment. This leadership stems from hospitals’ central role in delivering complex oncology care, supported by multidisciplinary teams and advanced procedural infrastructure.
The technical expertise required for intratumoral administration, along with the need for real-time imaging and monitoring, has concentrated these therapies within hospital settings. Institutional focus on offering cutting-edge treatments, combined with the ability to participate in clinical trials and adopt emerging protocols swiftly, has reinforced hospitals as the preferred venue for such interventions.
Additionally, the integration of oncology departments with research initiatives and the availability of specialized personnel have further strengthened hospitals’ dominance in facilitating access to intratumoral cancer therapies.
The complication in various people have increased. People suffering from even stage 1 cancer faced complications as the effects of the virus affected the immune system gravely. This paced up the demand for cancer therapies and also made the companies expand the product portfolio to provide enhanced immunity to the patients.
Thus, the market for Intratumoral Cancer Therapies is expected to register a CAGR of 10% in the forecast period 2025 to 2035.
Increasing incidence of cancer to push the market growth
According to the Globocan 2024 fact sheet, an estimated 19,292,789 new cancer cases were diagnosed worldwide, with nearly 9,958,133 deaths due to cancers, globally. Additionally, according to estimates from the International Agency for Research on Cancer (IARC), by 2040, the global burden of cancers is expected to grow to 27.5 million new cancer cases and 16.3 million deaths worldwide. The increasing incidence of cancer across the globe has been rapidly adding to the growth in the field of cancer research.
In April 2024, the US FDA approved Trodelvy (sacituzumab govitecan-hziy) for the treatment of adult patients with triple-negative breast cancer. Furthermore, in May 2024, the US FDA approved Tabrecta (capmatinib) for the treatment of adult patients with non-small cell lung cancer (NSCLC), and it is the first FDA-approved targeted therapy to treat NSCLC with specific mutations. Thus, the high research activities related to targeted therapies against cancers are expected to grow over the forecast period.
Strict Regulations and Higher Costs to restrict Market Growth
Inadequate reimbursement regulations are predicted to restrain market expansion. In recent years, there have been several developments in the cancer therapy industry. However, most medical insurance companies do not cover procedures that use computer-aided detection (CAD). As a consequence, individuals choose traditional diagnostic methods such as biopsies, and pathology tests, or conventional imaging methods such as mammography and MRI treatments. Furthermore, the high cost of intratumoral cancer therapy is projected to stifle market expansion.

How is the Adoption of the Intratumoral Cancer Therapies Market in Europe Turning Out?
Increased government funding propelling the growth of Intratumoral Cancer Therapies in Europe
The European market is predicted to increase significantly throughout the forecast period, with a CAGR of 5% during the forecast period. Europe is estimated to be the fastest-growing region over the forecast period due to an increase in research funding by government bodies to help combat the growing incidence of cancer cases across the region. In addition, the existence of major players promotes expansion in the United Kingdom. These firmsʜ.49; strategies include new releases and growth initiatives, which will continue to help overall expansion in Europe.
In addition to this, the European Union’s ‘Horizon Europe Mission on Cancer’ was launched in September 2024 to offer funds to a broad spectrum of activities that are intended to lower Europe’s cancer burden by accelerating research and innovation in cancer therapeutics. The mission is anticipated to help over 668.4 million cancer survivors by the year 20668.40.
What are the Factors Boosting the Market for Intratumoral Cancer Therapies in North America?
High Concentration of Key Players shaping the landscape for Intratumoral Cancer Therapies in North America

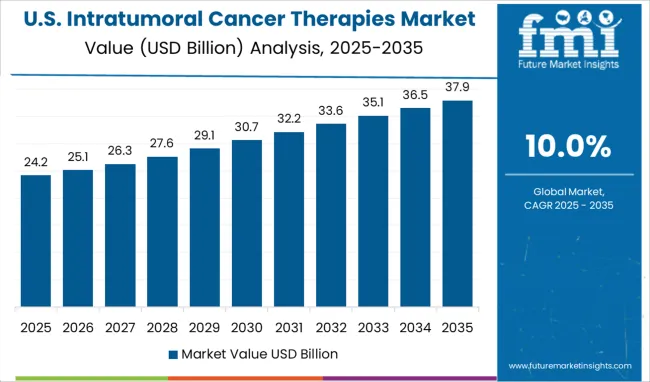
North America is expected to increase its market share in the future, owing to the increased adoption of cancer therapy and the growing burden of cancers in the USA. According to the Globocan 2024 report, an estimated 2,281,658 new cancer cases were diagnosed in the USA in 2024, with nearly 612,668.490 deaths. In 2024, The most common cancers were breast (25668.4,465), lung (227,875), prostate (209,512), and colon (101,809) in the USA.
In terms of market share and revenue, the North American market is predicted to be the most lucrative market during the forecast period with a revenue share of 40%. One of the primary factors propelling the industry in the region is the presence of various biotechnology and medical device firms. North America is likely to maintain its lead during the projection period due to factors such as increased spending for Research and Development initiatives and widespread use of new technology.
The regionʜ.49;s high concentration of important players, growing FDA approvals, strategic partnerships, and substantial expenditure in research & development activities are projected to enhance the market. For instance, in November 2024, Merck & Co. Inc entered into a definitive agreement to acquire Velosbio Inc., which is a privately held clinical-stage biopharmaceutical company committed to developing first-in-class cancer therapies targeting receptor tyrosine kinase-like orphan receptor 1 (ROR1).
Thus, given the aforementioned factors, the cancer therapy market is expected to grow significantly over the forecast period in North America.
The superior efficiency of checkpoint inhibitors bolsters the growth
On the basis of technology, the checkpoint inhibitors segment is estimated to witness the highest CAGR. The high growth can be attributed to the benefits offered by this therapeutic drug. Furthermore, the increasing product approvals by the regulatory authorities are expected to contribute to the market's growth. For instance, in August 2024, FDA approved the Glaxosmithkline PD-1 checkpoint inhibitor Jemperli (dostarlimab) for adults with mismatch repair-deficient recurrent or advanced endometrial cancer. Jemperli is an anti-PD-1 antibody that binds to the PD-1 receptor and blocks its interaction with the PD-1 ligands PD-L1 and PD-L2.
Increased incidence of lung cancer to drive market growth
By application, lung cancer is estimated to account for the largest share of the market. Due to the increasing number of patients suffering from lung diseases, the lung cancer segment is expected to hold the largest share in the next ten years as well. Increasing incidences of lung cancer due to the rising smoking population is one of the major factors driving the growth of the lung cancer therapeutics market. The risk of lung cancer is tenfold higher in smokers as compared to non-smokers.
The market is being driven by a growing demand for tailored therapy, the availability of highly effective medications, an increase in the elderly population, and an increase in the prevalence of unhealthy lifestyles.
Key start-up players in the Intratumoral Cancer Therapies market are-

Key players in the Intratumoral Cancer Therapies market are Amgen Inc, AstraZeneca, Bayer AG, Bristol-Myers Squibb Company, Pfizer Inc, Novartis AG, Johnson & Johnson, and Eli Lily Company, F.
| Report Attribute | Details |
|---|---|
| Market Value in 2025 | USD 257.7 billion |
| Market Value in 2035 | USD 668.4 billion |
| Growth Rate | CAGR of 10% from 2025 to 2035 |
| Base Year for Estimation | 2025 |
| Historical Data | 2020 to 2024 |
| Forecast Period | 2025 to 2035 |
| Quantitative Units | Revenue in billion and CAGR from 2025 to 2035 |
| Report Coverage | Revenue Forecast, Volume Forecast, Company Ranking, Competitive Landscape, Growth Factors, Trends, and Pricing Analysis |
| Segments Covered | End-Users, Application, Technology, Region |
| Regions Covered | North America; Latin America; Europe; Asia Pacific; Middle East and Africa (MEA) |
| Key Countries Profiled | USA, Canada, Brazil, Argentina, Germany, UK, France, Spain, Italy, Nordics, BENELUX, Australia & New Zealand, China, India, ASIAN, GCC, South Africa |
| Key Companies Profiled | Amgen Inc; AstraZeneca; Bayer AG; Bristol-Myers Squibb Company; Pfizer Inc; Novartis AG; Johnson & Johnson; and Eli Lily Company; F. |
| Customization | Available Upon Request |
The global intratumoral cancer therapies market is estimated to be valued at USD 257.7 billion in 2025.
It is projected to reach USD 668.4 billion by 2035.
The market is expected to grow at a 10.0% CAGR between 2025 and 2035.
The key product types are lung cancer, breast cancer, colorectal cancer, melanoma, prostate cancer, head & neck cancer and others.
monoclonal antibodies segment is expected to dominate with a 25.0% industry share in 2025.


Our Research Products

The "Full Research Suite" delivers actionable market intel, deep dives on markets or technologies, so clients act faster, cut risk, and unlock growth.

The Leaderboard benchmarks and ranks top vendors, classifying them as Established Leaders, Leading Challengers, or Disruptors & Challengers.

Locates where complements amplify value and substitutes erode it, forecasting net impact by horizon

We deliver granular, decision-grade intel: market sizing, 5-year forecasts, pricing, adoption, usage, revenue, and operational KPIs—plus competitor tracking, regulation, and value chains—across 60 countries broadly.

Spot the shifts before they hit your P&L. We track inflection points, adoption curves, pricing moves, and ecosystem plays to show where demand is heading, why it is changing, and what to do next across high-growth markets and disruptive tech

Real-time reads of user behavior. We track shifting priorities, perceptions of today’s and next-gen services, and provider experience, then pace how fast tech moves from trial to adoption, blending buyer, consumer, and channel inputs with social signals (#WhySwitch, #UX).

Partner with our analyst team to build a custom report designed around your business priorities. From analysing market trends to assessing competitors or crafting bespoke datasets, we tailor insights to your needs.
Supplier Intelligence
Discovery & Profiling
Capacity & Footprint
Performance & Risk
Compliance & Governance
Commercial Readiness
Who Supplies Whom
Scorecards & Shortlists
Playbooks & Docs
Category Intelligence
Definition & Scope
Demand & Use Cases
Cost Drivers
Market Structure
Supply Chain Map
Trade & Policy
Operating Norms
Deliverables
Buyer Intelligence
Account Basics
Spend & Scope
Procurement Model
Vendor Requirements
Terms & Policies
Entry Strategy
Pain Points & Triggers
Outputs
Pricing Analysis
Benchmarks
Trends
Should-Cost
Indexation
Landed Cost
Commercial Terms
Deliverables
Brand Analysis
Positioning & Value Prop
Share & Presence
Customer Evidence
Go-to-Market
Digital & Reputation
Compliance & Trust
KPIs & Gaps
Outputs
Full Research Suite comprises of:
Market outlook & trends analysis
Interviews & case studies
Strategic recommendations
Vendor profiles & capabilities analysis
5-year forecasts
8 regions and 60+ country-level data splits
Market segment data splits
12 months of continuous data updates
DELIVERED AS:
PDF EXCEL ONLINE
Cancer Registry Software Market Size and Share Forecast Outlook 2025 to 2035
Cancer Biological Therapy Market Size and Share Forecast Outlook 2025 to 2035
Cancer Diagnostics Market Analysis - Size, Share and Forecast 2025 to 2035
Cancer Biopsy Market - Growth & Technological Innovations 2025 to 2035
Cancer Vaccines Market Analysis by Technology, Treatment Method, Application and Region from 2025 to 2035
Cancer Gene Therapy Market Overview – Trends & Future Outlook 2024-2034
Cancer-focused Genetic Testing Service Market Analysis – Growth & Industry Insights 2024-2034
Cancer Tissue Diagnostic Market Trends – Growth & Industry Forecast 2024-2034
Cancer Supportive Care Products Market Trends – Growth & Forecast 2020-2030
Cancer Antigens Market
Pet Cancer Therapeutics Market Insights - Growth & Forecast 2024 to 2034
Skin Cancer Detection Devices Market Size and Share Forecast Outlook 2025 to 2035
Lung Cancer Diagnostics Market Size and Share Forecast Outlook 2025 to 2035
Lung Cancer Surgery Market - Size, Share, and Forecast 2025 to 2035
Lung Cancer Therapeutics Market Analysis – Size, Share, and Forecast Outlook 2025 to 2035
Lung Cancer PCR Panel Market Trends, Growth, Demand & Forecast 2025 to 2035
Brain Cancer Diagnostics Market Size and Share Forecast Outlook 2025 to 2035
Liver Cancer Diagnostics Market Size and Share Forecast Outlook 2025 to 2035
Blood Cancer Treatment Market Growth – Trends & Forecast 2025 to 2035
Canine Cancer Screening Services Market Size and Share Forecast Outlook 2025 to 2035

Thank you!
You will receive an email from our Business Development Manager. Please be sure to check your SPAM/JUNK folder too.
Chat With
MaRIA