The demand for cardboard trays in Japan is valued at USD 304.1 million in 2025 and is projected to reach USD 442.7 million by 2035, reflecting a compound annual growth rate of 3.8%. Growth is shaped by steady use of protective and display-ready packaging across food products, consumer goods and distribution channels that require lightweight yet durable tray formats. Cardboard trays remain central to packaging lines that prioritize stackability, ease of handling and compatibility with automated filling systems. As retailers and processors maintain consistent needs for organized presentation and product separation, procurement follows stable cycles tied to production volumes. These conditions support a measured but reliable expansion across the forecast window.
The growth curve shows a smooth, incremental rise beginning at USD 252.1 million in earlier years and reaching USD 304.1 million in 2025 before progressing toward USD 442.7 million by 2035. Annual values increase at even intervals, advancing from USD 315.8 million in 2026 to USD 327.8 million in 2027 and continuing with regular spacing through USD 381.0 million in 2031 and USD 410.7 million in 2033. This pattern reflects a mature packaging category driven by stable production requirements and predictable downstream consumption. As manufacturers refine tray dimensions and improve load stability to support varied product formats, cardboard trays maintain consistent demand supported by ongoing packaging standardization across Japan’s retail and distribution networks.
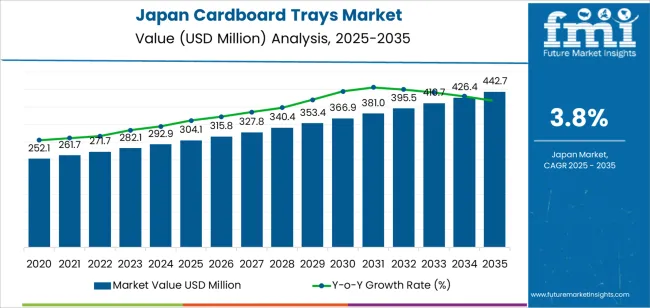
Demand in Japan for cardboard trays is expected to grow from USD 304.1 million in 2025 to USD 442.7 million by 2035, representing a compound annual growth rate (CAGR) of approximately 3.8%. From USD 252.1 million in 2020 the value steadily increases to USD 292.9 million in 2024 and USD 304.1 million in 2025. Growth is driven by sustained demand in foodservice, retail ready meals, and e-commerce packaging, where cardboard trays offer convenience and recyclability. Between 2025 and 2030 the demand rises further through line expansion, upgraded tray formats and broader utilisation of eco friendly packaging. Through to 2035 the value reaches USD 442.7 million, supported by premium material substitutions, design innovation and growing institutional adoption.
Over the decade the uplift from USD 304.1 million to USD 442.7 million amounts to USD 138.6 million. Early growth years are mostly volume driven as tray usage increases across retail and foodservice channels. In later years’ value growth plays a larger role, with upgraded tray formats higher board quality, specialty coatings, custom shapes and branding boosting average spend per unit. Additionally, sustainability imperatives prompt adoption of premium, higher cost cardboard tray options. Suppliers and converters focusing on innovation, customisation and sustainable materials are best positioned to capture a disproportionate share of the incremental opportunity toward USD 442.7 million by 2035.
| Metric | Value |
|---|---|
| Industry Value (2025) | USD 304.1 million |
| Forecast Value (2035) | USD 442.7 million |
| Forecast CAGR (2025 to 2035) | 3.8% |
Historical demand for cardboard trays in Japan has been shaped by growth in packaged foods, retail meal formats and the expansion of convenience stores that require organised, lightweight and easy-to-handle packaging. Supermarkets increased their assortments of bakery items, fruits, vegetables and chilled meals, all of which benefited from trays that support clean presentation and controlled portioning. Food processors and distributors relied on cardboard trays for stability during transport and for efficient shelf stocking in tightly managed retail environments.
Japan’s long-standing preference for tidy, uniform packaging reinforced consistent use across produce, confectionery and foodservice channels. As takeaway consumption expanded across urban regions, cardboard trays became a practical choice for transportation, quick storage and easy disposal, which strengthened their historical presence across daily consumer goods.
Future demand is being shaped by sustainability priorities, evolving retail formats and increasing automation in packaging facilities across Japan. Cardboard trays align with recycling objectives and support national policies aimed at reducing plastic dependence. E-commerce growth, meal kit expansion and temperature-controlled delivery networks require trays that enhance rigidity, protect contents and fit efficiently within shipment layouts.
Brands are requesting fibre-based solutions that match both environmental expectations and premium product presentation. Automated packing lines also require precise tray dimensions for consistent machine performance, increasing demand for well-engineered formats. Although fluctuations in pulp prices and competition from moulded fibre options present challenges, the combined influence of sustainability goals, supply-chain efficiency and diversified retail channels positions cardboard trays for continued steady growth in Japan.
The demand for cardboard trays in Japan is shaped by the material sources used to manufacture trays and the tray types selected for packaging needs. Material sources include virgin fiber and recycled fiber, each offering different strength levels, surface quality and suitability for food and non-food applications. Tray types include with cavity and without cavity formats, supporting varied product handling, display and portioning requirements. As producers and retailers focus on structural reliability, clean presentation and consistent performance across supply chains, the combination of fiber source and tray format influences purchasing decisions throughout Japan’s foodservice, retail and distribution sectors.
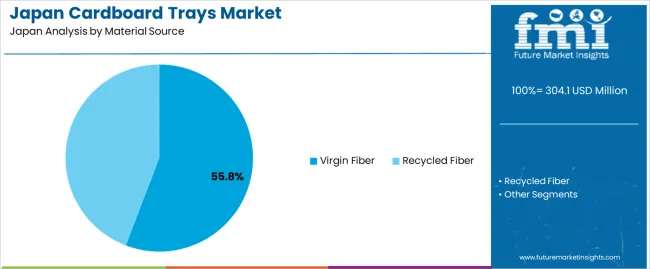
Virgin fiber trays account for 56% of total demand across material sources in Japan. Their leading share reflects the preference for high-strength, uniform fiber material that supports structural stability in food packaging and retail display. Virgin fiber provides a smoother surface finish, making it suitable for printed branding and clear labelling. Producers value its consistent rigidity and moisture tolerance, which help maintain tray shape during transport and storage. These characteristics support adoption across fresh produce, ready meals and bakery categories where reliable presentation and predictable performance are essential.
Demand for virgin fiber trays also grows as retailers emphasize shelf appearance and product protection. The material supports clean die-cutting and repeatable forming processes, enabling uniform tray dimensions across large batches. Its predictable behavior under temperature and humidity variations helps reduce deformation in chilled and ambient environments. Facilities value virgin fiber for its compatibility with automated packing lines, supporting efficient production cycles. As packaging operations prioritize dependable material quality, virgin fiber trays maintain a strong role across Japan’s cardboard tray segment.
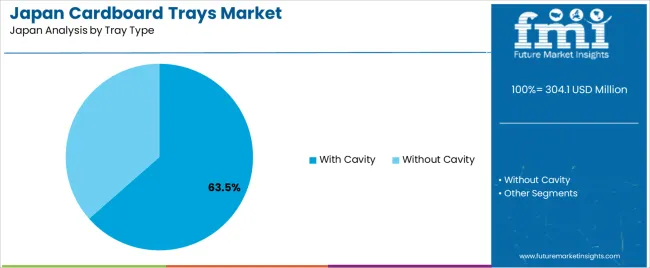
With cavity trays account for 63.5% of total demand across tray type categories in Japan. Their leading position reflects the need for structured compartments that support controlled portioning, product separation and enhanced display. These trays help maintain product alignment during handling, making them suitable for confectionery, bakery items, produce and ready-to-eat meals. Retailers rely on cavity formats to present items neatly while reducing movement during transport. The structure supports consistent product quality and improves consumer experience through organized presentation across diverse food categories.
Demand for with cavity trays continues to rise as convenience foods and multipack items expand across retail channels. The defined compartments help maintain product integrity and minimize surface damage during handling. Producers value the trays’ compatibility with automated filling and sealing equipment, which supports efficient line speeds. Their stable base and repeatable geometry enhance stackability and storage efficiency. As brands emphasize packaging that delivers clean presentation and dependable functionality, with cavity trays remain central to cardboard tray demand in Japan.
Demand for bioimpedance spectroscopy in Japan is influenced by widespread chronic-disease monitoring, strong hospital adoption of non-invasive diagnostics and an ageing population that requires frequent assessment of fluid balance and body-composition markers. Japan’s healthcare system favours technologies that offer quick readings with minimal operator burden, which positions bioimpedance well for nephrology, oncology and geriatric care. At the same time, hospital procurement remains conservative, and device integration must meet strict domestic standards for safety, accuracy and data compatibility across clinical systems.
Bioimpedance spectroscopy gains traction because Japan’s ageing population requires routine monitoring of hydration status, sarcopenia progression and heart-failure risk. Hospitals and outpatient centres rely heavily on non-invasive modalities, and bioimpedance aligns with this long-standing preference. Japanese clinicians also favour devices that operate quickly within high-volume workflows, making spectroscopy systems useful in pre-dialysis assessment, nutritional counselling and rehabilitation centres. These patterns reflect Japan’s emphasis on preventive care and early risk detection across older adult populations.
Opportunities exist in nephrology units, rehabilitation hospitals, home-medical-care programmes and regional clinics shifting toward continuous monitoring tools. Japan’s strong domestic ecosystem for body-composition devices creates openings for specialised spectroscopy models that integrate with electronic medical records and hospital information systems. As municipalities expand community-based elder-care networks, demand increases for portable units with rapid assessments. Device makers offering compact, Japanese-language-optimised interfaces and reliable calibration against local clinical standards may find strong adoption.
Constraints stem from conservative procurement processes, rigorous device-approval paths and strong clinician preference for proven modalities already embedded in hospital routines. Some facilities rely on established multifrequency body-composition devices rather than higher-cost spectroscopy models, slowing transition. Integration challenges with hospital IT systems and the need for alignment with Japanese calibration norms further delay uptake. In addition, smaller regional clinics may hesitate due to limited reimbursement clarity for spectroscopy-based assessments, creating uneven adoption across Japan.
| Region | CAGR (%) |
|---|---|
| Kyushu & Okinawa | 4.8% |
| Kanto | 4.4% |
| Kinki | 3.9% |
| Chubu | 3.4% |
| Tohoku | 3.0% |
| Rest of Japan | 2.8% |
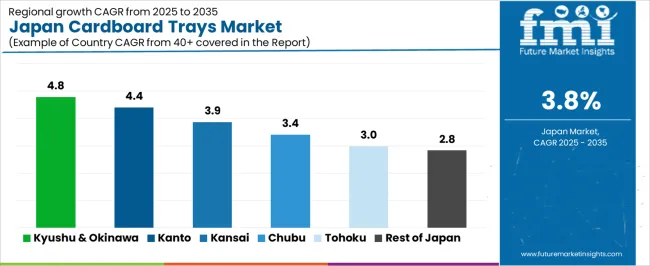
Demand for cardboard trays in Japan is rising steadily across regions, with Kyushu and Okinawa leading at 4.8%. Growth in this region reflects expanding use of lightweight trays in food packaging, retail displays, and agricultural distribution. Kanto follows at 4.4%, supported by dense consumer markets and strong activity among packaging manufacturers supplying supermarkets and convenience stores. Kinki records 3.9%, shaped by consistent retail demand and steady use of tray formats in prepared foods. Chubu grows at 3.4%, influenced by industrial packaging needs. Tohoku reaches 3.0%, where adoption increases gradually across regional producers. The rest of Japan posts 2.8%, indicating stable but moderate demand for cardboard trays in smaller commercial markets.
Kyushu & Okinawa is projected to grow at a CAGR of 4.8% through 2035 in demand for cardboard trays. Fukuoka and surrounding food processing regions are increasingly adopting trays for bakery, confectionery, and ready-to-eat products. Rising focus on packaging efficiency, product protection, and sustainability drives adoption. Manufacturers provide high-quality cardboard trays suitable for different food types and shapes. Distributors ensure accessibility across urban, semi-urban, and industrial food facilities. Growth in packaged foods, bakery production, and food service sectors supports steady adoption of cardboard trays in Kyushu & Okinawa.
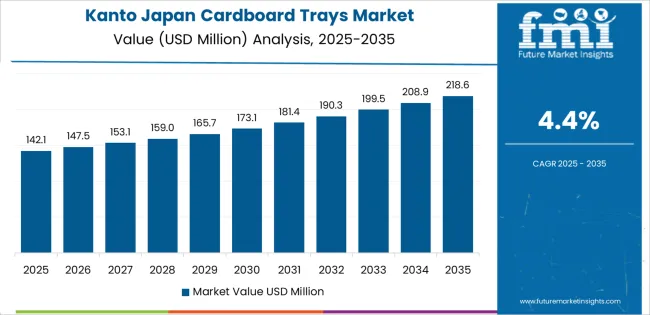
Kanto is projected to grow at a CAGR of 4.4% through 2035 in demand for cardboard trays. Tokyo and neighboring prefectures are increasingly adopting trays for bakery, confectionery, and prepared meals in food production. Rising focus on packaging durability, operational efficiency, and product safety drives adoption. Manufacturers provide trays compatible with various food types and production processes. Distributors ensure accessibility across urban, semi-urban, and industrial facilities. Expansion in packaged food manufacturing, bakery operations, and food service supports steady adoption of cardboard trays across Kanto.
Kinki is projected to grow at a CAGR of 3.9% through 2035 in demand for cardboard trays. Osaka, Kyoto, and surrounding regions are gradually adopting trays for bakery, confectionery, and food service applications. Rising demand for product protection, packaging efficiency, and operational safety drives adoption. Manufacturers provide trays suitable for multiple food types and shapes. Distributors ensure availability across urban and semi-urban food production facilities. Growth in packaged foods, bakery production, and food service operations supports steady adoption of cardboard trays across Kinki.
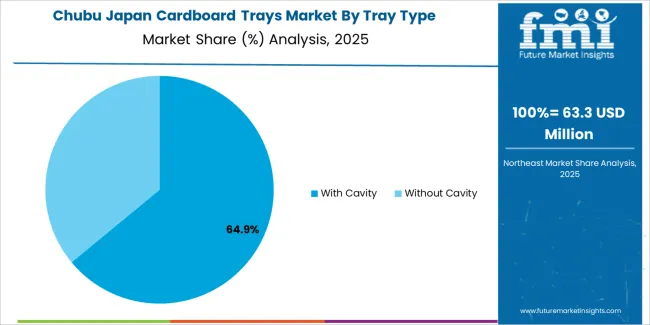
Chubu is projected to grow at a CAGR of 3.4% through 2035 in demand for cardboard trays. Nagoya and surrounding regions are increasingly adopting trays for bakery, confectionery, and prepared meal packaging. Rising focus on operational efficiency, product protection, and packaging durability drives adoption. Manufacturers supply trays compatible with various food types, shapes, and production lines. Distributors ensure accessibility across urban and semi-urban food production facilities. Expansion in bakery operations, packaged foods, and food service sectors supports steady adoption of cardboard trays across Chubu.
Tohoku is projected to grow at a CAGR of 3.0% through 2035 in demand for cardboard trays. Sendai and surrounding areas are gradually adopting trays for bakery, confectionery, and prepared meal applications. Rising demand for packaging efficiency, product safety, and operational convenience drives adoption. Manufacturers provide trays suitable for multiple food types and production needs. Distributors ensure accessibility across urban, semi-urban, and rural food production facilities. Growth in packaged food manufacturing, bakery operations, and food service supports steady adoption of cardboard trays across Tohoku.
The Rest of Japan is projected to grow at a CAGR of 2.8% through 2035 in demand for cardboard trays. Smaller towns and rural areas gradually adopt trays for bakery, confectionery, and food service applications. Rising focus on operational efficiency, product protection, and packaging safety drives adoption. Manufacturers supply trays compatible with various food types, shapes, and production lines. Distributors ensure accessibility across urban, semi-urban, and rural food production sites. Expansion in bakery operations, packaged foods, and food service supports steady adoption of cardboard trays across the Rest of Japan.
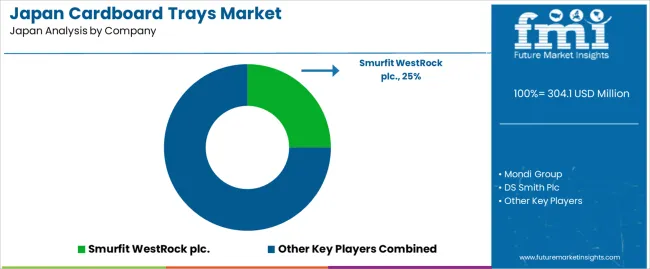
The demand for cardboard trays in Japan is rising as food, beverage and retail supply chains place higher value on packaging formats that are lightweight, sustainable and efficient for display. Japanese manufacturers and importers increasingly rely on trays for fresh produce, baked goods and confectionery items where visibility, ventilation and ease of handling matter. The country’s retail channel mix convenience stores, supermarkets and online grocery also drives use of trays tailored for shelf stacking and delivery. Sustainability policies and consumer preferences support trays made from recycled board or with easy-flatten attributes, strengthening uptake of cardboard tray formats across Japan’s packaging segment.
Key companies shaping the cardboard-tray segment in Japan include global packaging firms such as Smurfit Kappa Group plc, Mondi Group, DS Smith plc, WestRock Company and International Paper Company. These firms supply corrugated and solid board trays designed for Japanese retail and logistics environments. To reflect Japan’s national presence, domestic converters and packaging specialists such as Aikawa Packaging Corporation and Daiwa Pack Co., Ltd. also play a meaningful role, adapting tray designs for local needs, supply-chain constraints and regulatory compliance. The combination of global brands and Japanese specialists provides a balanced competitive landscape for cardboard trays in Japan.
| Items | Values |
|---|---|
| Quantitative Units (2025) | USD million |
| Material Source | Virgin Fiber, Recycled Fiber |
| Tray Type | With Cavity, Without Cavity |
| End-Use Industry | Food & Beverage, Retail, Pharmaceuticals, Personal Care & Cosmetics, Agriculture |
| Region | Kyushu & Okinawa, Kanto, Kinki, Chubu, Tohoku, Rest of Japan |
| Countries Covered | Japan |
| Key Companies Profiled | Smurfit Kappa Group plc, WestRock Company, Mondi Group, DS Smith Plc, International Paper Company, Aikawa Packaging Corporation, Daiwa Pack Co., Ltd. |
| Additional Attributes | Dollar by sales by material source and tray type; regional CAGR and adoption trends; volume vs. value contributions across forecast period; growth in foodservice, retail, e-commerce, and agriculture packaging; influence of sustainability and recycled material adoption; premium tray formats and custom designs; automated packaging line compatibility; constraints from pulp prices and competition from molded-fiber alternatives; opportunities in branded, multi-compartment trays; innovation in coatings, folding, and stackable designs; impact of convenience-store, supermarket, and e-commerce distribution channels; key domestic and international suppliers serving Japan’s packaging ecosystem. |
The demand for cardboard trays in japan is estimated to be valued at USD 304.1 million in 2025.
The market size for the cardboard trays in japan is projected to reach USD 442.7 million by 2035.
The demand for cardboard trays in japan is expected to grow at a 3.8% CAGR between 2025 and 2035.
The key product types in cardboard trays in japan are virgin fiber and recycled fiber.
In terms of tray type, with cavity segment is expected to command 63.5% share in the cardboard trays in japan in 2025.


Our Research Products

The "Full Research Suite" delivers actionable market intel, deep dives on markets or technologies, so clients act faster, cut risk, and unlock growth.

The Leaderboard benchmarks and ranks top vendors, classifying them as Established Leaders, Leading Challengers, or Disruptors & Challengers.

Locates where complements amplify value and substitutes erode it, forecasting net impact by horizon

We deliver granular, decision-grade intel: market sizing, 5-year forecasts, pricing, adoption, usage, revenue, and operational KPIs—plus competitor tracking, regulation, and value chains—across 60 countries broadly.

Spot the shifts before they hit your P&L. We track inflection points, adoption curves, pricing moves, and ecosystem plays to show where demand is heading, why it is changing, and what to do next across high-growth markets and disruptive tech

Real-time reads of user behavior. We track shifting priorities, perceptions of today’s and next-gen services, and provider experience, then pace how fast tech moves from trial to adoption, blending buyer, consumer, and channel inputs with social signals (#WhySwitch, #UX).

Partner with our analyst team to build a custom report designed around your business priorities. From analysing market trends to assessing competitors or crafting bespoke datasets, we tailor insights to your needs.
Supplier Intelligence
Discovery & Profiling
Capacity & Footprint
Performance & Risk
Compliance & Governance
Commercial Readiness
Who Supplies Whom
Scorecards & Shortlists
Playbooks & Docs
Category Intelligence
Definition & Scope
Demand & Use Cases
Cost Drivers
Market Structure
Supply Chain Map
Trade & Policy
Operating Norms
Deliverables
Buyer Intelligence
Account Basics
Spend & Scope
Procurement Model
Vendor Requirements
Terms & Policies
Entry Strategy
Pain Points & Triggers
Outputs
Pricing Analysis
Benchmarks
Trends
Should-Cost
Indexation
Landed Cost
Commercial Terms
Deliverables
Brand Analysis
Positioning & Value Prop
Share & Presence
Customer Evidence
Go-to-Market
Digital & Reputation
Compliance & Trust
KPIs & Gaps
Outputs
Full Research Suite comprises of:
Market outlook & trends analysis
Interviews & case studies
Strategic recommendations
Vendor profiles & capabilities analysis
5-year forecasts
8 regions and 60+ country-level data splits
Market segment data splits
12 months of continuous data updates
DELIVERED AS:
PDF EXCEL ONLINE
Cardboard Trays Market Size, Share & Forecast 2025 to 2035
Japan Faith-based Tourism Market Size and Share Forecast Outlook 2025 to 2035
Japan Sports Tourism Market Size and Share Forecast Outlook 2025 to 2035
Japan Respiratory Inhaler Devices Market Size and Share Forecast Outlook 2025 to 2035
Japan Halal Tourism Market Size and Share Forecast Outlook 2025 to 2035
Japan Automated People Mover Industry Size and Share Forecast Outlook 2025 to 2035
Japan Automotive Load Floor Industry Analysis Size and Share Forecast Outlook 2025 to 2035
Japan Food Cling Film Market Size and Share Forecast Outlook 2025 to 2035
Japan Polypropylene Packaging Films Market Size and Share Forecast Outlook 2025 to 2035
Cardboard Flask Market Size, Share & Forecast 2025 to 2035
Cardboard Crates Market Size and Share Forecast Outlook 2025 to 2035
Japan Probiotic Yogurt Market is segmented by product type, source type, nature type, flavor type, fat content, sales channel and key city/province through 2025 to 2035.
japan Tortilla Market - Growth, Trends and Forecast from 2025 to 2035
Japan Cosmetics ODM Market Analysis - Size, Share & Trends 2025 to 2035
Japan Automotive Turbocharger Market Insights – Demand, Size & Industry Trends 2025–2035
Japan Yeast Market Insights – Demand, Size & Industry Trends 2025–2035
Japan Green and Bio-based Polyol Market Insights – Demand, Size & Industry Trends 2025–2035
Japan Natural Food Color Market Trends – Growth, Demand & Forecast 2025–2035
Japan Coated Fabrics Market Growth – Trends, Demand & Innovations 2025–2035
Japan Barite Market Growth – Trends, Demand & Innovations 2025–2035

Thank you!
You will receive an email from our Business Development Manager. Please be sure to check your SPAM/JUNK folder too.
Chat With
MaRIA