The Japan snack bars demand is valued at USD 1.2 billion in 2025 and is forecasted to reach USD 2.4 billion by 2035, reflecting a CAGR of 7.1%. Demand is supported by rising consumption of convenient nutrition products, broader interest in portion-controlled foods, and higher adoption of on-the-go eating habits across working populations. Manufacturers continue to expand formulations that feature balanced macronutrient profiles, added fibre, and plant-based ingredients. Growth is further influenced by retail placement in supermarkets, convenience stores, and e-commerce channels that offer frequent product rotation and accessible price points.
Protein and energy bars lead the product landscape. These bars are selected for their functional positioning, suitability for pre- and post-exercise nutrition, and compatibility with weight-management routines. The segment benefits from expanded flavour variants, improved texture technologies, and greater use of natural sweeteners. Product developers also integrate nuts, grains, and fortified ingredients to meet targeted nutritional preferences.
Kyushu & Okinawa, Kanto, and Kinki record the highest utilisation levels due to dense urban populations, strong retail infrastructure, and concentrated distribution networks. These regions also host food-processing facilities that support rapid product innovation cycles. Key suppliers include General Mills, Kellanova, WEETABIX, The Quaker Oats Company, and Mondelez International Group, which provide protein bars, cereal bars, granola bars, and blended-ingredient formulations for mainstream and specialised nutrition categories.
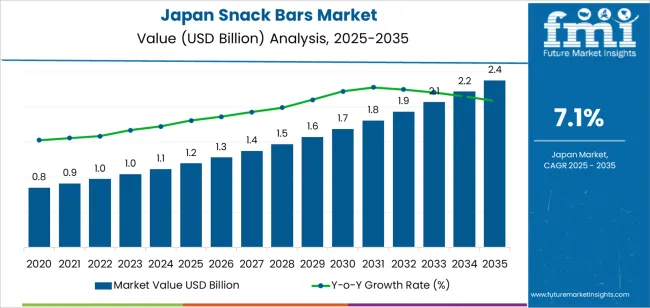
Growth-momentum analysis shows a firm early trajectory from 2025 to 2029 as convenience retail, fitness-nutrition formats, and on-the-go meal replacements gain wider use. Early momentum is supported by steady expansion in protein bars, fibre-rich formulations, and portion-controlled snack products. Manufacturers introduce varied flavour profiles and cleaner-label ingredient lists, reinforcing consistent procurement across supermarkets, e-commerce channels, and fitness outlets. These factors create a clear early uplift driven by product diversification and routine consumer adoption.
Between 2030 and 2035, growth momentum transitions into a more measured but stable pattern. By this stage, core product categories reach maturity, and incremental gains arise from functional innovations such as fortified bars, digestive-health blends, and low-sugar formats. Expansion aligns with predictable purchasing cycles and steady demand in corporate wellness, travel retail, and lifestyle-nutrition channels. Improvements in shelf-life stability, portion-format variety, and plant-based ingredient sourcing support continued momentum without generating sharp acceleration. The overall profile reflects a shift from early innovation-driven expansion to a mature, continuity-based phase anchored in regular consumption and broad distribution across Japan’s packaged-snack ecosystem.
| Metric | Value |
|---|---|
| Japan Snack Bars Sales Value (2025) | USD 1.2 billion |
| Japan Snack Bars Forecast Value (2035) | USD 2.4 billion |
| Japan Snack Bars Forecast CAGR (2025 to 2035) | 7.1% |
Demand for snack bars in Japan is rising because consumers seek convenient, on-the-go food options that accommodate busy lifestyles and growing interest in health-oriented products. Snack bars that incorporate protein, fibre, reduced sugar and functional ingredients appeal to Japanese adults and younger demographics looking for smart snacking alternatives. Retail channels such as convenience stores, vending machines, drugstores and online platforms are increasingly stocking snack bars that fit breakfast on the move or between‐meal consumption.
The trend toward smaller portion sizes and variety in flavours also supports innovation and uptake of snack bars with premium or indulgent positioning. Constraints include competition from traditional snack formats, such as rice crackers and confectionery, which remain popular in Japan. Manufacturers must balance flavour and texture preferences with health claims, and higher ingredient costs for premium bars may push prices above what mass consumers are willing to pay.
Demand for snack bars in Japan reflects shifting dietary habits, interest in convenient nutrient-dense foods, and broader acceptance of packaged on-the-go formats. Product-type preferences relate to energy needs, flavour expectations, and nutritional profiles suited to work, school, and fitness routines. Distribution-channel patterns show how consumers access snack bars across retail environments with varying product visibility and assortment depth.
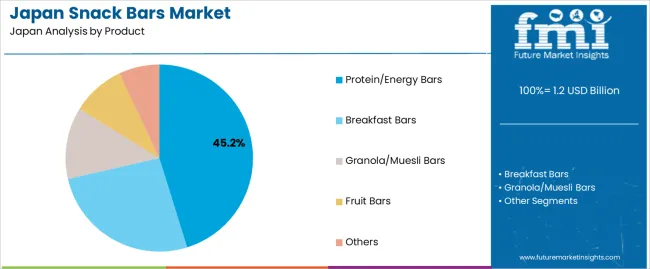
Protein and energy bars hold 45.2% of national demand and represent the leading product category. Their composition supports active individuals seeking concentrated nutrition, sustained energy, and portion-controlled convenience. Breakfast bars account for 26.2%, serving consumers who substitute traditional meals with compact formats compatible with commuting and workplace routines. Granola and muesli bars represent 12.4%, providing fibre-rich options suited to light snacking. Fruit bars account for 9.2%, supporting preferences for natural ingredients and mild sweetness. Other snack-bar formats hold 7.0%, covering blended or specialty formulations. Product-type distribution reflects protein intake habits, lifestyle routines, and flavour preferences across Japanese consumers selecting snack bars for practicality and balanced nutrition.
Key drivers and attributes:
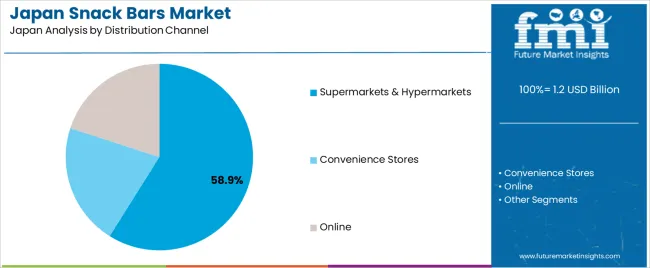
Supermarkets and hypermarkets hold 58.9% of national demand and represent the dominant distribution channel. These stores provide broad product assortments, clear packaging comparisons, and promotional availability that influence purchasing behaviour. Convenience stores represent 21.1%, supporting impulse purchases, commute-related snacking, and rapid product access near transit hubs. Online channels account for 20.0%, enabling bulk purchases, subscription ordering, and access to niche or imported snack-bar varieties. Distribution-channel distribution reflects differences in product exposure, consumer convenience, and purchase-frequency patterns. Japanese consumers select channels based on routine shopping behaviour, price consistency, and availability of specialised formulations.
Key drivers and attributes:
Convenience snacking growth, health-and-wellness focus, and urban work-lifestyle shifts are driving demand.
In Japan, demand for snack bars is increasing as consumers look for portable and nutrient-rich options that fit busy schedules and smaller meal occasions. The growth of on-the-go eating, participation in fitness and wellness culture, and rising interest in functional ingredients such as nuts, whole grains, protein and low sugar support snack-bar consumption. Urbanisation, rising single-person households and expanding convenience-store networks further boost the availability and trial of snack-bars across work and transit contexts, strengthening the category’s presence.
Population decline, fierce internal competition and slower volume growth restrain expansion.
Although value growth is positive, Japan’s overall population decline and ageing demographics limit long-term volume growth potential for snack bars. Domestic snack manufacturers face heavy competition from established brands, private labels and frequent new launches, which can compress margins and slow expansion. Some consumers perceive snack bars as less indulgent compared with confectioneries or fresh snack options, which may reduce repeat purchase. In mature retail channels, space-allocation competition and high store-listing costs pose additional restraints for new entrants and product formats.
Shift toward plant-based and high-protein bars, integration of traditional Japanese flavours and rising e-commerce distribution define industry trends.
Japanese snack-bar manufacturers are increasingly launching products formulated with plant-based protein, seeds and functional additives to appeal to wellness-oriented consumers. Incorporation of traditional Japanese ingredients such as matcha, azuki beans, yuzu and kinako allows brands to localise snack bars and differentiate in the industry. Online grocery and subscription snack services are gaining traction as consumers seek convenience beyond physical retail, and brands are leveraging direct-to-consumer channels to provide trial packs and diversified flavour offerings. These developments support broader adoption of snack bars across demographics and use occasions in Japan.
Demand for snack bars in Japan is rising through 2035 as health-focused consumers, busy professionals, and younger demographics shift toward portable, high-fiber, and protein-enriched products. Manufacturers expand product lines featuring whole grains, nuts, seeds, and low-sugar formulations, while retailers promote functional-positioned bars for weight management, energy support, and meal supplementation.
Growth is reinforced by increasing gym attendance, rising interest in plant-based nutrition, and broader shelf presence in supermarkets, convenience stores, and e-commerce channels. Regional variation reflects differences in urban density, health-food penetration, and lifestyle trends. Kyushu & Okinawa leads with 8.9%, followed by Kanto (8.2%), Kinki (7.2%), Chubu (6.3%), Tohoku (5.6%), and the Rest of Japan (5.3%).
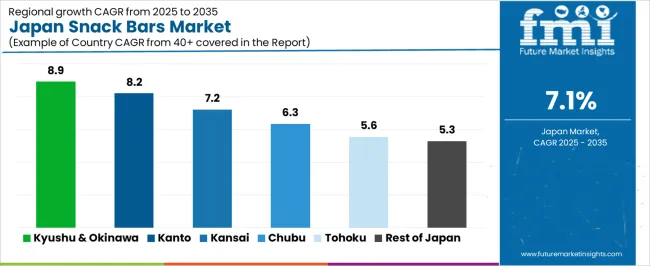
| Region | CAGR (2025 to 2035) |
|---|---|
| Kyushu & Okinawa | 8.9% |
| Kanto | 8.2% |
| Kinki | 7.2% |
| Chubu | 6.3% |
| Tohoku | 5.6% |
| Rest of Japan | 5.3% |
Kyushu & Okinawa grows at 8.9% CAGR, supported by rising interest in functional foods, expanding fitness participation, and strong retail engagement across Fukuoka, Kagoshima, and Okinawa’s urban centers. Local consumers adopt snack bars as convenient breakfast alternatives and mid-day nutrition boosters. Supermarkets expand shelf space for high-protein, fiber-rich, and nut-based bars, while convenience stores promote compact packs targeting working adults. Regional tourism and outdoor recreation increase demand for portable energy bars suited for travel and leisure activities. Local wellness brands introduce domestically sourced formulations using barley, brown rice, and indigenous fruits to appeal to regional preferences.
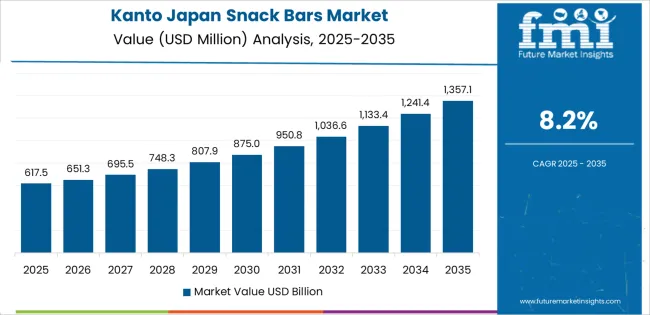
Kanto grows at 8.2% CAGR, driven by Japan’s largest concentration of health-food producers, fitness clubs, corporate offices, and high-traffic convenience stores across Tokyo, Kanagawa, Chiba, and Saitama. Urban professionals adopt snack bars for meal replacement during commuting and office hours. Manufacturers introduce targeted formulations including low-sugar bars, protein blends, and immunity-support variants. Retailers integrate dedicated functional-snack sections, improving product visibility. Growing gym culture and endurance sports participation contribute to rising demand for performance bars. E-commerce platforms further expand selection, enabling premium and imported brands to reach a broad consumer base.
Kinki grows at 7.2% CAGR, supported by active retail networks, strong lifestyle-food adoption, and diversified consumer segments across Osaka, Kyoto, and Hyogo. Bakeries and specialty food shops introduce local-flavor bars featuring matcha, roasted grains, and black sesame. Convenience stores expand offerings targeted at students and office workers seeking affordable on-the-go nutrition. Fitness centers and wellness retailers promote protein and fiber bars as part of weight-management programs. Families adopt snack bars as lunchbox additions, boosting multipack sales. Manufacturers collaborate with regional food brands to create flavor variations tailored to Kansai preferences.
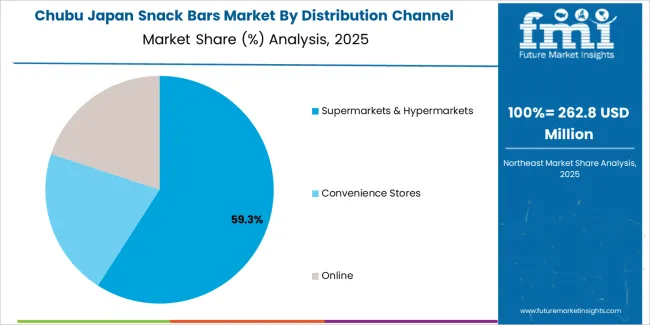
Chubu grows at 6.3% CAGR, shaped by manufacturing clusters, rising health-food interest, and expanding urban retail presence across Aichi, Shizuoka, and Gifu. Food manufacturers integrate regional ingredients such as green tea, citrus, and barley into snack-bar product lines. Working professionals in Nagoya adopt bars for mid-day energy and quick nutrition during commuting. Retail chains expand health-snack shelves, increasing exposure to fortified and functional formats. Outdoor-activity groups in mountain regions contribute to demand for energy-dense bars used during hiking and sports activities.
Tohoku grows at 5.6% CAGR, supported by gradual health-food adoption, expanding supermarket networks, and emerging local wellness initiatives across Miyagi, Iwate, and Aomori. Consumers adopt snack bars for portable nutrition during work and school commutes. Regional producers develop bars incorporating apples, berries, and grains native to Tohoku. Supermarkets promote functional-food categories, increasing visibility of high-fiber and low-sugar options. Interest in outdoor activities, particularly in mountainous areas, drives additional consumption of energy bars.
The Rest of Japan grows at 5.3% CAGR, shaped by steady retail expansion, rising interest in plant-based foods, and growing online purchases of functional snacks. Smaller cities and rural districts see increasing supermarket availability of nut-based and fortified bars. Local producers launch simple, clean-label bars targeted at families and older consumers seeking fiber-rich snacks. Online platforms expand access to organic and premium options that are not widely available in local stores.
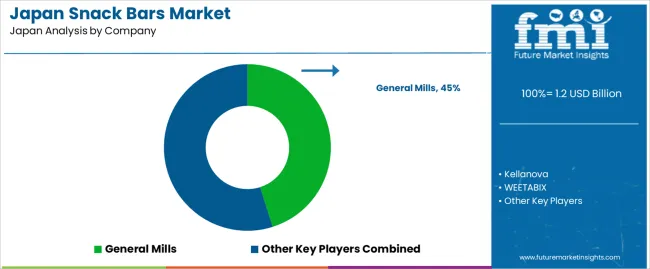
Demand for snack bars in Japan is shaped by a concentrated group of global food manufacturers supplying granola bars, protein bars, cereal bars, and functional on-the-go products. General Mills holds the leading position with an estimated 45.1% share, supported by controlled formulation standards, consistent texture stability, and strong distribution across supermarkets, convenience stores, and e-commerce channels. Its position is reinforced by predictable ingredient quality and steady adoption of oat- and grain-based products among Japanese consumers seeking quick, portioned snacks.
Kellanova and WEETABIX follow as significant participants. Kellanova supplies grain-based and nutritionally fortified snack bars with reliable flavour consistency and stable structural integrity suited to ambient retail environments. WEETABIX maintains a presence through fibre-focused bars designed for controlled energy release and straightforward portion management, supporting both breakfast and between-meal consumption patterns.
The Quaker Oats Company contributes capability with oat-based snack formats offering stable moisture control and dependable shelf life, aligning with Japanese preferences for light, cereal-based snacks. Mondelez International Group adds further depth through chocolate-based and functional bar offerings, emphasizing consistent sensory characteristics and strong brand familiarity.
Competition across this segment centres on texture stability, ingredient traceability, flavour consistency, nutritional positioning, and distribution reliability. Demand continues to expand as Japanese consumers adopt portable, portion-controlled snacks aligned with busy urban lifestyles, favouring bars that provide predictable quality, balanced nutrients, and steady on-the-go convenience across retail channels.
| Items | Values |
|---|---|
| Quantitative Units | USD billion |
| Product | Protein/Energy Bars, Breakfast Bars, Granola/Muesli Bars, Fruit Bars, Others |
| Distribution Channel | Supermarkets & Hypermarkets, Convenience Stores, Online |
| Regions Covered | Kyushu & Okinawa, Kanto, Kinki, Chubu, Tohoku, Rest of Japan |
| Key Companies Profiled | General Mills, Kellanova, WEETABIX, The Quaker Oats Company, Mondelez International Group |
| Additional Attributes | Dollar sales by product type and distribution channel; regional consumption trends across Kyushu & Okinawa, Kanto, Kinki, Chubu, Tohoku, and Rest of Japan; competitive landscape of snack bar producers; developments in high-protein and clean-label formulations, low-sugar breakfast alternatives, and functional ingredient blends; integration with retail, convenience, and online health-food channels across Japan. |
The demand for snack bars in japan is estimated to be valued at USD 1.2 billion in 2025.
The market size for the snack bars in japan is projected to reach USD 2.4 billion by 2035.
The demand for snack bars in japan is expected to grow at a 7.1% CAGR between 2025 and 2035.
The key product types in snack bars in japan are protein/energy bars, breakfast bars, granola/muesli bars, fruit bars and others.
In terms of distribution channel, supermarkets & hypermarkets segment is expected to command 58.9% share in the snack bars in japan in 2025.


Our Research Products

The "Full Research Suite" delivers actionable market intel, deep dives on markets or technologies, so clients act faster, cut risk, and unlock growth.

The Leaderboard benchmarks and ranks top vendors, classifying them as Established Leaders, Leading Challengers, or Disruptors & Challengers.

Locates where complements amplify value and substitutes erode it, forecasting net impact by horizon

We deliver granular, decision-grade intel: market sizing, 5-year forecasts, pricing, adoption, usage, revenue, and operational KPIs—plus competitor tracking, regulation, and value chains—across 60 countries broadly.

Spot the shifts before they hit your P&L. We track inflection points, adoption curves, pricing moves, and ecosystem plays to show where demand is heading, why it is changing, and what to do next across high-growth markets and disruptive tech

Real-time reads of user behavior. We track shifting priorities, perceptions of today’s and next-gen services, and provider experience, then pace how fast tech moves from trial to adoption, blending buyer, consumer, and channel inputs with social signals (#WhySwitch, #UX).

Partner with our analyst team to build a custom report designed around your business priorities. From analysing market trends to assessing competitors or crafting bespoke datasets, we tailor insights to your needs.
Supplier Intelligence
Discovery & Profiling
Capacity & Footprint
Performance & Risk
Compliance & Governance
Commercial Readiness
Who Supplies Whom
Scorecards & Shortlists
Playbooks & Docs
Category Intelligence
Definition & Scope
Demand & Use Cases
Cost Drivers
Market Structure
Supply Chain Map
Trade & Policy
Operating Norms
Deliverables
Buyer Intelligence
Account Basics
Spend & Scope
Procurement Model
Vendor Requirements
Terms & Policies
Entry Strategy
Pain Points & Triggers
Outputs
Pricing Analysis
Benchmarks
Trends
Should-Cost
Indexation
Landed Cost
Commercial Terms
Deliverables
Brand Analysis
Positioning & Value Prop
Share & Presence
Customer Evidence
Go-to-Market
Digital & Reputation
Compliance & Trust
KPIs & Gaps
Outputs
Full Research Suite comprises of:
Market outlook & trends analysis
Interviews & case studies
Strategic recommendations
Vendor profiles & capabilities analysis
5-year forecasts
8 regions and 60+ country-level data splits
Market segment data splits
12 months of continuous data updates
DELIVERED AS:
PDF EXCEL ONLINE
Snack Bars Market – Growth, Demand & Functional Nutrition Trends
Demand for Fruit Snacks in Japan Size and Share Forecast Outlook 2025 to 2035
Demand for Pet Snacks and Treats in Japan Size and Share Forecast Outlook 2025 to 2035
Japan Faith-based Tourism Market Size and Share Forecast Outlook 2025 to 2035
Japan Sports Tourism Market Size and Share Forecast Outlook 2025 to 2035
Japan Respiratory Inhaler Devices Market Size and Share Forecast Outlook 2025 to 2035
Japan Halal Tourism Market Size and Share Forecast Outlook 2025 to 2035
Japan Automated People Mover Industry Size and Share Forecast Outlook 2025 to 2035
Japan Automotive Load Floor Industry Analysis Size and Share Forecast Outlook 2025 to 2035
Japan Food Cling Film Market Size and Share Forecast Outlook 2025 to 2035
Japan Polypropylene Packaging Films Market Size and Share Forecast Outlook 2025 to 2035
Snack Pellet Equipment Market Size and Share Forecast Outlook 2025 to 2035
Snack Packaging Machine Market Size and Share Forecast Outlook 2025 to 2035
Snack Pellets Market Analysis - Size, Share, and Forecast Outlook 2025 to 2035
Japan Probiotic Yogurt Market is segmented by product type, source type, nature type, flavor type, fat content, sales channel and key city/province through 2025 to 2035.
japan Tortilla Market - Growth, Trends and Forecast from 2025 to 2035
Japan Cosmetics ODM Market Analysis - Size, Share & Trends 2025 to 2035
Japan Automotive Turbocharger Market Insights – Demand, Size & Industry Trends 2025–2035
Japan Yeast Market Insights – Demand, Size & Industry Trends 2025–2035
Japan Green and Bio-based Polyol Market Insights – Demand, Size & Industry Trends 2025–2035

Thank you!
You will receive an email from our Business Development Manager. Please be sure to check your SPAM/JUNK folder too.
Chat With
MaRIA