Global Laundry Care Market Snapshot (2023 to 2033)

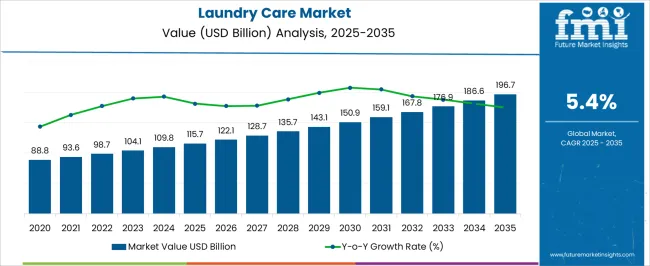
The anticipated size of the global laundry care market in 2022 was close to USD 98.2 billion. The increasing need for laundry care goods as a result of the expanding population in emerging regions is the main factor driving the expansion of the worldwide market. It is thus anticipated to have produced USD 180.3 billion by 2023, alongside a CAGR of 5.7% from 2023 to 2033.

Laundry product demand has grown internationally as a result of COVID-19, which is due to consumers' greater awareness of the significance of disinfecting and cleaning their homes as well as their clothes to protect them and their families from the new coronavirus. Rising disposable income and fast urbanization resulted in significant infrastructure improvements, which in turn increased demand for laundry care goods in the years to come.

The market for laundry care is anticipated to increase significantly in the approaching years as a result of the growing demand for environmentally friendly and ecological laundry care products. The importance of living healthier lifestyles is expected to grow, and consumer worries about their health and hygienic living-including the need for clean clothes-will increase in the years to come.

Consumer expenditure on home cleaning products, particularly laundry detergents, has been steadily increasing as a result of growing worries among people about their health and living in a sanitary, bacteria- and germ-free environment. Over the past several years, customers' preference for products with a powerful, pleasant scent has increased the importance of fragrance in household cleaning products, prompting manufacturers to differentiate their items.

The worldwide market is anticipated to be significantly impacted by increasing investments made by industry participants to introduce new organic as well as eco-friendly goods.

Report Attribute Details
Estimated Market Value (2022) USD 98.2 billion
Expected Market Value (2023) USD 103.6 billion
Projected Forecast Value (2033) USD 180.3 billion
Anticipated Growth Rate (2023 to 2033) 5.7%

Global Laundry Care Market Historical Analysis (2018 To 2022) Vs. Forecast Outlook (2023 To 2033)

According to the study, the global laundry care market is expected to register 5.7% CAGR in terms of value between 2023 and 2033. Growth in the market is attributable to the growing awareness among consumers regarding personal hygiene and surging demand for organic home care products. The outbreak of COVID-19 had a moderate impact on the laundry care market.

Sales of laundry care grew at 5.4% CAGR between 2018 and 2022. Sales uptick was reported in the laundry care market during the FQ-20 as consumers grew hyper-aware about infection and harmful effects of unhygienic clothes amidst pandemic.

With increasing awareness, the sales of organic and biodegradable detergents and fabric softeners have surged among consumers. Demand for organic laundry detergents has increased at a higher pace as synthetic laundry detergents have harmful chemicals that have hazardous effect on environment as well as on skin.

Stringent regulations were imposed on the use of certain chemicals has which compelled manufacturers to introduce plant-based laundry care products. As per International Association for Soaps, Detergents, and Maintenance Products (AISE), use of surfactants such as phosphates, strong bleach, and alkyl was prohibited in 2017.

Certain guidelines were imposed to encourage sustainability and biodegradability through eco-friendly packaging and development of phosphates-free formulations. Key manufacturers are shifting their focus towards introducing sustainable alternatives to gain competitive edge in the laundry care industry.

Launch of liquid detergent and capsules made from plant-based ingredients is expected to increase the sales of laundry detergent and fabric softeners. This, in turn, is expected to propel the growth in the market.

Against this backdrop, Future Market Insights projects the demand in the laundry care market to grow at a high rate between 2023 and 2033.

What is Primarily Driving the Global Market for Laundry Care?

Transformation in FMCG Industry Affecting Sales of Laundry Care Products

Fast-moving consumer goods (FMCG) is one of the largest sectors across the globe, aiding growth of various industries and brand. With growing disposable income and need for essential and basic necessities, sales of home care products such as laundry care, sanitizers, and soaps are increasing.

Following the outbreak of COVID-19, consumers have become hyper conscious regarding their personal hygiene. Amidst the mass hysteria due to the outbreak of this disease, sales of disinfectants, sanitizers, and laundry detergent shot up exponentially.

Key players collaborated with e-commerce giants and retail stores to expand their customer base and strengthen global presence in order to capitalize on this opportunity. While some of the leading manufacturing facilities were disrupted and top brands were struggling to sustain amid the global lockdown, numerous home-grown and local brands introduced organic laundry detergents and collaborated with online grocery and retail stores to augment sales.

With increasing penetration of social media and growing demand for sustainability, especially among millennials, sales of bio-based, organic, and eco-friendly packaged laundry care products surged.

FMCG companies are now relying on digital marketing strategies and online platforms to strengthen their footprint. For instance, Hindustan Unilever announced the launch of e-commerce website, UShop, which will scale up the online reach of several premium brands.

Laundry pod pioneer, Dropps, in August 2020, moved from retail to e-commerce to strengthen its responsiveness to consumers and advance in sustainable packaging efforts.

Innovation in Sustainable Packaging to Drive Laundry Care Products Sales?

Key players are focusing on innovative packaging of laundry care products to improve the safety and enhance sustainability. Threat of consumption by children is high as laundry care products contain certain chemicals.

Key players are focusing on innovative ways to improve the safety of laundry care products. Introduction of sustainable packaging is therefore expected to increase the sales of laundry care products.

For instance, Dropps is one of the leading laundry care products brands, which introduced plastic-free laundry detergent pods packaged in recyclable and compostable box. Brands such as Mamaearth and Ariel have introduced plant-based and safe PODs package to improve the safety of laundry care products.

Category-wise Insights

Which is the Top Selling Laundry Care Product?

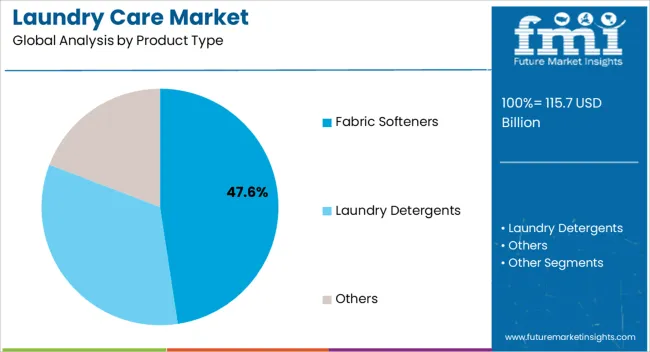
Demand for Fabric Softeners to Gain Traction during the Forecast Period

Demand for fabric softeners is expected to increase at nearly 5.6% CAGR through 2033, registering highest growth in the segment. The fabric softeners segments gained an estimated market share of 23% in 2022.

Demand for organic fabric softener is expected to grow as consumers are now becoming increasingly aware about their hygiene and quality of their clothes. Sales of fabric softener is expected to increase as fabric softener improves the quality of clothes and enhances the shelf life.

Key companies are introducing biodegradable and organic fabric softener to attract the consumers and gain competitive edge. For instance, leading textile innovator Devan Chemicals announced the launch of bio-based softener, derived from vegetable oils to support circulatory programs.

By Source, which Segment is Likely to be Popular in the Coming Years?

The Organic Segment might Spur the Global Demand

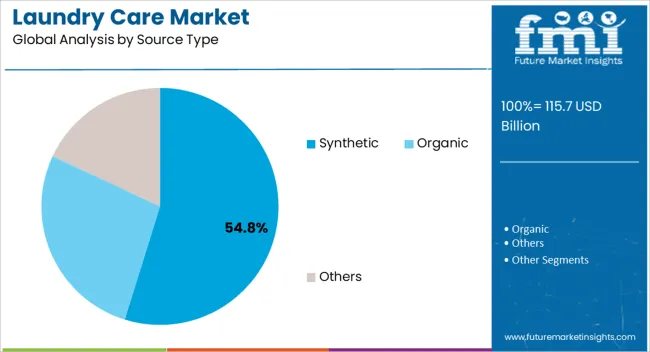
The organic source type segment is expected to reach USD 38.8 Billion, expanding at 5.5% CAGR through 2023, estimates Future Market Insights. Synthetic laundry care products contain harmful surfactants such as alkyl phenol ethoxylates, which are harmful for aquatic life and environment.

These surfactants are not biodegradable and causes high toxicity to environment and water resources. Regulatory bodies such as Environmental Protection Agency has banned the use of such chemicals.

Artificial colorants used in synthetic detergents are sometimes made from petroleum products, which are harmful for skin, as it can cause skin cancer, and they have hazardous effect on environment as well.

Consumers are opting for organic laundry care products as they are better for skin as well as environment and are also good for clothes due to such factors. Key companies are introducing organic laundry detergents that are better for clothes and are good for sensitive skin.

For instance, in September 2021, Novozymes announced the launch of natural and biodegradable detergent ingredient Pristine, to address consumer challenges such as discoloration and malodor.

Advantages such as longer shelf-life, improved efficiency of washing machine, and biodegradability are the factors favoring the growth in the segment.

Which Form of Laundry Care Products will be more in Use?

Liquid Laundry Care Products are More Preferred by the Consumers

In terms of form type, liquid form segment is expected to dominate the laundry care market. The segment is poised to expand at over 5.5% CAGR, registering an incremental opportunity of USD 58.4 Billion through 2023.

Growth in the segment is attributable to the innovation of liquid detergent and its quick effect on cleaning supported by effective results on the clothes.

The liquid detergents dissolve quickly, and are suitable for delicate fabrics as well, consumers are opting for them over powdered laundry care as liquid detergents are easy to use. Use of liquid laundry care also helps save water as powder detergent requires more water as compared to the liquid detergent.

Increasing adoption of advanced and automatic washing machine among consumers has also compelled key manufacturers to introduce liquid detergent as they are more compatible. This is also expected to drive the sales of liquid laundry care products.

For instance, leading brand Whirlpool introduced super concentrated liquid laundry detergent, Squash, in November 2020, for 83 standard washing-machine loads, making it four times concentrated than ordinary detergent for enhanced cleaning performance.

Which Distribution Channel Will Augment the Sales of Laundry Care Products?

The Dominant portion of Sales is Anticipated to be Taken Over by the E-commerce channels

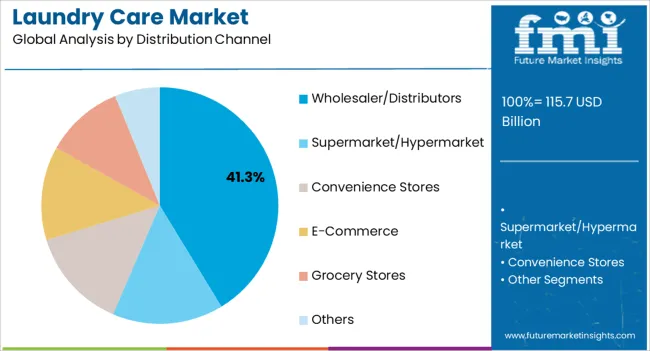
As per FMI, e-commerce segment is expected to register highest growth during the forecast period. Sales of laundry care products are expected to surge at 6% CAGR through e-commerce platforms through 2023 & beyond.

Following the outbreak of COVID-19, consumers shifted their preference towards e-commerce platforms for purchasing consumer products. Manufacturers were compelled to collaborate with e-commerce giants and promote their products through social media platforms to sustain in the competition.

Demand for home care and laundry care products surged during the FQ-20 as consumers started hoarding the goods as governments across the globe imposed global lockdown. Home care and laundry care products were considered as essential goods and wide availability of them on online channels improved the sales.

E-commerce giants such as Amazon, Flipkart, eBay, and others availed discounts and attractive offers to attract large consumer base. On the back of this, sales of laundry care products surged in 2021 and the trend is likely to continue over the coming years.

Door-step delivery, and no-contact delivery, consumers are preferring e-commerce platforms for the purchase of home care and laundry care products as these e-commerce platforms offer a plethora of features such as attractive discounts.

Region-wise Analysis

What is Supporting the India Laundry Care Market Growth?

Increasing Use of Home Care Products is Propelling the Market Growth

Home care and personal care products accounts for 50% of the sales in India, as per India Brand Equity Foundation (IBEF). Fast-moving consumer goods (FMCG) is the fourth-largest industry in India, contributing 10% to the GDP of country.

Increasing awareness regarding personal hygiene and strong presence of leading laundry care brands in the country is the primary factor propelling the growth in the market. The Indian market for laundry care products will garner a 5.8% CAGR from 2023 to 2033. Laundry care market registered moderate growth in the country with the onset of the novel COVID-19 during the FQ-20.

With emergence of e-commerce platforms and paranoia of unavailability of essential products led to resurgence in the sales of smaller packs of laundry detergents.

Some of the leading key companies such as Reckitt Benckiser and Hindustan Unilever capitalized on the gradual shift to e-commerce purchasing and launched new laundry sanitizers amid COVID-19.

A slew of such product launches have aided the growth in the market and the trend is likely to continue over the coming years. Sales of laundry care products such as detergent have burgeoned as consumers in India have become hyper-aware about the harmful effects of unhygienic clothes.

Emergence of detergent pods in the country also escalated the sales of laundry care product in India. For instance, in November 2020, Ariel, one of the leading detergent brand, announced the launch of single-use tablets called PODS, as pre-dosed washing capsules, filled with concentrate liquid.

Consumers are now more into sustainability hence key manufacturers are focusing on developing sustainable laundry care products and packaging to gain competitive edge in the industry.

What Can be Expected from the Chinese Laundry Care Market?

China Laundry Care Market to Remain Dominant in East Asia

As per Future Market Insights, Asia Pacific excluding Japan is expected to register highest growth, surpassing a valuation of USD 35.9 billion through 2023, along with a steady CAGR of 6.2% from 2023 to 2033. Growth in the region is attributed to the increasing shift of manufacturing industries to China.

China is home to one of the largest manufacturing industries in the world. Growing production of washing machine and integration of advanced technology in home care products is expected to positively impact the growth in the laundry care market.

Unprecedented outbreak of COVID-19 dampened the sales prospects as manufacturing facilities registered slight disruption. With growing consciousness among consumers regarding the safety and personal hygiene, sales of laundry care products are expected to gain traction through 2021 & beyond.

Increasing demand for organic and biodegradable detergents in the country has spurred the sales of laundry care products. Key manufacturers are investing in research and development activities to develop sustainable and innovative packaging to attract consumers.

Emergence of e-commerce platforms also is expected to increase the sales as vendors are collaborating with online retail stores to increase their revenue generation. Demand for laundry care products is expected to witness incremental opportunity on the back of these aforementioned factors.

Why is the Demand for Laundry Care Increasing across the United States?

Rising Awareness regarding Personal Care and Hygiene to Boost the Demand

According to FMI, United States is estimated to account for over 17.6% of total sales in the global laundry care market and gain 25 BPS through 2022. Growth in the region is attributed to the increasing adoption of liquid and tablet detergents in the United States.

Factors favoring the growth in the United States laundry care market include awareness regarding personal hygiene and high demand for sustainable and organic home care products. They are also now more aware regarding the hazardous effect of chemicals used in the traditional detergent on environment and skin as consumers continue to shop for laundry products. Key manufacturers are capitalizing on this existing trend and introducing sustainable and biodegradable laundry care products.

For instance, Reckitt Benckiser Group PLC, in August 2020, announced the launch of a plant-based cleansing brand, Botanical Origin, which included a range of laundry detergent and fabric softener.

Key players in the country are also focusing on attractive and sustainable packaging targeting vegan consumers to establish their brand presence. Such factors are expected to spur the sales of laundry care products in the United States over the forthcoming decade.

Market Competition

As per Future Market Insights, laundry care market is highly lucrative which is characterized by the presence of many local and international players. To gain competitive edge in the market, key players are adopting strategies such as launch of laundry care products with multi-functional features.

Some of the laundry care market players are introducing organic and natural products with eco-friendly packaging to gain competitive edge.

Meanwhile, some of the players are targeting emerging economies such as India, China, and South Korea due to the untapped opportunities present in these countries. They are also collaborating with local vendors, e-commerce platforms, and grocery stores to gain dominance in these regions and maintain the lead in the market.
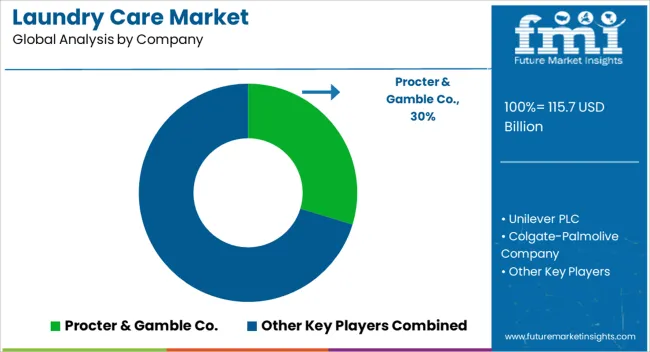
The key players in this market include

  • Procter & Gamble Co.
  • Unilever PLC
  • Colgate-Palmolive Company
  • Henkel AG & Co. KGaA
  • Reckitt Benckiser Group PLC
  • Amway Corporation
  • Kao Corporation
  • S.C. Johnson & Son Inc.
  • LG Household & Health Care Ltd
  • Golrang Industrial Group
  • Lion Corporation
  • Church & Dwight Co.
  • Alicorp S.A.A.
  • Others

Some of the products being launched by the key players are:

  • In August 2021, India-based packaged consumer goods company Godrej Consumer Products Limited (GCPL), unveiled its first digital brands of detergents for laundry and dishwashing. These products can be purchased only via e-commerce platforms as the company hopes to capitalize on the growing shift of packaged consumer goods to e-commerce.
  • In June 2021, London - Unilever announced the launch of world’s first paper-based laundry detergent bottle. The company is using new technology to develop its prototype, which has been developed for a leading laundry brand OMO (Persil, Skip and Breeze), made up of sustainable-pulp and designed to be recycled in the paper waste stream. This is set to launch in Brazil in 2022 and rest of Europe as the world’s first eco-friendly advanced technology laundry packaging.
  • In 2021, Procter & Gamble Company along with the National Aeronautics Space organization (NASA), an independent U.S. governmental organization in charge of the civilian space scheme, aeronautics research, as well as space research, partnered with Procter & Gamble. Procter & Gamble participated in the partnership and assisted in making it easier to wash garments aboard the International Space Station (ISS). Both groups also intended to create a detergent that could clean garments completely without using water.
  • Henkel planned to merge its Laundry & Home Care as well as Beauty Care divisions in 2022 to form Henkel Consumer Brands. The firm will start getting ready as soon as feasible for the merger process, with the intention of having the new structure in place by the start of 2023. With the launch of the new business unit, Henkel will build a multi-category growth platform and combine its consumer brands, companies, and the hair professional firm under one roof. Notable examples of these brands include Persil as well as Schwarzkopf.

Report Scope

Report Attribute Details
Growth Rate CAGR of 5.7% from 2022 to 2032
Market value in 2023 USD 103.6 billion
Market value in 2033 USD 180.3 billion
Base Year for Estimation 2022
Historical Data 2018 to 2022
Forecast Period 2023 to 2033
Quantitative Units USD billion for value
Report Coverage Revenue Forecast, Volume Forecast, Company Ranking, Competitive Landscape, Growth Factors, Trends, and Pricing Analysis
Segments Covered Product Type, Source Type, Form Type, Distribution Channel, Region
Regions Covered North America; Latin America; Europe; Asia Pacific; Middle East and Africa
Key Countries Profiled United States, Canada, Mexico, Brazil, Germany, United Kingdom, France, Spain, Italy, Japan, China, Singapore, Thailand, Indonesia, Israel, GCC countries, South Africa, Australia, New Zealand
Key Companies Profiled Procter & Gamble Co.; Unilever PLC; Colgate-Palmolive Company; Henkel AG & Co. KGaA; Reckitt Benckiser Group PLC; Amway Corporation; Kao Corporation; S.C. Johnson & Son Inc.; LG Household & Health Care Ltd; Golrang Industrial Group; Lion Corporation; Church & Dwight Co.; Alicorp S.A.A.
Customization & Pricing Available on Request

Key Segments Profiled in the Global Laundry Care Market

Product Type:

  • Fabric Softeners
  • Laundry Detergents
  • Others

Distribution Channel:

  • Wholesaler/Distributors
  • Supermarket/Hypermarket
  • Convenience Stores
  • E-Commerce
  • Grocery Stores
  • Others

Source Type:

  • Synthetic
  • Organic
  • Others

Form Type:

  • Powder
  • Cake/Block
  • Liquid
  • Others

By Region:

  • North America
  • Latin America
  • Europe
  • Asia Pacific
  • Middle East and Africa

Table of Content

  • 1. Executive Summary
  • 2. Market Overview
  • 3. Market Background
  • 4. Global Market Analysis 2018 to 2022 and Forecast, 2023 to 2033
  • 5. Global Market Analysis 2018 to 2022 and Forecast 2023 to 2033, By Type
    • 5.1. Fabric Softeners
    • 5.2. Laundry Detergents
    • 5.3. Others
  • 6. Global Market Analysis 2018 to 2022 and Forecast 2023 to 2033, By Channel
    • 6.1. Wholesaler/Distributors
    • 6.2. Supermarket/Hypermarket
    • 6.3. Convenience Stores
    • 6.4. E-Commerce
    • 6.5. Grocery Stores
    • 6.6. Others
  • 7. Global Market Analysis 2018 to 2022 and Forecast 2023 to 2033, By Source Type
    • 7.1. Synthetic
    • 7.2. Organic
    • 7.3. Others
  • 8. Global Market Analysis 2018 to 2022 and Forecast 2023 to 2033, By Form Type
    • 8.1. Powder
    • 8.2. Cake/Block
    • 8.3. Liquid
    • 8.4. Others
  • 9. Global Market Analysis 2018 to 2022 and Forecast 2023 to 2033, By Region
    • 9.1. North America
    • 9.2. Latin America
    • 9.3. Europe
    • 9.4. Asia Pacific
    • 9.5. MEA
  • 10. North America Market Analysis 2018 to 2022 and Forecast 2023 to 2033, By Country
  • 11. Latin America Market Analysis 2018 to 2022 and Forecast 2023 to 2033, By Country
  • 12. Europe Market Analysis 2018 to 2022 and Forecast 2023 to 2033, By Country
  • 13. Asia Pacific Market Analysis 2018 to 2022 and Forecast 2023 to 2033, By Country
  • 14. MEA Market Analysis 2018 to 2022 and Forecast 2023 to 2033, By Country
  • 15. Key Countries Market Analysis
  • 16. Market Structure Analysis
  • 17. Competition Analysis
    • 17.1. Procter & Gamble Co.
    • 17.2. Unilever PLC
    • 17.3. Colgate-Palmolive Company
    • 17.4. Henkel AG & Co. KGaA
    • 17.5. Reckitt Benckiser Group PLC
    • 17.6. Amway Corporation
    • 17.7. Kao Corporation
    • 17.8. S.C. Johnson & Son Inc.
    • 17.9. LG Household & Health Care Ltd
    • 17.10. Golrang Industrial Group
    • 17.11. Lion Corporation
    • 17.12. Church & Dwight Co.
    • 17.13. Alicorp S.A.A.
  • 18. Assumptions & Acronyms Used
  • 19. Research Methodology

List of Tables

Table 1: Global Market Value (US$ Million) Forecast by Region, 2018 to 2033

Table 2: Global Market Volume (Units) Forecast by Region, 2018 to 2033

Table 3: Global Market Value (US$ Million) Forecast by Type, 2018 to 2033

Table 4: Global Market Volume (Units) Forecast by Type, 2018 to 2033

Table 5: Global Market Value (US$ Million) Forecast by Channel, 2018 to 2033

Table 6: Global Market Volume (Units) Forecast by Channel, 2018 to 2033

Table 7: Global Market Value (US$ Million) Forecast by Source Type, 2018 to 2033

Table 8: Global Market Volume (Units) Forecast by Source Type, 2018 to 2033

Table 9: Global Market Value (US$ Million) Forecast by Form Type, 2018 to 2033

Table 10: Global Market Volume (Units) Forecast by Form Type, 2018 to 2033

Table 11: North America Market Value (US$ Million) Forecast by Country, 2018 to 2033

Table 12: North America Market Volume (Units) Forecast by Country, 2018 to 2033

Table 13: North America Market Value (US$ Million) Forecast by Type, 2018 to 2033

Table 14: North America Market Volume (Units) Forecast by Type, 2018 to 2033

Table 15: North America Market Value (US$ Million) Forecast by Channel, 2018 to 2033

Table 16: North America Market Volume (Units) Forecast by Channel, 2018 to 2033

Table 17: North America Market Value (US$ Million) Forecast by Source Type, 2018 to 2033

Table 18: North America Market Volume (Units) Forecast by Source Type, 2018 to 2033

Table 19: North America Market Value (US$ Million) Forecast by Form Type, 2018 to 2033

Table 20: North America Market Volume (Units) Forecast by Form Type, 2018 to 2033

Table 21: Latin America Market Value (US$ Million) Forecast by Country, 2018 to 2033

Table 22: Latin America Market Volume (Units) Forecast by Country, 2018 to 2033

Table 23: Latin America Market Value (US$ Million) Forecast by Type, 2018 to 2033

Table 24: Latin America Market Volume (Units) Forecast by Type, 2018 to 2033

Table 25: Latin America Market Value (US$ Million) Forecast by Channel, 2018 to 2033

Table 26: Latin America Market Volume (Units) Forecast by Channel, 2018 to 2033

Table 27: Latin America Market Value (US$ Million) Forecast by Source Type, 2018 to 2033

Table 28: Latin America Market Volume (Units) Forecast by Source Type, 2018 to 2033

Table 29: Latin America Market Value (US$ Million) Forecast by Form Type, 2018 to 2033

Table 30: Latin America Market Volume (Units) Forecast by Form Type, 2018 to 2033

Table 31: Europe Market Value (US$ Million) Forecast by Country, 2018 to 2033

Table 32: Europe Market Volume (Units) Forecast by Country, 2018 to 2033

Table 33: Europe Market Value (US$ Million) Forecast by Type, 2018 to 2033

Table 34: Europe Market Volume (Units) Forecast by Type, 2018 to 2033

Table 35: Europe Market Value (US$ Million) Forecast by Channel, 2018 to 2033

Table 36: Europe Market Volume (Units) Forecast by Channel, 2018 to 2033

Table 37: Europe Market Value (US$ Million) Forecast by Source Type, 2018 to 2033

Table 38: Europe Market Volume (Units) Forecast by Source Type, 2018 to 2033

Table 39: Europe Market Value (US$ Million) Forecast by Form Type, 2018 to 2033

Table 40: Europe Market Volume (Units) Forecast by Form Type, 2018 to 2033

Table 41: Asia Pacific Market Value (US$ Million) Forecast by Country, 2018 to 2033

Table 42: Asia Pacific Market Volume (Units) Forecast by Country, 2018 to 2033

Table 43: Asia Pacific Market Value (US$ Million) Forecast by Type, 2018 to 2033

Table 44: Asia Pacific Market Volume (Units) Forecast by Type, 2018 to 2033

Table 45: Asia Pacific Market Value (US$ Million) Forecast by Channel, 2018 to 2033

Table 46: Asia Pacific Market Volume (Units) Forecast by Channel, 2018 to 2033

Table 47: Asia Pacific Market Value (US$ Million) Forecast by Source Type, 2018 to 2033

Table 48: Asia Pacific Market Volume (Units) Forecast by Source Type, 2018 to 2033

Table 49: Asia Pacific Market Value (US$ Million) Forecast by Form Type, 2018 to 2033

Table 50: Asia Pacific Market Volume (Units) Forecast by Form Type, 2018 to 2033

Table 51: MEA Market Value (US$ Million) Forecast by Country, 2018 to 2033

Table 52: MEA Market Volume (Units) Forecast by Country, 2018 to 2033

Table 53: MEA Market Value (US$ Million) Forecast by Type, 2018 to 2033

Table 54: MEA Market Volume (Units) Forecast by Type, 2018 to 2033

Table 55: MEA Market Value (US$ Million) Forecast by Channel, 2018 to 2033

Table 56: MEA Market Volume (Units) Forecast by Channel, 2018 to 2033

Table 57: MEA Market Value (US$ Million) Forecast by Source Type, 2018 to 2033

Table 58: MEA Market Volume (Units) Forecast by Source Type, 2018 to 2033

Table 59: MEA Market Value (US$ Million) Forecast by Form Type, 2018 to 2033

Table 60: MEA Market Volume (Units) Forecast by Form Type, 2018 to 2033

List of Figures

Figure 1: Global Market Value (US$ Million) by Type, 2023 to 2033

Figure 2: Global Market Value (US$ Million) by Channel, 2023 to 2033

Figure 3: Global Market Value (US$ Million) by Source Type, 2023 to 2033

Figure 4: Global Market Value (US$ Million) by Form Type, 2023 to 2033

Figure 5: Global Market Value (US$ Million) by Region, 2023 to 2033

Figure 6: Global Market Value (US$ Million) Analysis by Region, 2018 to 2033

Figure 7: Global Market Volume (Units) Analysis by Region, 2018 to 2033

Figure 8: Global Market Value Share (%) and BPS Analysis by Region, 2023 to 2033

Figure 9: Global Market Y-o-Y Growth (%) Projections by Region, 2023 to 2033

Figure 10: Global Market Value (US$ Million) Analysis by Type, 2018 to 2033

Figure 11: Global Market Volume (Units) Analysis by Type, 2018 to 2033

Figure 12: Global Market Value Share (%) and BPS Analysis by Type, 2023 to 2033

Figure 13: Global Market Y-o-Y Growth (%) Projections by Type, 2023 to 2033

Figure 14: Global Market Value (US$ Million) Analysis by Channel, 2018 to 2033

Figure 15: Global Market Volume (Units) Analysis by Channel, 2018 to 2033

Figure 16: Global Market Value Share (%) and BPS Analysis by Channel, 2023 to 2033

Figure 17: Global Market Y-o-Y Growth (%) Projections by Channel, 2023 to 2033

Figure 18: Global Market Value (US$ Million) Analysis by Source Type, 2018 to 2033

Figure 19: Global Market Volume (Units) Analysis by Source Type, 2018 to 2033

Figure 20: Global Market Value Share (%) and BPS Analysis by Source Type, 2023 to 2033

Figure 21: Global Market Y-o-Y Growth (%) Projections by Source Type, 2023 to 2033

Figure 22: Global Market Value (US$ Million) Analysis by Form Type, 2018 to 2033

Figure 23: Global Market Volume (Units) Analysis by Form Type, 2018 to 2033

Figure 24: Global Market Value Share (%) and BPS Analysis by Form Type, 2023 to 2033

Figure 25: Global Market Y-o-Y Growth (%) Projections by Form Type, 2023 to 2033

Figure 26: Global Market Attractiveness by Type, 2023 to 2033

Figure 27: Global Market Attractiveness by Channel, 2023 to 2033

Figure 28: Global Market Attractiveness by Source Type, 2023 to 2033

Figure 29: Global Market Attractiveness by Form Type, 2023 to 2033

Figure 30: Global Market Attractiveness by Region, 2023 to 2033

Figure 31: North America Market Value (US$ Million) by Type, 2023 to 2033

Figure 32: North America Market Value (US$ Million) by Channel, 2023 to 2033

Figure 33: North America Market Value (US$ Million) by Source Type, 2023 to 2033

Figure 34: North America Market Value (US$ Million) by Form Type, 2023 to 2033

Figure 35: North America Market Value (US$ Million) by Country, 2023 to 2033

Figure 36: North America Market Value (US$ Million) Analysis by Country, 2018 to 2033

Figure 37: North America Market Volume (Units) Analysis by Country, 2018 to 2033

Figure 38: North America Market Value Share (%) and BPS Analysis by Country, 2023 to 2033

Figure 39: North America Market Y-o-Y Growth (%) Projections by Country, 2023 to 2033

Figure 40: North America Market Value (US$ Million) Analysis by Type, 2018 to 2033

Figure 41: North America Market Volume (Units) Analysis by Type, 2018 to 2033

Figure 42: North America Market Value Share (%) and BPS Analysis by Type, 2023 to 2033

Figure 43: North America Market Y-o-Y Growth (%) Projections by Type, 2023 to 2033

Figure 44: North America Market Value (US$ Million) Analysis by Channel, 2018 to 2033

Figure 45: North America Market Volume (Units) Analysis by Channel, 2018 to 2033

Figure 46: North America Market Value Share (%) and BPS Analysis by Channel, 2023 to 2033

Figure 47: North America Market Y-o-Y Growth (%) Projections by Channel, 2023 to 2033

Figure 48: North America Market Value (US$ Million) Analysis by Source Type, 2018 to 2033

Figure 49: North America Market Volume (Units) Analysis by Source Type, 2018 to 2033

Figure 50: North America Market Value Share (%) and BPS Analysis by Source Type, 2023 to 2033

Figure 51: North America Market Y-o-Y Growth (%) Projections by Source Type, 2023 to 2033

Figure 52: North America Market Value (US$ Million) Analysis by Form Type, 2018 to 2033

Figure 53: North America Market Volume (Units) Analysis by Form Type, 2018 to 2033

Figure 54: North America Market Value Share (%) and BPS Analysis by Form Type, 2023 to 2033

Figure 55: North America Market Y-o-Y Growth (%) Projections by Form Type, 2023 to 2033

Figure 56: North America Market Attractiveness by Type, 2023 to 2033

Figure 57: North America Market Attractiveness by Channel, 2023 to 2033

Figure 58: North America Market Attractiveness by Source Type, 2023 to 2033

Figure 59: North America Market Attractiveness by Form Type, 2023 to 2033

Figure 60: North America Market Attractiveness by Country, 2023 to 2033

Figure 61: Latin America Market Value (US$ Million) by Type, 2023 to 2033

Figure 62: Latin America Market Value (US$ Million) by Channel, 2023 to 2033

Figure 63: Latin America Market Value (US$ Million) by Source Type, 2023 to 2033

Figure 64: Latin America Market Value (US$ Million) by Form Type, 2023 to 2033

Figure 65: Latin America Market Value (US$ Million) by Country, 2023 to 2033

Figure 66: Latin America Market Value (US$ Million) Analysis by Country, 2018 to 2033

Figure 67: Latin America Market Volume (Units) Analysis by Country, 2018 to 2033

Figure 68: Latin America Market Value Share (%) and BPS Analysis by Country, 2023 to 2033

Figure 69: Latin America Market Y-o-Y Growth (%) Projections by Country, 2023 to 2033

Figure 70: Latin America Market Value (US$ Million) Analysis by Type, 2018 to 2033

Figure 71: Latin America Market Volume (Units) Analysis by Type, 2018 to 2033

Figure 72: Latin America Market Value Share (%) and BPS Analysis by Type, 2023 to 2033

Figure 73: Latin America Market Y-o-Y Growth (%) Projections by Type, 2023 to 2033

Figure 74: Latin America Market Value (US$ Million) Analysis by Channel, 2018 to 2033

Figure 75: Latin America Market Volume (Units) Analysis by Channel, 2018 to 2033

Figure 76: Latin America Market Value Share (%) and BPS Analysis by Channel, 2023 to 2033

Figure 77: Latin America Market Y-o-Y Growth (%) Projections by Channel, 2023 to 2033

Figure 78: Latin America Market Value (US$ Million) Analysis by Source Type, 2018 to 2033

Figure 79: Latin America Market Volume (Units) Analysis by Source Type, 2018 to 2033

Figure 80: Latin America Market Value Share (%) and BPS Analysis by Source Type, 2023 to 2033

Figure 81: Latin America Market Y-o-Y Growth (%) Projections by Source Type, 2023 to 2033

Figure 82: Latin America Market Value (US$ Million) Analysis by Form Type, 2018 to 2033

Figure 83: Latin America Market Volume (Units) Analysis by Form Type, 2018 to 2033

Figure 84: Latin America Market Value Share (%) and BPS Analysis by Form Type, 2023 to 2033

Figure 85: Latin America Market Y-o-Y Growth (%) Projections by Form Type, 2023 to 2033

Figure 86: Latin America Market Attractiveness by Type, 2023 to 2033

Figure 87: Latin America Market Attractiveness by Channel, 2023 to 2033

Figure 88: Latin America Market Attractiveness by Source Type, 2023 to 2033

Figure 89: Latin America Market Attractiveness by Form Type, 2023 to 2033

Figure 90: Latin America Market Attractiveness by Country, 2023 to 2033

Figure 91: Europe Market Value (US$ Million) by Type, 2023 to 2033

Figure 92: Europe Market Value (US$ Million) by Channel, 2023 to 2033

Figure 93: Europe Market Value (US$ Million) by Source Type, 2023 to 2033

Figure 94: Europe Market Value (US$ Million) by Form Type, 2023 to 2033

Figure 95: Europe Market Value (US$ Million) by Country, 2023 to 2033

Figure 96: Europe Market Value (US$ Million) Analysis by Country, 2018 to 2033

Figure 97: Europe Market Volume (Units) Analysis by Country, 2018 to 2033

Figure 98: Europe Market Value Share (%) and BPS Analysis by Country, 2023 to 2033

Figure 99: Europe Market Y-o-Y Growth (%) Projections by Country, 2023 to 2033

Figure 100: Europe Market Value (US$ Million) Analysis by Type, 2018 to 2033

Figure 101: Europe Market Volume (Units) Analysis by Type, 2018 to 2033

Figure 102: Europe Market Value Share (%) and BPS Analysis by Type, 2023 to 2033

Figure 103: Europe Market Y-o-Y Growth (%) Projections by Type, 2023 to 2033

Figure 104: Europe Market Value (US$ Million) Analysis by Channel, 2018 to 2033

Figure 105: Europe Market Volume (Units) Analysis by Channel, 2018 to 2033

Figure 106: Europe Market Value Share (%) and BPS Analysis by Channel, 2023 to 2033

Figure 107: Europe Market Y-o-Y Growth (%) Projections by Channel, 2023 to 2033

Figure 108: Europe Market Value (US$ Million) Analysis by Source Type, 2018 to 2033

Figure 109: Europe Market Volume (Units) Analysis by Source Type, 2018 to 2033

Figure 110: Europe Market Value Share (%) and BPS Analysis by Source Type, 2023 to 2033

Figure 111: Europe Market Y-o-Y Growth (%) Projections by Source Type, 2023 to 2033

Figure 112: Europe Market Value (US$ Million) Analysis by Form Type, 2018 to 2033

Figure 113: Europe Market Volume (Units) Analysis by Form Type, 2018 to 2033

Figure 114: Europe Market Value Share (%) and BPS Analysis by Form Type, 2023 to 2033

Figure 115: Europe Market Y-o-Y Growth (%) Projections by Form Type, 2023 to 2033

Figure 116: Europe Market Attractiveness by Type, 2023 to 2033

Figure 117: Europe Market Attractiveness by Channel, 2023 to 2033

Figure 118: Europe Market Attractiveness by Source Type, 2023 to 2033

Figure 119: Europe Market Attractiveness by Form Type, 2023 to 2033

Figure 120: Europe Market Attractiveness by Country, 2023 to 2033

Figure 121: Asia Pacific Market Value (US$ Million) by Type, 2023 to 2033

Figure 122: Asia Pacific Market Value (US$ Million) by Channel, 2023 to 2033

Figure 123: Asia Pacific Market Value (US$ Million) by Source Type, 2023 to 2033

Figure 124: Asia Pacific Market Value (US$ Million) by Form Type, 2023 to 2033

Figure 125: Asia Pacific Market Value (US$ Million) by Country, 2023 to 2033

Figure 126: Asia Pacific Market Value (US$ Million) Analysis by Country, 2018 to 2033

Figure 127: Asia Pacific Market Volume (Units) Analysis by Country, 2018 to 2033

Figure 128: Asia Pacific Market Value Share (%) and BPS Analysis by Country, 2023 to 2033

Figure 129: Asia Pacific Market Y-o-Y Growth (%) Projections by Country, 2023 to 2033

Figure 130: Asia Pacific Market Value (US$ Million) Analysis by Type, 2018 to 2033

Figure 131: Asia Pacific Market Volume (Units) Analysis by Type, 2018 to 2033

Figure 132: Asia Pacific Market Value Share (%) and BPS Analysis by Type, 2023 to 2033

Figure 133: Asia Pacific Market Y-o-Y Growth (%) Projections by Type, 2023 to 2033

Figure 134: Asia Pacific Market Value (US$ Million) Analysis by Channel, 2018 to 2033

Figure 135: Asia Pacific Market Volume (Units) Analysis by Channel, 2018 to 2033

Figure 136: Asia Pacific Market Value Share (%) and BPS Analysis by Channel, 2023 to 2033

Figure 137: Asia Pacific Market Y-o-Y Growth (%) Projections by Channel, 2023 to 2033

Figure 138: Asia Pacific Market Value (US$ Million) Analysis by Source Type, 2018 to 2033

Figure 139: Asia Pacific Market Volume (Units) Analysis by Source Type, 2018 to 2033

Figure 140: Asia Pacific Market Value Share (%) and BPS Analysis by Source Type, 2023 to 2033

Figure 141: Asia Pacific Market Y-o-Y Growth (%) Projections by Source Type, 2023 to 2033

Figure 142: Asia Pacific Market Value (US$ Million) Analysis by Form Type, 2018 to 2033

Figure 143: Asia Pacific Market Volume (Units) Analysis by Form Type, 2018 to 2033

Figure 144: Asia Pacific Market Value Share (%) and BPS Analysis by Form Type, 2023 to 2033

Figure 145: Asia Pacific Market Y-o-Y Growth (%) Projections by Form Type, 2023 to 2033

Figure 146: Asia Pacific Market Attractiveness by Type, 2023 to 2033

Figure 147: Asia Pacific Market Attractiveness by Channel, 2023 to 2033

Figure 148: Asia Pacific Market Attractiveness by Source Type, 2023 to 2033

Figure 149: Asia Pacific Market Attractiveness by Form Type, 2023 to 2033

Figure 150: Asia Pacific Market Attractiveness by Country, 2023 to 2033

Figure 151: MEA Market Value (US$ Million) by Type, 2023 to 2033

Figure 152: MEA Market Value (US$ Million) by Channel, 2023 to 2033

Figure 153: MEA Market Value (US$ Million) by Source Type, 2023 to 2033

Figure 154: MEA Market Value (US$ Million) by Form Type, 2023 to 2033

Figure 155: MEA Market Value (US$ Million) by Country, 2023 to 2033

Figure 156: MEA Market Value (US$ Million) Analysis by Country, 2018 to 2033

Figure 157: MEA Market Volume (Units) Analysis by Country, 2018 to 2033

Figure 158: MEA Market Value Share (%) and BPS Analysis by Country, 2023 to 2033

Figure 159: MEA Market Y-o-Y Growth (%) Projections by Country, 2023 to 2033

Figure 160: MEA Market Value (US$ Million) Analysis by Type, 2018 to 2033

Figure 161: MEA Market Volume (Units) Analysis by Type, 2018 to 2033

Figure 162: MEA Market Value Share (%) and BPS Analysis by Type, 2023 to 2033

Figure 163: MEA Market Y-o-Y Growth (%) Projections by Type, 2023 to 2033

Figure 164: MEA Market Value (US$ Million) Analysis by Channel, 2018 to 2033

Figure 165: MEA Market Volume (Units) Analysis by Channel, 2018 to 2033

Figure 166: MEA Market Value Share (%) and BPS Analysis by Channel, 2023 to 2033

Figure 167: MEA Market Y-o-Y Growth (%) Projections by Channel, 2023 to 2033

Figure 168: MEA Market Value (US$ Million) Analysis by Source Type, 2018 to 2033

Figure 169: MEA Market Volume (Units) Analysis by Source Type, 2018 to 2033

Figure 170: MEA Market Value Share (%) and BPS Analysis by Source Type, 2023 to 2033

Figure 171: MEA Market Y-o-Y Growth (%) Projections by Source Type, 2023 to 2033

Figure 172: MEA Market Value (US$ Million) Analysis by Form Type, 2018 to 2033

Figure 173: MEA Market Volume (Units) Analysis by Form Type, 2018 to 2033

Figure 174: MEA Market Value Share (%) and BPS Analysis by Form Type, 2023 to 2033

Figure 175: MEA Market Y-o-Y Growth (%) Projections by Form Type, 2023 to 2033

Figure 176: MEA Market Attractiveness by Type, 2023 to 2033

Figure 177: MEA Market Attractiveness by Channel, 2023 to 2033

Figure 178: MEA Market Attractiveness by Source Type, 2023 to 2033

Figure 179: MEA Market Attractiveness by Form Type, 2023 to 2033

Figure 180: MEA Market Attractiveness by Country, 2023 to 2033

Frequently Asked Questions

What is the Expected Value of the Worldwide Laundry Care Industry in 2023?

The worldwide laundry care industry is valued at USD 103.6 billion until 2023.

What is the Expected CAGR for the Market from 2023 to 2033?

The worldwide laundry care market’s CAGR from 2023 to 2033 will be 5.7%.

What is the Market Value of the Worldwide Laundry Care Market?

Laundry care market is expected to reach a value pool of USD 180.3 billion by the end of 2033.

What was the Market Share of United States’ Laundry Care market in 2022?

United States’ laundry care market generated a market share of 17.6% through 2022.

Which is the Key Segment by Product Type in the Laundry Care Market?

The fabric softeners segment may remain preferred in the market through 2033.

Explore Fast-Moving Consumer Goods (FMCG) Insights

Future Market Insights

Laundry Care Market