LC Dust Shutter Adapters Market Forecast and Outlook (2025-2035)

The global LC dust shutter adapters market is likely to expand steadily over the next decade, with a CAGR of 5.3%. In 2025, the market is valued at USD 158.6 million and is expected to reach USD 265.8 million by 2035, representing an absolute increase of USD 107.2 million. The growth is driven by increasing deployment of high-speed fiber optic networks, rising demand for efficient data transmission, and the need to protect fiber optic connectors from dust and contamination. LC dust shutter adapters enhance network reliability by preventing dust particles from compromising signal quality, making them essential components in telecommunications, data centers, and enterprise network infrastructures.
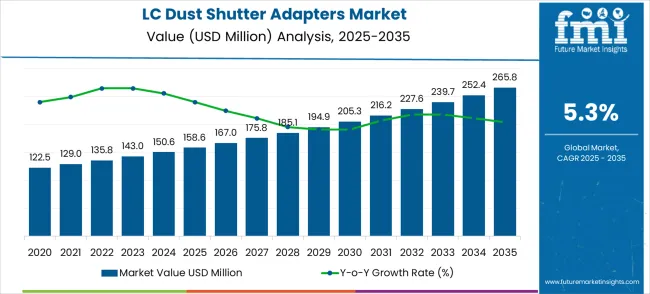
Quick Stats for LC Dust Shutter Adapters Market

  • LC Dust Shutter Adapters Market Value (2025): USD 158.6 million
  • LC Dust Shutter Adapters Market Forecast Value (2035): USD 265.8 million
  • LC Dust Shutter Adapters Market Forecast CAGR: 5.3%
  • Leading Application in LC Dust Shutter Adapters Market: Telecommunication Network (30%)
  • Key Growth Regions in LC Dust Shutter Adapters Market: Asia Pacific, North America, and Europe
  • Key Players in LC Dust Shutter Adapters Market: SENKO Advanced Components, Optcore, Molex, Fibertronics, L-com

Lc Dust Shutter Adapters Market Market Value Analysis

The market’s expansion reflects a shift toward maintaining high network performance and minimizing operational disruptions through protective solutions. Advancements in connector technology, improved durability of dust shutters, and growing investments in fiber optic infrastructure are expected to further support market growth. Regions with rapid digitalization and increasing internet penetration are likely to witness higher adoption rates of LC dust shutter adapters, as operators seek to maintain network integrity and reduce maintenance costs. The market demonstrates a consistent growth trajectory, with absolute gains highlighting long-term potential for manufacturers and suppliers.

LC Dust Shutter Adapters Market Key Takeaways

Metric Value
Estimated Value in (2025E) USD 158.6 million
Forecast Value in (2035F) USD 265.8 million
Forecast CAGR (2025 to 2035) 5.3%

The LC dust shutter adapters market is influenced by several parent markets, each contributing differently to its development. The fiber optic components market holds the largest influence at around 40%, supplying advanced connectors and related accessories. The telecommunications equipment market contributes approximately 25%, driving demand for reliable fiber optic solutions. The data center infrastructure market accounts for 20%, emphasizing the need for efficient and clean connectivity solutions. The networking and IT hardware market adds 10%, supporting the adoption of fiber optic technologies in various applications.

The market is experiencing transformative trends. Manufacturers are integrating features such as IP5X-rated dust protection, hands-free shutter mechanisms, and compliance with IEC TR 62627-08 standards to ensure optimal functionality in demanding environments. Companies like Senko Advanced Components are leading the way by introducing integral hands-free shutter mechanisms that protect connectors from dust contamination when ports are not in use.

Opportunity Pathways - LC Dust Shutter Adapters Market

The LC dust shutter adapters market represents a specialized but rapidly expanding segment within fiber optic connectivity, driven by exponential data center growth, 5G network deployment, and increasing demand for contamination-resistant optical solutions. With the global market growing from USD 158.6 million in 2025 to USD 265.8 million by 2035 at a robust 5.3% CAGR, strategic opportunities emerge through high-density data center solutions, advanced contamination protection, and geographic expansion in telecommunications-intensive regions. Data centers commanding USD 39.7 million in 2025, single-mode dominance, and China's exceptional 7.2% growth rate underscore the critical role of reliable optical connectivity in modern digital infrastructure.

The market's evolution from basic connectivity protection toward sophisticated contamination prevention and high-density applications creates multiple differentiation pathways. Rising awareness on network reliability, signal integrity, and operational efficiency in mission-critical environments positions LC dust shutter adapters as essential components for next-generation telecommunications and computing infrastructure.

  • Pathway A - High-Density Data Center Optimization. Data centers' USD 39.7 million market share reflects growing demand for space-efficient, high-port-density connectivity solutions. Companies developing ultra-high-density adapter panels, automated patching systems, and integrated cable management can capture premium pricing in hyperscale environments. Advanced solutions offering 144+ port densities per rack unit command 40-60% premiums over standard configurations. Expected revenue pool: USD 80-120 million by 2035.
  • Pathway B - Advanced Contamination Protection Technologies. Enhanced dust shutter mechanisms, self-cleaning optical interfaces, and hermetically sealed designs address critical network reliability demands. Manufacturers incorporating advanced materials, precision engineering, and automated contamination detection can target mission-critical applications with 25-35% price premiums. Revenue opportunity: USD 45-70 million.
  • Pathway C - Geographic Expansion in High-Growth Markets. China's 7.2% CAGR and India's 6.6% growth, driven by 5G deployment and digital transformation, present significant localization opportunities. Establishing regional manufacturing, local partnerships, and compliance with telecommunications standards can capture rapid infrastructure expansion while reducing supply chain costs. Market potential: USD 90-140 million.
  • Pathway D - Single-Mode Performance Enhancement. Single-mode segment leadership reflects long-distance, high-bandwidth application demands. Developing low-loss optical interfaces, enhanced signal integrity features, and extended distance capabilities for 400G+ networks can command premium pricing in carrier and enterprise markets. Revenue pool: USD 60-90 million.
  • Pathway E - 5G Network Infrastructure Solutions. Expanding 5G deployment creates demand for specialized adapters supporting small cell backhaul, edge computing connectivity, and high-frequency optical links. Custom solutions for outdoor environments, temperature extremes, and rapid deployment can access telecommunications infrastructure budgets with higher margins. Expected uplift: USD 35-55 million.
  • Pathway F - Automation & Smart Manufacturing. Incorporating automated assembly, quality verification systems, and real-time contamination monitoring reduces manufacturing costs while improving product consistency. Advanced manufacturing capabilities enable competitive pricing and rapid scaling for high-volume applications. Cost reduction opportunity: USD 25-40 million in margin improvement.
  • Pathway G - Medical & Industrial Specialization. Medical equipment and industrial applications demand specialized contamination protection and regulatory compliance. Developing FDA-compliant, industrial-grade adapters with enhanced environmental sealing can access higher-margin specialized markets beyond traditional telecommunications. Market opportunity: USD 20-35 million.
  • Pathway H - Edge Computing & IoT Connectivity. Growing edge computing infrastructure requires compact, reliable optical connectivity for distributed computing nodes. Miniaturized adapters with enhanced environmental protection and simplified installation can capture emerging edge deployment opportunities. Revenue potential: USD 30-45 million.

Why is the LC Dust Shutter Adapters Market Growing?

Market expansion is being supported by the increasing global demand for high-performance fiber optic connectivity and the corresponding need for contamination-resistant optical components that can maintain signal quality while providing reliable connection protection across various network applications. Modern telecommunications providers and data center operators are increasingly focused on implementing connectivity solutions that can reduce network downtime, minimize signal degradation, and provide consistent optical performance in challenging environmental conditions. LC dust shutter adapters' proven ability to deliver contamination protection, enhanced signal integrity, and operational reliability make them essential components for contemporary fiber optic network infrastructure and high-speed data transmission applications.

Network operators' preference for components that combine contamination protection with operational efficiency and cost-effectiveness is creating opportunities for innovative adapter implementations. The rising influence of cloud computing and edge networking demands is also contributing to increased adoption of LC dust shutter adapters that can provide reliable optical connections without compromising network performance or operational flexibility.

Analyzing LC Dust Shutter Adapters Market by Top Investment Segments

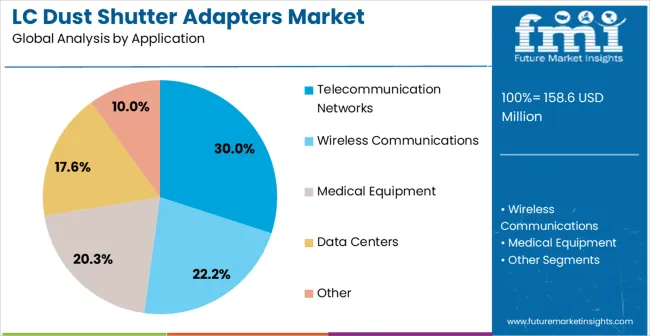
The LC dust shutter adapters market is expanding steadily, driven by rising demand for secure and reliable fiber optic connections across high-speed networks and critical infrastructure. Single-mode adapters dominate the optical mode segment with a 60% share, while multimode adapters account for 40%. Telecommunication networks are the largest application segment at 30%, followed by data centers at 25%, wireless communications at 20%, medical equipment at 15%, and others at 10%. These segments offer the highest investment potential, reflecting consistent adoption in network infrastructure, enterprise connectivity, and medical applications. Increasing demand for dust protection, precise fiber alignment, and minimal signal loss is driving the market, alongside the expansion of global telecommunication networks and high-capacity fiber systems.
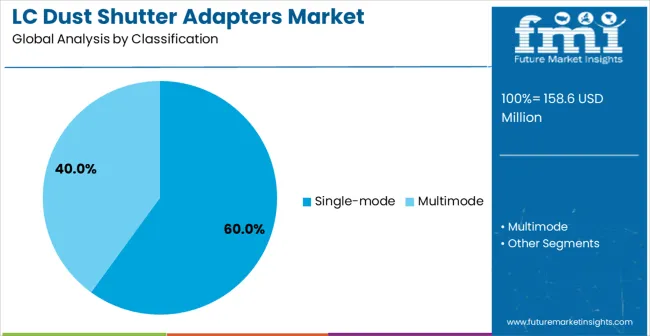
Single-Mode Adapters Lead Demand for LC Dust Shutter Adapters in 2025

Lc Dust Shutter Adapters Market Analysis By Classification

Single-mode LC dust shutter adapters hold a 60% share of the optical mode segment, making them the most widely used adapters in the market. They are favored for long-distance fiber optic transmission due to low signal attenuation and high reliability. Applications include backbone telecommunication networks, enterprise connectivity, and high-speed data communication systems. Leading manufacturers include Senko Advanced Components, Corning, Amphenol, and TE Connectivity. Single-mode adapters feature precise fiber alignment and dust protection, ensuring minimal signal disruption and enhanced network stability. Their ability to maintain performance over long distances and in high-density environments reinforces their adoption. Rising deployment of high-speed broadband, 5G networks, and enterprise networking solutions continues to drive market growth in this segment.
  • Ensures minimal signal loss and stable long-distance transmission
  • Offers dust protection and precise fiber alignment
  • Widely deployed in telecommunication networks and enterprise infrastructure

Telecommunication Networks Likely to Dominate LC Dust Shutter Adapters by Application in 2025

Lc Dust Shutter Adapters Market Analysis By Application

Telecommunication networks account for 30% of the application segment, making them the largest segment for LC dust shutter adapters. These adapters are critical in backbone networks, central offices, and high-capacity fiber optic systems, ensuring clean and secure connections. Manufacturers such as Senko Advanced Components, Corning, Amphenol, and TE Connectivity provide adapters with high reliability, easy installation, and long-term durability. Growth in this segment is fueled by the increasing demand for high-speed broadband, 5G infrastructure rollout, and expanding enterprise connectivity. The segment benefits from the need to maintain fiber cleanliness, precise alignment, and minimal signal attenuation, making telecommunication networks the key focus for investment in the LC dust shutter adapters market.

  • Used extensively in backbone and high-capacity fiber networks
  • Supports 5G rollout and high-speed broadband deployment
  • Growth driven by increasing telecommunication infrastructure investments

What are the Drivers, Restraints, and Key Trends of the LC Dust Shutter Adapters Market?

The LC dust shutter adapters market is growing as demand for reliable fiber optic connectivity rises. These adapters protect fiber connections from dust and contaminants, ensuring consistent signal transmission and network performance. Expansion of data centers, enterprise networks, and telecommunication infrastructure is fueling the need for high-quality adapters. Compact, user-friendly designs reduce installation time and maintenance efforts while enhancing network reliability. Improved materials and shutter mechanisms enhance durability and performance in demanding environments. Increasing investments in high-speed networks, cloud computing, and optical systems further drive adoption. These factors, combined with global demand for scalable and reliable network components, are contributing to steady market growth, making LC dust shutter adapters essential for maintaining efficient and protected fiber optic connections in modern network setups.

High Performance Requirements and Compatibility Needs Driving Demand

Demand for LC dust shutter adapters is rising due to the need for secure and compatible fiber connections. Modern networks require adapters that maintain low signal loss, high durability, and resistance to contamination. Compatibility with multiple fiber types, network standards, and high-density patch panels is increasingly important. Enterprises, data centers, and telecommunication providers seek adapters that can be quickly installed, require minimal maintenance, and provide consistent connectivity. Growing reliance on optical networks for enterprise computing, streaming services, and high-speed telecommunications is reinforcing the importance of dust protection in fiber optic systems. Manufacturers are offering adapters with enhanced shutter mechanisms and corrosion-resistant materials to ensure long-term reliability. Overall, performance, compatibility, and protection requirements continue to support market expansion.

High Costs and Installation Challenges Limiting Market Expansion

Despite growing adoption, the LC dust shutter adapter market faces challenges. High-quality adapters can be expensive, particularly for large-scale deployments requiring multiple units. Precision manufacturing, strict quality standards, and material selection contribute to higher costs. Proper installation is critical to ensure consistent performance and protection, requiring skilled personnel in some cases. Network operators must also consider compatibility with existing optical systems, which may require additional components or adjustments. In regions with limited technical expertise, awareness of correct installation procedures can be a barrier. Maintenance of shutter mechanisms and regular cleaning add to operational considerations.

Automation and Compact Designs Shaping Market Trends Globally

Market trends indicate increasing focus on compact, user-friendly, and durable LC dust shutter adapters. Manufacturers are designing adapters with smaller footprints to optimize space in high-density network setups. Automation and improved shutter mechanisms allow easier installation, reduced contamination risk, and minimal maintenance. Compatibility with multiple fiber types, network standards, and patch panel configurations is becoming standard. The rising adoption of cloud computing, edge networks, and data center expansion supports demand for efficient fiber protection solutions. Overall, trends point toward robust, compact, and adaptable designs that meet the evolving requirements of modern optical communication networks.
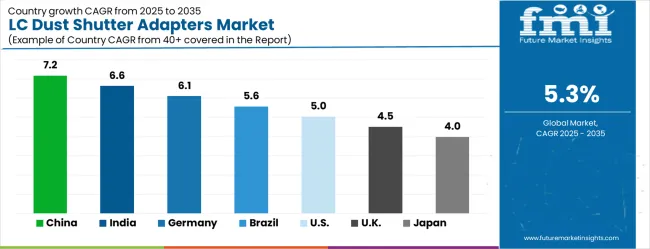
Analysis of the LC Dust Shutter Adapters Market by Key Countries

Lc Dust Shutter Adapters Market Cagr Analysis By Country

Country CAGR (2025-2035)
China 7.2%
India 6.6%
Germany 6.1%
Brazil 5.6%
USA 5.0%
UK 4.5%
Japan 4.0%

In 2025, the global LC dust shutter adapters market is projected to grow at a CAGR of 5.3%, with a multiplication factor of 1.68 over the 2025–2035 period. China leads at 7.2% (2.00x), 1.8 points above the global average, driven by expanding fiber optic networks and high-speed communication infrastructure. India follows at 6.6% (1.62x), 1.2 points higher than the global CAGR, supported by digital connectivity initiatives, both part of BRICS along with Brazil, which grows at 5.6% (1.62x), slightly above global growth due to broadband modernization projects. Germany records 6.1% ((1.81x)), 0.7 points above the global average, reflecting strong European telecom and industrial adoption. The USA grows at 5.0% (1.61x), slightly below global growth, while the UK at 4.5% (1.56x) and Japan at 4.0% (1.52x) lag behind. ASEAN and Oceania regions adopt these adapters at 5–6% (1.56–(1.81x)), supported by rising fiber-optic deployment and network upgrades.

The report covers an in-depth analysis of 40+ countries, top-performing countries are highlighted below.

China Leads Global Market Growth with Telecommunications Infrastructure Expansion

The LC dust shutter adapters market in China is expected to grow at a CAGR of 7.2% through 2035, fueled by expanding telecommunications networks and rapid data center development supported by government digital economy programs. The nationwide 5G rollout and rising investments in fiber optic technology are generating strong demand for advanced optical connectivity solutions. Major telecommunications providers and data center operators are building comprehensive fiber optic capabilities to meet both domestic and international connectivity needs.

  • Government initiatives for digital infrastructure and 5G deployment are boosting demand for optical connectivity components in metropolitan and industrial areas.
  • Telecommunications sector growth and the expanding data center network are driving adoption of fiber optic solutions among operators seeking improved network performance and operational efficiency.

India Shows Strong Market Potential with Digital Transformation

the LC dust shutter adapters market in India is projected to grow at a CAGR of 6.6%, driven by digital transformation initiatives, expanding telecommunications networks, and increasing demand for fiber optic connectivity. Growing enterprise connectivity requirements and digital services adoption are supporting demand for reliable optical networking solutions. International manufacturers and domestic distributors are developing extensive distribution networks to meet increasing demand

  • Development of digital infrastructure and expanding telecom networks is creating opportunities for optical adapter use across service providers, data centers, and enterprise facilities.
  • Government programs promoting digital expansion and broadband improvement are encouraging adoption of advanced connectivity solutions among operators seeking better network capabilities and service quality.

Germany Demonstrates Technological Leadership with Innovation-Focused Growth

The LC dust shutter adapters market in Germany is growing at a CAGR of 6.1%, supported by advanced telecommunications networks, technological innovation, and demand for high-performance optical networking solutions. The country’s established telecom industry and focus on network quality are driving deployment of sophisticated fiber optic connectivity solutions across enterprise and carrier markets. Leading manufacturers are investing in component development and precision production for domestic and export markets

  • Increased awareness of network reliability and performance is driving demand for advanced optical connectivity solutions among service providers.
  • Strong manufacturing expertise and technological capabilities are supporting the use of high-performance optical components in telecommunications and data center sectors.

Brazil Focuses on Telecommunications Modernization and Digital Infrastructure

The market in Brazil is expanding at a CAGR of 5.6%, fueled by modernization programs, investments in digital infrastructure, and fiber optic network deployment in urban and rural regions. Growth in communications networks is driving demand for advanced optical connectivity solutions. Telecommunications providers and data center operators are enhancing fiber optic capabilities to meet consumer and enterprise connectivity needs.

  • Government initiatives promoting digital infrastructure and broadband expansion are increasing adoption of optical adapters and contamination protection systems.
  • Rising demand for reliable telecommunications services across urban and rural regions is creating opportunities for expanded connectivity deployment.

USA Prioritizes Data Center Expansion and Network Upgrades

The LC dust shutter adapters market in the USA is expected to grow at a CAGR of 5.0%, supported by large-scale data center expansion, established telecommunications networks, and focus on network performance and reliability. Growth in cloud computing services is generating demand for high-density optical connectivity solutions with contamination protection. Manufacturers are broadening product offerings to serve both telecom and data center markets.

  • Data center growth and cloud infrastructure expansion are driving adoption of high-density optical connectivity solutions emphasizing performance and operational efficiency.
  • Network modernization and 5G rollout are encouraging adoption of advanced optical components for improved network capabilities and long-term investment security.

UK Expands Fiber Optic Networks and Infrastructure

The LC dust shutter adapters market in the UK is projected to grow at a CAGR of 4.5%, driven by fiber optic network deployment and telecom infrastructure upgrades in urban and rural areas. Established telecom providers are investing in advanced optical connectivity solutions to support both residential and enterprise networks.
  • Fiber optic deployment and broadband infrastructure improvements are increasing demand for reliable optical connectivity solutions among service providers.
  • Focus on network reliability and service quality is driving adoption of contamination-resistant optical components across telecom and enterprise applications.

Japan Focuses on Precision Manufacturing and Advanced Component Development

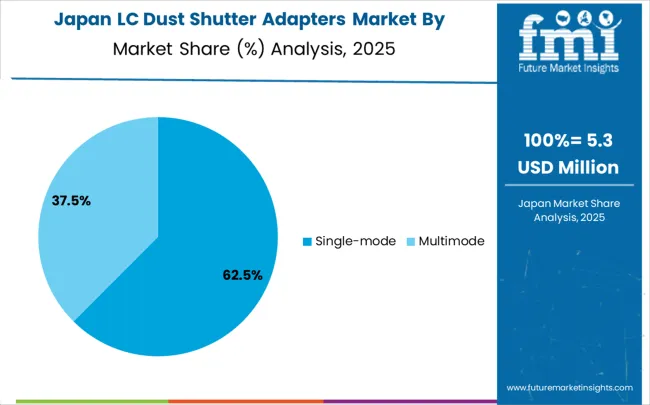
Lc Dust Shutter Adapters Market Japan Market Share Analysis By Classification

The LC dust shutter adapters market in Japan is expanding at a CAGR of 4.0%, driven by precision manufacturing, advanced component development, and preference for high-quality telecommunications equipment. Sophisticated manufacturing processes are supporting demand for premium optical connectivity solutions, including precision-engineered adapters and contamination protection systems.
  • Advanced manufacturing capabilities and precision engineering are enabling development of high-quality optical components for specialized applications.
  • Focus on technological advancement and quality standards is encouraging adoption of optical connectivity solutions that deliver enhanced performance and reliability.

Europe Market Split by Countries

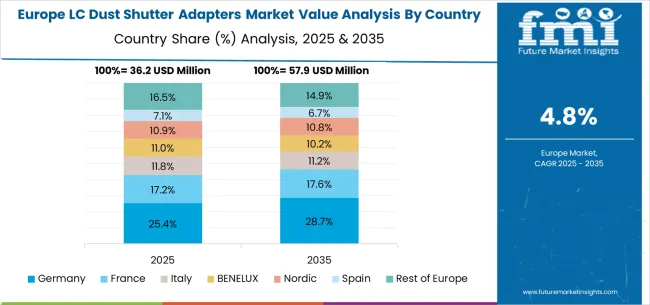
Lc Dust Shutter Adapters Market Europe Country Market Share Analysis, 2025 & 2035

The LC dust shutter adapters market in Europe is projected to grow from USD 36.8 million in 2025 to USD 61.8 million by 2035, registering a CAGR of 5.3% over the forecast period. Germany is expected to maintain its leadership position with a 29.3% market share in 2025, moderating slightly to 29.0% by 2035, supported by its strong telecommunications infrastructure, advanced optical networking capabilities, and comprehensive manufacturing networks serving major European markets.

The United Kingdom follows with a 23.1% share in 2025, projected to reach 23.3% by 2035, driven by robust fiber optic network deployment, established telecommunications infrastructure, and strong demand for reliable optical connectivity solutions across carrier and enterprise applications. France holds an 18.7% share in 2025, rising to 18.9% by 2035, supported by telecommunications modernization programs and increasing adoption of high-performance optical networking technologies in service provider networks. Italy records 12.4% in 2025, inching to 12.5% by 2035, with growth underpinned by telecommunications infrastructure improvement and increasing data center development activities. Spain contributes 8.9% in 2025, moving to 9.0% by 2035, supported by expanding fiber optic networks and telecommunications service enhancement programs. The Netherlands maintains a 3.2% share in 2025, growing to 3.3% by 2035. The Rest of Europe region, including Nordic countries, Eastern Europe, Belgium, Switzerland, and Austria, is anticipated to gain momentum, expanding its collective share from 4.4% to 4.0% by 2035, attributed to increasing adoption of advanced optical networking solutions in Nordic countries and growing telecommunications activities across Eastern European markets implementing infrastructure modernization programs.

Competitive Landscape of the LC Dust Shutter Adapters Market

The companies are investing in advanced optical technology research, contamination protection enhancement, precision manufacturing improvements, and comprehensive product portfolios to deliver consistent, high-performance, and reliable optical connectivity solutions. Innovation in optical connector design, automated manufacturing processes, and contamination prevention technologies is central to strengthening market position and competitive advantage.

SENKO Advanced Components leads the market with a strong market share, offering comprehensive optical connectivity solutions with a focus on high-density applications and contamination protection capabilities. Corning provides specialized fiber optic components with an focus on telecommunications and data center markets. Molex delivers innovative connectivity solutions with a focus on advanced optical networking and industrial applications. Fibertronics specializes in fiber optic connectivity products with focus on telecommunications infrastructure and network equipment integration. L-com focuses on optical networking components and comprehensive connectivity solutions for diverse market applications.

Key Players in the LC Dust Shutter Adapters Market

  • SENKO Advanced Components
  • Optcore
  • Molex
  • Fibertronics
  • L-com
  • Leviton
  • WCFO
  • Suncall
  • T&S Communications
  • YOFC

Scope of the Report

Items Values
Quantitative Units (2025) USD 158.6 million
Optical Mode Single-mode, Multimode
Application Data Centers, Wireless Communications, Medical Equipment, Telecommunication Networks, Others
Regions Covered North America, Europe, East Asia, South Asia & Pacific, Latin America, Middle East & Africa
Countries Covered United States, Canada, United Kingdom, Germany, France, China, Japan, South Korea, India, Brazil, Australia and 40+ countries
Key Companies Profiled SENKO Advanced Components, Corning, TE Connectivity, Leviton, Suncall
Additional Attributes Dollar sales by optical mode and application category, regional demand trends, competitive landscape, technological advancements in optical connectivity, contamination protection innovation, manufacturing automation development, and performance optimization

LC Dust Shutter Adapters Market by Segments

Optical Mode

  • Single-mode
  • Multimode

Application

  • Data Centers
  • Wireless Communications
  • Medical Equipment
  • Telecommunication Networks
  • Others

Region

North America

  • United States
  • Canada
  • Mexico

Europe

  • Germany
  • United Kingdom
  • France
  • Italy
  • Spain
  • Nordic
  • BENELUX
  • Rest of Europe

East Asia

  • China
  • Japan
  • South Korea

South Asia & Pacific

  • India
  • ASEAN
  • Australia & New Zealand
  • Rest of South Asia & Pacific

Latin America

  • Brazil
  • Chile
  • Rest of Latin America

Middle East & Africa

  • Kingdom of Saudi Arabia
  • Other GCC Countries
  • Turkiye
  • South Africa
  • Other African Union
  • Rest of Middle East & Africa

Table of Content

  1. Executive Summary
    • Global Market Outlook
    • Demand to side Trends
    • Supply to side Trends
    • Technology Roadmap Analysis
    • Analysis and Recommendations
  2. Market Overview
    • Market Coverage / Taxonomy
    • Market Definition / Scope / Limitations
  3. Market Background
    • Market Dynamics
      • Drivers
      • Restraints
      • Opportunity
      • Trends
    • Scenario Forecast
      • Demand in Optimistic Scenario
      • Demand in Likely Scenario
      • Demand in Conservative Scenario
    • Opportunity Map Analysis
    • Product Life Cycle Analysis
    • Supply Chain Analysis
    • Investment Feasibility Matrix
    • Value Chain Analysis
    • PESTLE and Porter’s Analysis
    • Regulatory Landscape
    • Regional Parent Market Outlook
    • Production and Consumption Statistics
    • Import and Export Statistics
  4. Global Market Analysis 2020 to 2024 and Forecast, 2025 to 2035
    • Historical Market Size Value (USD Million) Analysis, 2020 to 2024
    • Current and Future Market Size Value (USD Million) Projections, 2025 to 2035
      • Y to o to Y Growth Trend Analysis
      • Absolute $ Opportunity Analysis
  5. Global Market Pricing Analysis 2020 to 2024 and Forecast 2025 to 2035
  6. Global Market Analysis 2020 to 2024 and Forecast 2025 to 2035, By Classification
    • Introduction / Key Findings
    • Historical Market Size Value (USD Million) Analysis By Classification , 2020 to 2024
    • Current and Future Market Size Value (USD Million) Analysis and Forecast By Classification , 2025 to 2035
      • Single-mode
      • Multimode
    • Y to o to Y Growth Trend Analysis By Classification , 2020 to 2024
    • Absolute $ Opportunity Analysis By Classification , 2025 to 2035
  7. Global Market Analysis 2020 to 2024 and Forecast 2025 to 2035, By Application
    • Introduction / Key Findings
    • Historical Market Size Value (USD Million) Analysis By Application, 2020 to 2024
    • Current and Future Market Size Value (USD Million) Analysis and Forecast By Application, 2025 to 2035
      • Telecommunication Networks
      • Wireless Communications
      • Medical Equipment
      • Data Centers
      • Other
    • Y to o to Y Growth Trend Analysis By Application, 2020 to 2024
    • Absolute $ Opportunity Analysis By Application, 2025 to 2035
  8. Global Market Analysis 2020 to 2024 and Forecast 2025 to 2035, By Region
    • Introduction
    • Historical Market Size Value (USD Million) Analysis By Region, 2020 to 2024
    • Current Market Size Value (USD Million) Analysis and Forecast By Region, 2025 to 2035
      • North America
      • Latin America
      • Western Europe
      • Eastern Europe
      • East Asia
      • South Asia and Pacific
      • Middle East & Africa
    • Market Attractiveness Analysis By Region
  9. North America Market Analysis 2020 to 2024 and Forecast 2025 to 2035, By Country
    • Historical Market Size Value (USD Million) Trend Analysis By Market Taxonomy, 2020 to 2024
    • Market Size Value (USD Million) Forecast By Market Taxonomy, 2025 to 2035
      • By Country
        • USA
        • Canada
        • Mexico
      • By Classification
      • By Application
    • Market Attractiveness Analysis
      • By Country
      • By Classification
      • By Application
    • Key Takeaways
  10. Latin America Market Analysis 2020 to 2024 and Forecast 2025 to 2035, By Country
    • Historical Market Size Value (USD Million) Trend Analysis By Market Taxonomy, 2020 to 2024
    • Market Size Value (USD Million) Forecast By Market Taxonomy, 2025 to 2035
      • By Country
        • Brazil
        • Chile
        • Rest of Latin America
      • By Classification
      • By Application
    • Market Attractiveness Analysis
      • By Country
      • By Classification
      • By Application
    • Key Takeaways
  11. Western Europe Market Analysis 2020 to 2024 and Forecast 2025 to 2035, By Country
    • Historical Market Size Value (USD Million) Trend Analysis By Market Taxonomy, 2020 to 2024
    • Market Size Value (USD Million) Forecast By Market Taxonomy, 2025 to 2035
      • By Country
        • Germany
        • UK
        • Italy
        • Spain
        • France
        • Nordic
        • BENELUX
        • Rest of Western Europe
      • By Classification
      • By Application
    • Market Attractiveness Analysis
      • By Country
      • By Classification
      • By Application
    • Key Takeaways
  12. Eastern Europe Market Analysis 2020 to 2024 and Forecast 2025 to 2035, By Country
    • Historical Market Size Value (USD Million) Trend Analysis By Market Taxonomy, 2020 to 2024
    • Market Size Value (USD Million) Forecast By Market Taxonomy, 2025 to 2035
      • By Country
        • Russia
        • Poland
        • Hungary
        • Balkan & Baltic
        • Rest of Eastern Europe
      • By Classification
      • By Application
    • Market Attractiveness Analysis
      • By Country
      • By Classification
      • By Application
    • Key Takeaways
  13. East Asia Market Analysis 2020 to 2024 and Forecast 2025 to 2035, By Country
    • Historical Market Size Value (USD Million) Trend Analysis By Market Taxonomy, 2020 to 2024
    • Market Size Value (USD Million) Forecast By Market Taxonomy, 2025 to 2035
      • By Country
        • China
        • Japan
        • South Korea
      • By Classification
      • By Application
    • Market Attractiveness Analysis
      • By Country
      • By Classification
      • By Application
    • Key Takeaways
  14. South Asia and Pacific Market Analysis 2020 to 2024 and Forecast 2025 to 2035, By Country
    • Historical Market Size Value (USD Million) Trend Analysis By Market Taxonomy, 2020 to 2024
    • Market Size Value (USD Million) Forecast By Market Taxonomy, 2025 to 2035
      • By Country
        • India
        • ASEAN
        • Australia & New Zealand
        • Rest of South Asia and Pacific
      • By Classification
      • By Application
    • Market Attractiveness Analysis
      • By Country
      • By Classification
      • By Application
    • Key Takeaways
  15. Middle East & Africa Market Analysis 2020 to 2024 and Forecast 2025 to 2035, By Country
    • Historical Market Size Value (USD Million) Trend Analysis By Market Taxonomy, 2020 to 2024
    • Market Size Value (USD Million) Forecast By Market Taxonomy, 2025 to 2035
      • By Country
        • Kingdom of Saudi Arabia
        • Other GCC Countries
        • Turkiye
        • South Africa
        • Other African Union
        • Rest of Middle East & Africa
      • By Classification
      • By Application
    • Market Attractiveness Analysis
      • By Country
      • By Classification
      • By Application
    • Key Takeaways
  16. Key Countries Market Analysis
    • USA
      • Pricing Analysis
      • Market Share Analysis, 2024
        • By Classification
        • By Application
    • Canada
      • Pricing Analysis
      • Market Share Analysis, 2024
        • By Classification
        • By Application
    • Mexico
      • Pricing Analysis
      • Market Share Analysis, 2024
        • By Classification
        • By Application
    • Brazil
      • Pricing Analysis
      • Market Share Analysis, 2024
        • By Classification
        • By Application
    • Chile
      • Pricing Analysis
      • Market Share Analysis, 2024
        • By Classification
        • By Application
    • Germany
      • Pricing Analysis
      • Market Share Analysis, 2024
        • By Classification
        • By Application
    • UK
      • Pricing Analysis
      • Market Share Analysis, 2024
        • By Classification
        • By Application
    • Italy
      • Pricing Analysis
      • Market Share Analysis, 2024
        • By Classification
        • By Application
    • Spain
      • Pricing Analysis
      • Market Share Analysis, 2024
        • By Classification
        • By Application
    • France
      • Pricing Analysis
      • Market Share Analysis, 2024
        • By Classification
        • By Application
    • India
      • Pricing Analysis
      • Market Share Analysis, 2024
        • By Classification
        • By Application
    • ASEAN
      • Pricing Analysis
      • Market Share Analysis, 2024
        • By Classification
        • By Application
    • Australia & New Zealand
      • Pricing Analysis
      • Market Share Analysis, 2024
        • By Classification
        • By Application
    • China
      • Pricing Analysis
      • Market Share Analysis, 2024
        • By Classification
        • By Application
    • Japan
      • Pricing Analysis
      • Market Share Analysis, 2024
        • By Classification
        • By Application
    • South Korea
      • Pricing Analysis
      • Market Share Analysis, 2024
        • By Classification
        • By Application
    • Russia
      • Pricing Analysis
      • Market Share Analysis, 2024
        • By Classification
        • By Application
    • Poland
      • Pricing Analysis
      • Market Share Analysis, 2024
        • By Classification
        • By Application
    • Hungary
      • Pricing Analysis
      • Market Share Analysis, 2024
        • By Classification
        • By Application
    • Kingdom of Saudi Arabia
      • Pricing Analysis
      • Market Share Analysis, 2024
        • By Classification
        • By Application
    • Turkiye
      • Pricing Analysis
      • Market Share Analysis, 2024
        • By Classification
        • By Application
    • South Africa
      • Pricing Analysis
      • Market Share Analysis, 2024
        • By Classification
        • By Application
  17. Market Structure Analysis
    • Competition Dashboard
    • Competition Benchmarking
    • Market Share Analysis of Top Players
      • By Regional
      • By Classification
      • By Application
  18. Competition Analysis
    • Competition Deep Dive
      • SENKO Advanced Components
        • Overview
        • Product Portfolio
        • Profitability by Market Segments (Product/Age /Sales Channel/Region)
        • Sales Footprint
        • Strategy Overview
          • Marketing Strategy
          • Product Strategy
          • Channel Strategy
      • Optcore
      • Molex
      • Fibertronics
      • L-com
      • Leviton
      • WCFO
      • Suncall
      • T&S Communications
      • YOFC
  19. Assumptions & Acronyms Used
  20. Research Methodology

List of Tables

  • Table 1: Global Market Value (USD Million) Forecast by Region, 2020 to 2035
  • Table 2: Global Market Value (USD Million) Forecast by Classification , 2020 to 2035
  • Table 3: Global Market Value (USD Million) Forecast by Application, 2020 to 2035
  • Table 4: North America Market Value (USD Million) Forecast by Country, 2020 to 2035
  • Table 5: North America Market Value (USD Million) Forecast by Classification , 2020 to 2035
  • Table 6: North America Market Value (USD Million) Forecast by Application, 2020 to 2035
  • Table 7: Latin America Market Value (USD Million) Forecast by Country, 2020 to 2035
  • Table 8: Latin America Market Value (USD Million) Forecast by Classification , 2020 to 2035
  • Table 9: Latin America Market Value (USD Million) Forecast by Application, 2020 to 2035
  • Table 10: Western Europe Market Value (USD Million) Forecast by Country, 2020 to 2035
  • Table 11: Western Europe Market Value (USD Million) Forecast by Classification , 2020 to 2035
  • Table 12: Western Europe Market Value (USD Million) Forecast by Application, 2020 to 2035
  • Table 13: Eastern Europe Market Value (USD Million) Forecast by Country, 2020 to 2035
  • Table 14: Eastern Europe Market Value (USD Million) Forecast by Classification , 2020 to 2035
  • Table 15: Eastern Europe Market Value (USD Million) Forecast by Application, 2020 to 2035
  • Table 16: East Asia Market Value (USD Million) Forecast by Country, 2020 to 2035
  • Table 17: East Asia Market Value (USD Million) Forecast by Classification , 2020 to 2035
  • Table 18: East Asia Market Value (USD Million) Forecast by Application, 2020 to 2035
  • Table 19: South Asia and Pacific Market Value (USD Million) Forecast by Country, 2020 to 2035
  • Table 20: South Asia and Pacific Market Value (USD Million) Forecast by Classification , 2020 to 2035
  • Table 21: South Asia and Pacific Market Value (USD Million) Forecast by Application, 2020 to 2035
  • Table 22: Middle East & Africa Market Value (USD Million) Forecast by Country, 2020 to 2035
  • Table 23: Middle East & Africa Market Value (USD Million) Forecast by Classification , 2020 to 2035
  • Table 24: Middle East & Africa Market Value (USD Million) Forecast by Application, 2020 to 2035

List of Figures

  • Figure 1: Global Market Pricing Analysis
  • Figure 2: Global Market Value (USD Million) Forecast 2020-2035
  • Figure 3: Global Market Value Share and BPS Analysis by Classification , 2025 and 2035
  • Figure 4: Global Market Y to o to Y Growth Comparison by Classification , 2025-2035
  • Figure 5: Global Market Attractiveness Analysis by Classification
  • Figure 6: Global Market Value Share and BPS Analysis by Application, 2025 and 2035
  • Figure 7: Global Market Y to o to Y Growth Comparison by Application, 2025-2035
  • Figure 8: Global Market Attractiveness Analysis by Application
  • Figure 9: Global Market Value (USD Million) Share and BPS Analysis by Region, 2025 and 2035
  • Figure 10: Global Market Y to o to Y Growth Comparison by Region, 2025-2035
  • Figure 11: Global Market Attractiveness Analysis by Region
  • Figure 12: North America Market Incremental Dollar Opportunity, 2025-2035
  • Figure 13: Latin America Market Incremental Dollar Opportunity, 2025-2035
  • Figure 14: Western Europe Market Incremental Dollar Opportunity, 2025-2035
  • Figure 15: Eastern Europe Market Incremental Dollar Opportunity, 2025-2035
  • Figure 16: East Asia Market Incremental Dollar Opportunity, 2025-2035
  • Figure 17: South Asia and Pacific Market Incremental Dollar Opportunity, 2025-2035
  • Figure 18: Middle East & Africa Market Incremental Dollar Opportunity, 2025-2035
  • Figure 19: North America Market Value Share and BPS Analysis by Country, 2025 and 2035
  • Figure 20: North America Market Value Share and BPS Analysis by Classification , 2025 and 2035
  • Figure 21: North America Market Y to o to Y Growth Comparison by Classification , 2025-2035
  • Figure 22: North America Market Attractiveness Analysis by Classification
  • Figure 23: North America Market Value Share and BPS Analysis by Application, 2025 and 2035
  • Figure 24: North America Market Y to o to Y Growth Comparison by Application, 2025-2035
  • Figure 25: North America Market Attractiveness Analysis by Application
  • Figure 26: Latin America Market Value Share and BPS Analysis by Country, 2025 and 2035
  • Figure 27: Latin America Market Value Share and BPS Analysis by Classification , 2025 and 2035
  • Figure 28: Latin America Market Y to o to Y Growth Comparison by Classification , 2025-2035
  • Figure 29: Latin America Market Attractiveness Analysis by Classification
  • Figure 30: Latin America Market Value Share and BPS Analysis by Application, 2025 and 2035
  • Figure 31: Latin America Market Y to o to Y Growth Comparison by Application, 2025-2035
  • Figure 32: Latin America Market Attractiveness Analysis by Application
  • Figure 33: Western Europe Market Value Share and BPS Analysis by Country, 2025 and 2035
  • Figure 34: Western Europe Market Value Share and BPS Analysis by Classification , 2025 and 2035
  • Figure 35: Western Europe Market Y to o to Y Growth Comparison by Classification , 2025-2035
  • Figure 36: Western Europe Market Attractiveness Analysis by Classification
  • Figure 37: Western Europe Market Value Share and BPS Analysis by Application, 2025 and 2035
  • Figure 38: Western Europe Market Y to o to Y Growth Comparison by Application, 2025-2035
  • Figure 39: Western Europe Market Attractiveness Analysis by Application
  • Figure 40: Eastern Europe Market Value Share and BPS Analysis by Country, 2025 and 2035
  • Figure 41: Eastern Europe Market Value Share and BPS Analysis by Classification , 2025 and 2035
  • Figure 42: Eastern Europe Market Y to o to Y Growth Comparison by Classification , 2025-2035
  • Figure 43: Eastern Europe Market Attractiveness Analysis by Classification
  • Figure 44: Eastern Europe Market Value Share and BPS Analysis by Application, 2025 and 2035
  • Figure 45: Eastern Europe Market Y to o to Y Growth Comparison by Application, 2025-2035
  • Figure 46: Eastern Europe Market Attractiveness Analysis by Application
  • Figure 47: East Asia Market Value Share and BPS Analysis by Country, 2025 and 2035
  • Figure 48: East Asia Market Value Share and BPS Analysis by Classification , 2025 and 2035
  • Figure 49: East Asia Market Y to o to Y Growth Comparison by Classification , 2025-2035
  • Figure 50: East Asia Market Attractiveness Analysis by Classification
  • Figure 51: East Asia Market Value Share and BPS Analysis by Application, 2025 and 2035
  • Figure 52: East Asia Market Y to o to Y Growth Comparison by Application, 2025-2035
  • Figure 53: East Asia Market Attractiveness Analysis by Application
  • Figure 54: South Asia and Pacific Market Value Share and BPS Analysis by Country, 2025 and 2035
  • Figure 55: South Asia and Pacific Market Value Share and BPS Analysis by Classification , 2025 and 2035
  • Figure 56: South Asia and Pacific Market Y to o to Y Growth Comparison by Classification , 2025-2035
  • Figure 57: South Asia and Pacific Market Attractiveness Analysis by Classification
  • Figure 58: South Asia and Pacific Market Value Share and BPS Analysis by Application, 2025 and 2035
  • Figure 59: South Asia and Pacific Market Y to o to Y Growth Comparison by Application, 2025-2035
  • Figure 60: South Asia and Pacific Market Attractiveness Analysis by Application
  • Figure 61: Middle East & Africa Market Value Share and BPS Analysis by Country, 2025 and 2035
  • Figure 62: Middle East & Africa Market Value Share and BPS Analysis by Classification , 2025 and 2035
  • Figure 63: Middle East & Africa Market Y to o to Y Growth Comparison by Classification , 2025-2035
  • Figure 64: Middle East & Africa Market Attractiveness Analysis by Classification
  • Figure 65: Middle East & Africa Market Value Share and BPS Analysis by Application, 2025 and 2035
  • Figure 66: Middle East & Africa Market Y to o to Y Growth Comparison by Application, 2025-2035
  • Figure 67: Middle East & Africa Market Attractiveness Analysis by Application
  • Figure 68: Global Market - Tier Structure Analysis
  • Figure 69: Global Market - Company Share Analysis

Frequently Asked Questions

How big is the LC dust shutter adapters market in 2025?

The global LC dust shutter adapters market is estimated to be valued at USD 158.6 million in 2025.

What will be the size of LC dust shutter adapters market in 2035?

The market size for the LC dust shutter adapters market is projected to reach USD 265.8 million by 2035.

How much will be the LC dust shutter adapters market growth between 2025 and 2035?

The LC dust shutter adapters market is expected to grow at a 5.3% CAGR between 2025 and 2035.

What are the key product types in the LC dust shutter adapters market?

The key product types in LC dust shutter adapters market are single-mode and multimode.

Which application segment to contribute significant share in the LC dust shutter adapters market in 2025?

In terms of application, telecommunication networks segment to command 30.0% share in the LC dust shutter adapters market in 2025.

Explore Similar Insights

Future Market Insights

LC Dust Shutter Adapters Market

Chat With

MaRIA

Hi There, I am MaRIA, Your Market Research Intelligence Assistant. How may I help you?