LCD Digital Microscope Market Size and Share Forecast Outlook 2025 to 2035

The LCD Digital Microscope Market is estimated to be valued at USD 1.3 billion in 2025 and is projected to reach USD 3.1 billion by 2035, registering a compound annual growth rate (CAGR) of 8.9% over the forecast period.
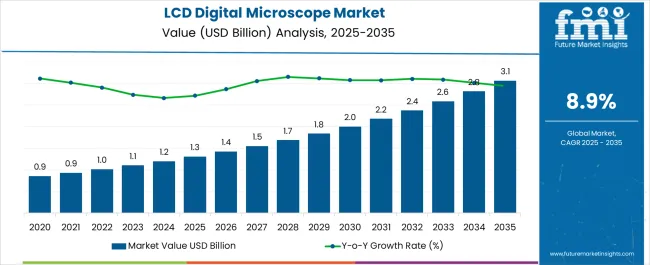
Quick Stats for LCD Digital Microscope Market

  • LCD Digital Microscope Market Value (2025): USD 1.3 billion
  • LCD Digital Microscope Market Forecast Value (2035): USD 3.1 billion
  • LCD Digital Microscope Market Forecast CAGR: 8.9%
  • Leading Segment in LCD Digital Microscope Market in 2025: Standalone (57.4%)
  • Key Growth Regions in LCD Digital Microscope Market: North America, Asia-Pacific, Europe
  • Top Key Players in LCD Digital Microscope Market: Celestron LLC, Hirox Europe Ltd, The Western Electric and Scientific Works, Leica Microsystems, Harzion Electronics, Catchbest Vision Technology

Lcd Digital Microscope Market Market Value Analysis

LCD Digital Microscope Market Key Takeaways

Metric Value
LCD Digital Microscope Market Estimated Value in (2025 E) USD 1.3 billion
LCD Digital Microscope Market Forecast Value in (2035 F) USD 3.1 billion
Forecast CAGR (2025 to 2035) 8.9%

Why is the LCD Digital Microscope Market Growing?

The LCD Digital Microscope market is growing steadily, fueled by the rising demand for advanced imaging tools across life sciences, material sciences, and industrial applications. These microscopes provide high-resolution imaging and real-time visualization on integrated LCD screens, eliminating the need for traditional eyepieces and enhancing user comfort. Growth is further supported by increasing adoption in educational institutions, research laboratories, and quality control environments, where digital integration improves accessibility and efficiency.

Integration with AI-driven analytics, wireless connectivity, and image storage capabilities is transforming microscopy into a more collaborative and data-centric process. The ability to share images instantly and conduct virtual demonstrations is particularly valuable in remote learning and global research collaborations. Rising investments in drug discovery, biotechnology, and clinical diagnostics are also strengthening demand.

The trend toward automation in laboratories is reinforcing the need for digital microscopes that can seamlessly integrate with laboratory information systems As technological advancements continue to enhance image clarity, magnification precision, and software integration, the LCD Digital Microscope market is expected to expand further, establishing itself as a key enabler of modern scientific research and applied industrial analysis.

Segmental Analysis

The lcd digital microscope market is segmented by modality, application, end user, and geographic regions. By modality, lcd digital microscope market is divided into Standalone and Portable. In terms of application, lcd digital microscope market is classified into Drug Discovery And Development, Basic Research, Biopharmaceutical Production, Tissue Engineering, Forensic Testing, and Others. Based on end user, lcd digital microscope market is segmented into Biopharmaceutical Companies, Food And Beverage Companies, Academic Research Institute, and Forensic And Pathology Laboratory. Regionally, the lcd digital microscope industry is classified into North America, Latin America, Western Europe, Eastern Europe, Balkan & Baltic Countries, Russia & Belarus, Central Asia, East Asia, South Asia & Pacific, and the Middle East & Africa.
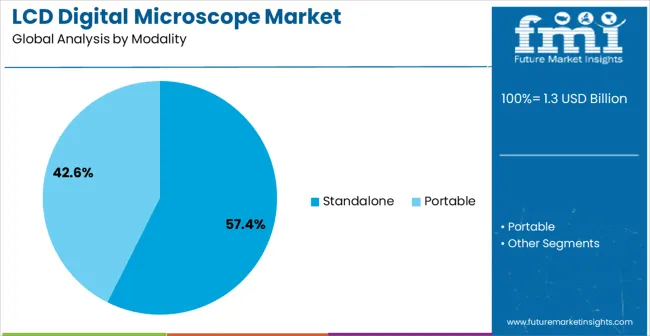
Insights into the Standalone Modality Segment

Lcd Digital Microscope Market Analysis By Modality

The standalone modality segment is projected to hold 57.4% of the LCD Digital Microscope market revenue share in 2025, making it the leading modality. This dominance is supported by the convenience of an all-in-one design that integrates imaging systems, displays, and software into a single unit, reducing the need for external attachments or additional hardware. Standalone systems are particularly valued in educational and research institutions, where ease of use and reduced setup time are critical.

The ability to provide real-time imaging directly on LCD screens enhances teaching effectiveness, collaborative research, and industrial inspection processes. Growing demand for portable and user-friendly devices further supports segment growth, as standalone microscopes are often more cost-effective and require minimal technical training. Advanced features such as digital zoom, image capturing, and built-in measurement tools improve productivity and broaden usability across applications.

The adaptability of standalone systems for both routine analysis and advanced research has reinforced their adoption As laboratories and institutions continue prioritizing efficiency and digital integration, standalone microscopes are expected to retain their leadership in the global market.
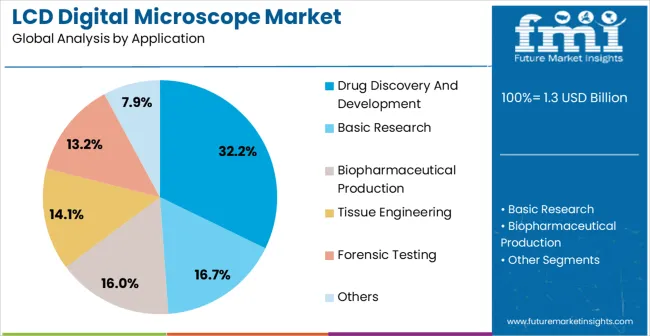
Insights into the Drug Discovery and Development Application Segment

Lcd Digital Microscope Market Analysis By Application

The drug discovery and development application segment is expected to account for 32.2% of the LCD Digital Microscope market revenue share in 2025, positioning it as the leading application area. This leadership is being driven by the growing need for precise imaging tools to study cellular interactions, drug responses, and molecular structures in real time. LCD digital microscopes enable researchers to capture high-resolution images and video sequences, facilitating more accurate analysis of drug efficacy and toxicity.

The ability to share visual data across teams through digital platforms enhances collaboration and accelerates decision-making in pharmaceutical research. These microscopes also support integration with advanced image analysis software, enabling automated detection and quantification of cellular changes, which significantly improves research efficiency.

The increasing global investment in pharmaceutical R&D, coupled with rising demand for advanced therapeutic solutions, has reinforced the adoption of LCD digital microscopes in drug development workflows As drug pipelines become more complex and require precision at every stage, digital microscopes are expected to remain integral to research infrastructure, driving continued growth in this segment.
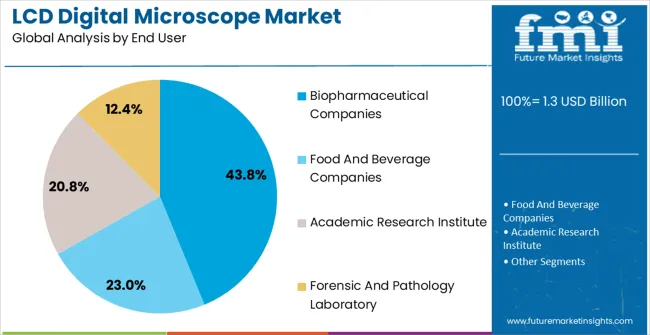
Insights into the Biopharmaceutical Companies End-User Segment

Lcd Digital Microscope Market Analysis By End User

The biopharmaceutical companies segment is projected to hold 43.8% of the LCD Digital Microscope market revenue share in 2025, making it the leading end-user category. Growth in this segment is being fueled by the rising need for advanced imaging systems to support biologics development, quality assurance, and cell line monitoring. LCD digital microscopes provide these companies with the capability to conduct real-time visualization and analysis of complex biological processes, supporting innovation in vaccines, monoclonal antibodies, and advanced therapies.

Their integration with automated imaging software enables more efficient workflows, reducing manual labor while ensuring consistency and compliance with regulatory standards. Biopharmaceutical firms are also leveraging these microscopes to enhance drug safety testing, cellular imaging, and molecular research, which directly influence pipeline productivity.

The scalability of digital microscopes allows companies to adapt quickly to research demands while maintaining cost efficiency As global demand for biologics and personalized medicine continues to grow, biopharmaceutical companies are expected to remain the largest consumers of LCD digital microscopes, reinforcing their market leadership.

Market Overview

LCD Digital Microscope Market Overview

A microscope is an instrument which provides an enlarged image of an object which is not visible by naked eye. There are different types of microscopes available in the market such optical microscope, electron microscope, digital microscope and other.

A microscope consist of a tiny digital camera which is connected to a computer is referred as digital microscopes. The images that are seen through the eyepiece of the digital microscope can also be visualized on the monitor screen and also saved on the hard drive as an image.

LCD screen has been directly attached to the microscope in LCD digital microscope. This microscope has extendable memory to store the images. Some advanced LCD digital microscopes also allowed to capture and store the videos in micro-SD card.

The high quality of LCD digital microscopes multiple optical lenses for the better specimen and high definition. The LCD digital microscopes are widely used in industries and research laboratories.
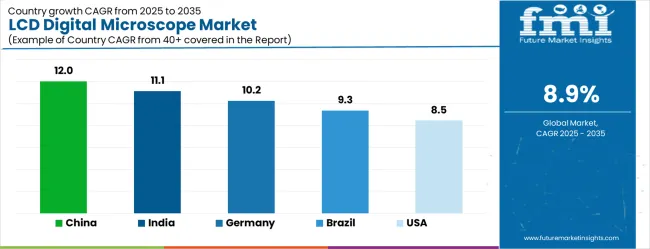
Analysis of LCD Digital Microscope Market By Key Countries

Lcd Digital Microscope Market Cagr Analysis By Country

Country CAGR
China 12.0%
India 11.1%
Germany 10.2%
Brazil 9.3%
USA 8.5%
UK 7.6%
Japan 6.7%

Country-wise Analysis

The LCD Digital Microscope Market is expected to register a CAGR of 8.9% during the forecast period, exhibiting varied country level momentum. China leads with the highest CAGR of 12.0%, followed by India at 11.1%. Developed markets such as Germany, France, and the UK continue to expand steadily, while the USA is likely to grow at consistent rates. Japan posts the lowest CAGR at 6.7%, yet still underscores a broadly positive trajectory for the global LCD Digital Microscope Market. In 2024, Germany held a dominant revenue in the Western Europe market and is expected to grow with a CAGR of 10.2%. The USA LCD Digital Microscope Market is estimated to be valued at USD 453.9 million in 2025 and is anticipated to reach a valuation of USD 453.9 million by 2035. Sales are projected to rise at a CAGR of 0.0% over the forecast period between 2025 and 2035. While Japan and South Korea markets are estimated to be valued at USD 62.1 million and USD 45.2 million respectively in 2025.
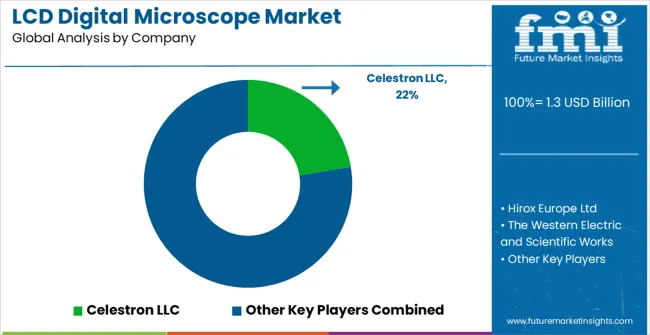
Key Players in the LCD Digital Microscope Market

Lcd Digital Microscope Market Analysis By Company

  • Celestron LLC
  • Hirox Europe Ltd
  • The Western Electric and Scientific Works
  • Leica Microsystems
  • Harzion Electronics
  • Catchbest Vision Technology

Scope of the Report

Item Value
Quantitative Units USD 1.3 Billion
Modality Standalone and Portable
Application Drug Discovery And Development, Basic Research, Biopharmaceutical Production, Tissue Engineering, Forensic Testing, and Others
End User Biopharmaceutical Companies, Food And Beverage Companies, Academic Research Institute, and Forensic And Pathology Laboratory
Regions Covered North America, Europe, Asia-Pacific, Latin America, Middle East & Africa
Country Covered United States, Canada, Germany, France, United Kingdom, China, Japan, India, Brazil, South Africa
Key Companies Profiled Celestron LLC, Hirox Europe Ltd, The Western Electric and Scientific Works, Leica Microsystems, Harzion Electronics, and Catchbest Vision Technology

LCD Digital Microscope Market by Segments

Modality:

  • Standalone
  • Portable

Application:

  • Drug Discovery And Development
  • Basic Research
  • Biopharmaceutical Production
  • Tissue Engineering
  • Forensic Testing
  • Others

End User:

  • Biopharmaceutical Companies
  • Food And Beverage Companies
  • Academic Research Institute
  • Forensic And Pathology Laboratory

Region:

  • North America
    • USA
    • Canada
    • Mexico
  • Latin America
    • Brazil
    • Chile
    • Rest of Latin America
  • Western Europe
    • Germany
    • UK
    • Italy
    • Spain
    • France
    • Nordic
    • BENELUX
    • Rest of Western Europe
  • Eastern Europe
    • Russia
    • Poland
    • Hungary
    • Balkan & Baltic
    • Rest of Eastern Europe
  • East Asia
    • China
    • Japan
    • South Korea
  • South Asia and Pacific
    • India
    • ASEAN
    • Australia & New Zealand
    • Rest of South Asia and Pacific
  • Middle East & Africa
    • Kingdom of Saudi Arabia
    • Other GCC Countries
    • Turkiye
    • South Africa
    • Other African Union
    • Rest of Middle East & Africa

Frequently Asked Questions

How big is the LCD digital microscope market in 2025?

The global LCD digital microscope market is estimated to be valued at USD 1.3 billion in 2025.

What will be the size of LCD digital microscope market in 2035?

The market size for the LCD digital microscope market is projected to reach USD 3.1 billion by 2035.

How much will be the LCD digital microscope market growth between 2025 and 2035?

The LCD digital microscope market is expected to grow at a 8.9% CAGR between 2025 and 2035.

What are the key product types in the LCD digital microscope market?

The key product types in LCD digital microscope market are standalone and portable.

Which application segment to contribute significant share in the LCD digital microscope market in 2025?

In terms of application, drug discovery and development segment to command 32.2% share in the LCD digital microscope market in 2025.

Table of Content

  1. Executive Summary
    • Global Market Outlook
    • Demand-side Trends
    • Supply-side Trends
    • Technology Roadmap Analysis
    • Analysis and Recommendations
  2. Market Overview
    • Market Coverage / Taxonomy
    • Market Definition / Scope / Limitations
  3. Market Background
    • Market Dynamics
      • Drivers
      • Restraints
      • Opportunity
      • Trends
    • Scenario Forecast
      • Demand in Optimistic Scenario
      • Demand in Likely Scenario
      • Demand in Conservative Scenario
    • Opportunity Map Analysis
    • Product Life Cycle Analysis
    • Supply Chain Analysis
    • Investment Feasibility Matrix
    • Value Chain Analysis
    • PESTLE and Porter’s Analysis
    • Regulatory Landscape
    • Regional Parent Market Outlook
    • Production and Consumption Statistics
    • Import and Export Statistics
  4. Global Market Analysis 2020 to 2024 and Forecast, 2025 to 2035
    • Historical Market Size Value (USD Million) Analysis, 2020 to 2024
    • Current and Future Market Size Value (USD Million) Projections, 2025 to 2035
      • Y-o-Y Growth Trend Analysis
      • Absolute $ Opportunity Analysis
  5. Global Market Pricing Analysis 2020 to 2024 and Forecast 2025 to 2035
  6. Global Market Analysis 2020 to 2024 and Forecast 2025 to 2035, By Modality
    • Introduction / Key Findings
    • Historical Market Size Value (USD Million) Analysis By Modality , 2020 to 2024
    • Current and Future Market Size Value (USD Million) Analysis and Forecast By Modality , 2025 to 2035
      • Standalone
      • Portable
    • Y-o-Y Growth Trend Analysis By Modality , 2020 to 2024
    • Absolute $ Opportunity Analysis By Modality , 2025 to 2035
  7. Global Market Analysis 2020 to 2024 and Forecast 2025 to 2035, By Application
    • Introduction / Key Findings
    • Historical Market Size Value (USD Million) Analysis By Application, 2020 to 2024
    • Current and Future Market Size Value (USD Million) Analysis and Forecast By Application, 2025 to 2035
      • Drug Discovery And Development
      • Basic Research
      • Biopharmaceutical Production
      • Tissue Engineering
      • Forensic Testing
      • Others
    • Y-o-Y Growth Trend Analysis By Application, 2020 to 2024
    • Absolute $ Opportunity Analysis By Application, 2025 to 2035
  8. Global Market Analysis 2020 to 2024 and Forecast 2025 to 2035, By End User
    • Introduction / Key Findings
    • Historical Market Size Value (USD Million) Analysis By End User, 2020 to 2024
    • Current and Future Market Size Value (USD Million) Analysis and Forecast By End User, 2025 to 2035
      • Biopharmaceutical Companies
      • Food And Beverage Companies
      • Academic Research Institute
      • Forensic And Pathology Laboratory
    • Y-o-Y Growth Trend Analysis By End User, 2020 to 2024
    • Absolute $ Opportunity Analysis By End User, 2025 to 2035
  9. Global Market Analysis 2020 to 2024 and Forecast 2025 to 2035, By Region
    • Introduction
    • Historical Market Size Value (USD Million) Analysis By Region, 2020 to 2024
    • Current Market Size Value (USD Million) Analysis and Forecast By Region, 2025 to 2035
      • North America
      • Latin America
      • Western Europe
      • Eastern Europe
      • East Asia
      • South Asia and Pacific
      • Middle East & Africa
    • Market Attractiveness Analysis By Region
  10. North America Market Analysis 2020 to 2024 and Forecast 2025 to 2035, By Country
    • Historical Market Size Value (USD Million) Trend Analysis By Market Taxonomy, 2020 to 2024
    • Market Size Value (USD Million) Forecast By Market Taxonomy, 2025 to 2035
      • By Country
        • USA
        • Canada
        • Mexico
      • By Modality
      • By Application
      • By End User
    • Market Attractiveness Analysis
      • By Country
      • By Modality
      • By Application
      • By End User
    • Key Takeaways
  11. Latin America Market Analysis 2020 to 2024 and Forecast 2025 to 2035, By Country
    • Historical Market Size Value (USD Million) Trend Analysis By Market Taxonomy, 2020 to 2024
    • Market Size Value (USD Million) Forecast By Market Taxonomy, 2025 to 2035
      • By Country
        • Brazil
        • Chile
        • Rest of Latin America
      • By Modality
      • By Application
      • By End User
    • Market Attractiveness Analysis
      • By Country
      • By Modality
      • By Application
      • By End User
    • Key Takeaways
  12. Western Europe Market Analysis 2020 to 2024 and Forecast 2025 to 2035, By Country
    • Historical Market Size Value (USD Million) Trend Analysis By Market Taxonomy, 2020 to 2024
    • Market Size Value (USD Million) Forecast By Market Taxonomy, 2025 to 2035
      • By Country
        • Germany
        • UK
        • Italy
        • Spain
        • France
        • Nordic
        • BENELUX
        • Rest of Western Europe
      • By Modality
      • By Application
      • By End User
    • Market Attractiveness Analysis
      • By Country
      • By Modality
      • By Application
      • By End User
    • Key Takeaways
  13. Eastern Europe Market Analysis 2020 to 2024 and Forecast 2025 to 2035, By Country
    • Historical Market Size Value (USD Million) Trend Analysis By Market Taxonomy, 2020 to 2024
    • Market Size Value (USD Million) Forecast By Market Taxonomy, 2025 to 2035
      • By Country
        • Russia
        • Poland
        • Hungary
        • Balkan & Baltic
        • Rest of Eastern Europe
      • By Modality
      • By Application
      • By End User
    • Market Attractiveness Analysis
      • By Country
      • By Modality
      • By Application
      • By End User
    • Key Takeaways
  14. East Asia Market Analysis 2020 to 2024 and Forecast 2025 to 2035, By Country
    • Historical Market Size Value (USD Million) Trend Analysis By Market Taxonomy, 2020 to 2024
    • Market Size Value (USD Million) Forecast By Market Taxonomy, 2025 to 2035
      • By Country
        • China
        • Japan
        • South Korea
      • By Modality
      • By Application
      • By End User
    • Market Attractiveness Analysis
      • By Country
      • By Modality
      • By Application
      • By End User
    • Key Takeaways
  15. South Asia and Pacific Market Analysis 2020 to 2024 and Forecast 2025 to 2035, By Country
    • Historical Market Size Value (USD Million) Trend Analysis By Market Taxonomy, 2020 to 2024
    • Market Size Value (USD Million) Forecast By Market Taxonomy, 2025 to 2035
      • By Country
        • India
        • ASEAN
        • Australia & New Zealand
        • Rest of South Asia and Pacific
      • By Modality
      • By Application
      • By End User
    • Market Attractiveness Analysis
      • By Country
      • By Modality
      • By Application
      • By End User
    • Key Takeaways
  16. Middle East & Africa Market Analysis 2020 to 2024 and Forecast 2025 to 2035, By Country
    • Historical Market Size Value (USD Million) Trend Analysis By Market Taxonomy, 2020 to 2024
    • Market Size Value (USD Million) Forecast By Market Taxonomy, 2025 to 2035
      • By Country
        • Kingdom of Saudi Arabia
        • Other GCC Countries
        • Turkiye
        • South Africa
        • Other African Union
        • Rest of Middle East & Africa
      • By Modality
      • By Application
      • By End User
    • Market Attractiveness Analysis
      • By Country
      • By Modality
      • By Application
      • By End User
    • Key Takeaways
  17. Key Countries Market Analysis
    • USA
      • Pricing Analysis
      • Market Share Analysis, 2024
        • By Modality
        • By Application
        • By End User
    • Canada
      • Pricing Analysis
      • Market Share Analysis, 2024
        • By Modality
        • By Application
        • By End User
    • Mexico
      • Pricing Analysis
      • Market Share Analysis, 2024
        • By Modality
        • By Application
        • By End User
    • Brazil
      • Pricing Analysis
      • Market Share Analysis, 2024
        • By Modality
        • By Application
        • By End User
    • Chile
      • Pricing Analysis
      • Market Share Analysis, 2024
        • By Modality
        • By Application
        • By End User
    • Germany
      • Pricing Analysis
      • Market Share Analysis, 2024
        • By Modality
        • By Application
        • By End User
    • UK
      • Pricing Analysis
      • Market Share Analysis, 2024
        • By Modality
        • By Application
        • By End User
    • Italy
      • Pricing Analysis
      • Market Share Analysis, 2024
        • By Modality
        • By Application
        • By End User
    • Spain
      • Pricing Analysis
      • Market Share Analysis, 2024
        • By Modality
        • By Application
        • By End User
    • France
      • Pricing Analysis
      • Market Share Analysis, 2024
        • By Modality
        • By Application
        • By End User
    • India
      • Pricing Analysis
      • Market Share Analysis, 2024
        • By Modality
        • By Application
        • By End User
    • ASEAN
      • Pricing Analysis
      • Market Share Analysis, 2024
        • By Modality
        • By Application
        • By End User
    • Australia & New Zealand
      • Pricing Analysis
      • Market Share Analysis, 2024
        • By Modality
        • By Application
        • By End User
    • China
      • Pricing Analysis
      • Market Share Analysis, 2024
        • By Modality
        • By Application
        • By End User
    • Japan
      • Pricing Analysis
      • Market Share Analysis, 2024
        • By Modality
        • By Application
        • By End User
    • South Korea
      • Pricing Analysis
      • Market Share Analysis, 2024
        • By Modality
        • By Application
        • By End User
    • Russia
      • Pricing Analysis
      • Market Share Analysis, 2024
        • By Modality
        • By Application
        • By End User
    • Poland
      • Pricing Analysis
      • Market Share Analysis, 2024
        • By Modality
        • By Application
        • By End User
    • Hungary
      • Pricing Analysis
      • Market Share Analysis, 2024
        • By Modality
        • By Application
        • By End User
    • Kingdom of Saudi Arabia
      • Pricing Analysis
      • Market Share Analysis, 2024
        • By Modality
        • By Application
        • By End User
    • Turkiye
      • Pricing Analysis
      • Market Share Analysis, 2024
        • By Modality
        • By Application
        • By End User
    • South Africa
      • Pricing Analysis
      • Market Share Analysis, 2024
        • By Modality
        • By Application
        • By End User
  18. Market Structure Analysis
    • Competition Dashboard
    • Competition Benchmarking
    • Market Share Analysis of Top Players
      • By Regional
      • By Modality
      • By Application
      • By End User
  19. Competition Analysis
    • Competition Deep Dive
      • Celestron LLC
        • Overview
        • Product Portfolio
        • Profitability by Market Segments (Product/Age /Sales Channel/Region)
        • Sales Footprint
        • Strategy Overview
          • Marketing Strategy
          • Product Strategy
          • Channel Strategy
      • Hirox Europe Ltd
      • The Western Electric and Scientific Works
      • Leica Microsystems
      • Harzion Electronics
      • Catchbest Vision Technology
  20. Assumptions & Acronyms Used
  21. Research Methodology

List of Tables

  • Table 1: Global Market Value (USD Million) Forecast by Region, 2020 to 2035
  • Table 2: Global Market Value (USD Million) Forecast by Modality , 2020 to 2035
  • Table 3: Global Market Value (USD Million) Forecast by Application, 2020 to 2035
  • Table 4: Global Market Value (USD Million) Forecast by End User, 2020 to 2035
  • Table 5: North America Market Value (USD Million) Forecast by Country, 2020 to 2035
  • Table 6: North America Market Value (USD Million) Forecast by Modality , 2020 to 2035
  • Table 7: North America Market Value (USD Million) Forecast by Application, 2020 to 2035
  • Table 8: North America Market Value (USD Million) Forecast by End User, 2020 to 2035
  • Table 9: Latin America Market Value (USD Million) Forecast by Country, 2020 to 2035
  • Table 10: Latin America Market Value (USD Million) Forecast by Modality , 2020 to 2035
  • Table 11: Latin America Market Value (USD Million) Forecast by Application, 2020 to 2035
  • Table 12: Latin America Market Value (USD Million) Forecast by End User, 2020 to 2035
  • Table 13: Western Europe Market Value (USD Million) Forecast by Country, 2020 to 2035
  • Table 14: Western Europe Market Value (USD Million) Forecast by Modality , 2020 to 2035
  • Table 15: Western Europe Market Value (USD Million) Forecast by Application, 2020 to 2035
  • Table 16: Western Europe Market Value (USD Million) Forecast by End User, 2020 to 2035
  • Table 17: Eastern Europe Market Value (USD Million) Forecast by Country, 2020 to 2035
  • Table 18: Eastern Europe Market Value (USD Million) Forecast by Modality , 2020 to 2035
  • Table 19: Eastern Europe Market Value (USD Million) Forecast by Application, 2020 to 2035
  • Table 20: Eastern Europe Market Value (USD Million) Forecast by End User, 2020 to 2035
  • Table 21: East Asia Market Value (USD Million) Forecast by Country, 2020 to 2035
  • Table 22: East Asia Market Value (USD Million) Forecast by Modality , 2020 to 2035
  • Table 23: East Asia Market Value (USD Million) Forecast by Application, 2020 to 2035
  • Table 24: East Asia Market Value (USD Million) Forecast by End User, 2020 to 2035
  • Table 25: South Asia and Pacific Market Value (USD Million) Forecast by Country, 2020 to 2035
  • Table 26: South Asia and Pacific Market Value (USD Million) Forecast by Modality , 2020 to 2035
  • Table 27: South Asia and Pacific Market Value (USD Million) Forecast by Application, 2020 to 2035
  • Table 28: South Asia and Pacific Market Value (USD Million) Forecast by End User, 2020 to 2035
  • Table 29: Middle East & Africa Market Value (USD Million) Forecast by Country, 2020 to 2035
  • Table 30: Middle East & Africa Market Value (USD Million) Forecast by Modality , 2020 to 2035
  • Table 31: Middle East & Africa Market Value (USD Million) Forecast by Application, 2020 to 2035
  • Table 32: Middle East & Africa Market Value (USD Million) Forecast by End User, 2020 to 2035

List of Figures

  • Figure 1: Global Market Pricing Analysis
  • Figure 2: Global Market Value (USD Million) Forecast 2020 to 2035
  • Figure 3: Global Market Value Share and BPS Analysis by Modality , 2025 and 2035
  • Figure 4: Global Market Y-o-Y Growth Comparison by Modality , 2025 to 2035
  • Figure 5: Global Market Attractiveness Analysis by Modality
  • Figure 6: Global Market Value Share and BPS Analysis by Application, 2025 and 2035
  • Figure 7: Global Market Y-o-Y Growth Comparison by Application, 2025 to 2035
  • Figure 8: Global Market Attractiveness Analysis by Application
  • Figure 9: Global Market Value Share and BPS Analysis by End User, 2025 and 2035
  • Figure 10: Global Market Y-o-Y Growth Comparison by End User, 2025 to 2035
  • Figure 11: Global Market Attractiveness Analysis by End User
  • Figure 12: Global Market Value (USD Million) Share and BPS Analysis by Region, 2025 and 2035
  • Figure 13: Global Market Y-o-Y Growth Comparison by Region, 2025 to 2035
  • Figure 14: Global Market Attractiveness Analysis by Region
  • Figure 15: North America Market Incremental Dollar Opportunity, 2025 to 2035
  • Figure 16: Latin America Market Incremental Dollar Opportunity, 2025 to 2035
  • Figure 17: Western Europe Market Incremental Dollar Opportunity, 2025 to 2035
  • Figure 18: Eastern Europe Market Incremental Dollar Opportunity, 2025 to 2035
  • Figure 19: East Asia Market Incremental Dollar Opportunity, 2025 to 2035
  • Figure 20: South Asia and Pacific Market Incremental Dollar Opportunity, 2025 to 2035
  • Figure 21: Middle East & Africa Market Incremental Dollar Opportunity, 2025 to 2035
  • Figure 22: North America Market Value Share and BPS Analysis by Country, 2025 and 2035
  • Figure 23: North America Market Value Share and BPS Analysis by Modality , 2025 and 2035
  • Figure 24: North America Market Y-o-Y Growth Comparison by Modality , 2025 to 2035
  • Figure 25: North America Market Attractiveness Analysis by Modality
  • Figure 26: North America Market Value Share and BPS Analysis by Application, 2025 and 2035
  • Figure 27: North America Market Y-o-Y Growth Comparison by Application, 2025 to 2035
  • Figure 28: North America Market Attractiveness Analysis by Application
  • Figure 29: North America Market Value Share and BPS Analysis by End User, 2025 and 2035
  • Figure 30: North America Market Y-o-Y Growth Comparison by End User, 2025 to 2035
  • Figure 31: North America Market Attractiveness Analysis by End User
  • Figure 32: Latin America Market Value Share and BPS Analysis by Country, 2025 and 2035
  • Figure 33: Latin America Market Value Share and BPS Analysis by Modality , 2025 and 2035
  • Figure 34: Latin America Market Y-o-Y Growth Comparison by Modality , 2025 to 2035
  • Figure 35: Latin America Market Attractiveness Analysis by Modality
  • Figure 36: Latin America Market Value Share and BPS Analysis by Application, 2025 and 2035
  • Figure 37: Latin America Market Y-o-Y Growth Comparison by Application, 2025 to 2035
  • Figure 38: Latin America Market Attractiveness Analysis by Application
  • Figure 39: Latin America Market Value Share and BPS Analysis by End User, 2025 and 2035
  • Figure 40: Latin America Market Y-o-Y Growth Comparison by End User, 2025 to 2035
  • Figure 41: Latin America Market Attractiveness Analysis by End User
  • Figure 42: Western Europe Market Value Share and BPS Analysis by Country, 2025 and 2035
  • Figure 43: Western Europe Market Value Share and BPS Analysis by Modality , 2025 and 2035
  • Figure 44: Western Europe Market Y-o-Y Growth Comparison by Modality , 2025 to 2035
  • Figure 45: Western Europe Market Attractiveness Analysis by Modality
  • Figure 46: Western Europe Market Value Share and BPS Analysis by Application, 2025 and 2035
  • Figure 47: Western Europe Market Y-o-Y Growth Comparison by Application, 2025 to 2035
  • Figure 48: Western Europe Market Attractiveness Analysis by Application
  • Figure 49: Western Europe Market Value Share and BPS Analysis by End User, 2025 and 2035
  • Figure 50: Western Europe Market Y-o-Y Growth Comparison by End User, 2025 to 2035
  • Figure 51: Western Europe Market Attractiveness Analysis by End User
  • Figure 52: Eastern Europe Market Value Share and BPS Analysis by Country, 2025 and 2035
  • Figure 53: Eastern Europe Market Value Share and BPS Analysis by Modality , 2025 and 2035
  • Figure 54: Eastern Europe Market Y-o-Y Growth Comparison by Modality , 2025 to 2035
  • Figure 55: Eastern Europe Market Attractiveness Analysis by Modality
  • Figure 56: Eastern Europe Market Value Share and BPS Analysis by Application, 2025 and 2035
  • Figure 57: Eastern Europe Market Y-o-Y Growth Comparison by Application, 2025 to 2035
  • Figure 58: Eastern Europe Market Attractiveness Analysis by Application
  • Figure 59: Eastern Europe Market Value Share and BPS Analysis by End User, 2025 and 2035
  • Figure 60: Eastern Europe Market Y-o-Y Growth Comparison by End User, 2025 to 2035
  • Figure 61: Eastern Europe Market Attractiveness Analysis by End User
  • Figure 62: East Asia Market Value Share and BPS Analysis by Country, 2025 and 2035
  • Figure 63: East Asia Market Value Share and BPS Analysis by Modality , 2025 and 2035
  • Figure 64: East Asia Market Y-o-Y Growth Comparison by Modality , 2025 to 2035
  • Figure 65: East Asia Market Attractiveness Analysis by Modality
  • Figure 66: East Asia Market Value Share and BPS Analysis by Application, 2025 and 2035
  • Figure 67: East Asia Market Y-o-Y Growth Comparison by Application, 2025 to 2035
  • Figure 68: East Asia Market Attractiveness Analysis by Application
  • Figure 69: East Asia Market Value Share and BPS Analysis by End User, 2025 and 2035
  • Figure 70: East Asia Market Y-o-Y Growth Comparison by End User, 2025 to 2035
  • Figure 71: East Asia Market Attractiveness Analysis by End User
  • Figure 72: South Asia and Pacific Market Value Share and BPS Analysis by Country, 2025 and 2035
  • Figure 73: South Asia and Pacific Market Value Share and BPS Analysis by Modality , 2025 and 2035
  • Figure 74: South Asia and Pacific Market Y-o-Y Growth Comparison by Modality , 2025 to 2035
  • Figure 75: South Asia and Pacific Market Attractiveness Analysis by Modality
  • Figure 76: South Asia and Pacific Market Value Share and BPS Analysis by Application, 2025 and 2035
  • Figure 77: South Asia and Pacific Market Y-o-Y Growth Comparison by Application, 2025 to 2035
  • Figure 78: South Asia and Pacific Market Attractiveness Analysis by Application
  • Figure 79: South Asia and Pacific Market Value Share and BPS Analysis by End User, 2025 and 2035
  • Figure 80: South Asia and Pacific Market Y-o-Y Growth Comparison by End User, 2025 to 2035
  • Figure 81: South Asia and Pacific Market Attractiveness Analysis by End User
  • Figure 82: Middle East & Africa Market Value Share and BPS Analysis by Country, 2025 and 2035
  • Figure 83: Middle East & Africa Market Value Share and BPS Analysis by Modality , 2025 and 2035
  • Figure 84: Middle East & Africa Market Y-o-Y Growth Comparison by Modality , 2025 to 2035
  • Figure 85: Middle East & Africa Market Attractiveness Analysis by Modality
  • Figure 86: Middle East & Africa Market Value Share and BPS Analysis by Application, 2025 and 2035
  • Figure 87: Middle East & Africa Market Y-o-Y Growth Comparison by Application, 2025 to 2035
  • Figure 88: Middle East & Africa Market Attractiveness Analysis by Application
  • Figure 89: Middle East & Africa Market Value Share and BPS Analysis by End User, 2025 and 2035
  • Figure 90: Middle East & Africa Market Y-o-Y Growth Comparison by End User, 2025 to 2035
  • Figure 91: Middle East & Africa Market Attractiveness Analysis by End User
  • Figure 92: Global Market – Tier Structure Analysis
  • Figure 93: Global Market – Company Share Analysis
Dashboard
Dashboard
Dashboard
Dashboard
Dashboard
Dashboard

Full Research Suite comprises of:

Market outlook & trends analysis

Market outlook & trends analysis

Interviews & case studies

Interviews & case studies

Strategic recommendations

Strategic recommendations

Vendor profiles & capabilities analysis

Vendor profiles & capabilities analysis

5-year forecasts

5-year forecasts

8 regions and 60+ country-level data splits

8 regions and 60+ country-level data splits

Market segment data splits

Market segment data splits

12 months of continuous data updates

12 months of continuous data updates

DELIVERED AS:

PDF EXCEL ONLINE

Full Research Suite


$5000

$7500

$10000

Buy Report Now
Similar Industry Reports

Similar Industry Reports

LCD Glass Market
LCD Glass Market

LCD Glass Market Size and Share Forecast Outlook 2025 to 2035

LCD TV Core Chip Market

LCD TV Core Chip Market Size and Share Forecast Outlook 2025 to 2035

Digital X-Ray Equipment Market

Digital X-Ray Equipment Market Size and Share Forecast Outlook 2025 to 2035

Digital Marketing Analytics Industry Analysis in Latin America

Digital Marketing Analytics Industry Analysis in Latin America Forecast Outlook 2025 to 2035

Digital Health Market

Digital Health Market Forecast and Outlook 2025 to 2035

Digital Pen Market
Digital Pen Market

Digital Pen Market Forecast and Outlook 2025 to 2035

Digital X-ray Market

Digital X-ray Market Size and Share Forecast Outlook 2025 to 2035

Digital Elevation Model Market

Digital Elevation Model Market Size and Share Forecast Outlook 2025 to 2035

Digital Pump Controller Market

Digital Pump Controller Market Size and Share Forecast Outlook 2025 to 2035

Digital Textile Printing Market

Digital Textile Printing Market Size and Share Forecast Outlook 2025 to 2035

Digital Printing Paper Market

Digital Printing Paper Market Size and Share Forecast Outlook 2025 to 2035

Digital Battlefield Market

Digital Battlefield Market Size and Share Forecast Outlook 2025 to 2035

Digital Product Passport Software Market

Digital Product Passport Software Market Size and Share Forecast Outlook 2025 to 2035

Digital Lending Platform Market

Digital Lending Platform Market Size and Share Forecast Outlook 2025 to 2035

Digital Shipyard Market

Digital Shipyard Market Size and Share Forecast Outlook 2025 to 2035

Digital Freight Matching Market

Digital Freight Matching Market Size and Share Forecast Outlook 2025 to 2035

Digital Textile Printer Market

Digital Textile Printer Market Size and Share Forecast Outlook 2025 to 2035

Digital Thermo Anemometer Market

Digital Thermo Anemometer Market Size and Share Forecast Outlook 2025 to 2035

Digital Twins Technologies Market

Digital Twins Technologies Market Size and Share Forecast Outlook 2025 to 2035

Digital Servo Motors and Drives Market

Digital Servo Motors and Drives Market Size and Share Forecast Outlook 2025 to 2035

Future Market Insights

LCD Digital Microscope Market

Chat With MaRIA

Chat With

MaRIA

Hi There, I am MaRIA, Your Market Research Intelligence Assistant. How may I help you?