The LC standard adapters market shows steady expansion, moving from USD 624.3 million in 2025 to USD 969.6 million by 2035, with a CAGR of 4.5%. The growth curve follows a linear upward trend, indicating consistent demand in telecommunications, data centers, and networking sectors. Early growth is supported by the increasing need for dependable fiber optic connections, especially in high-density environments where LC adapters reduce signal disruption. Gradual adoption is further encouraged by the expansion of broadband networks, cloud services, and high-speed data transmission, creating a stable foundation for market growth.
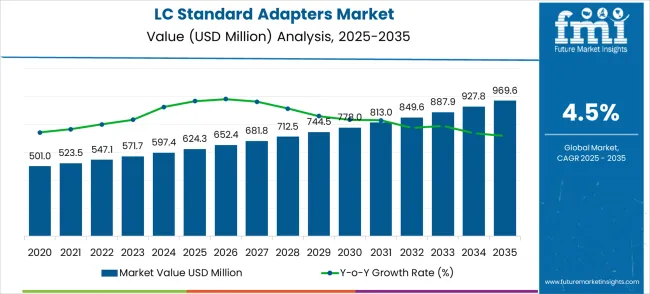
From 2030 to 2035, the curve maintains its steady slope, reflecting continued market uptake. Expansion in 5G networks, enterprise data centers, and communication infrastructure drives ongoing demand. Manufacturers are introducing low-loss, durable materials and modular designs that simplify installation and maintenance. The growth curve indicates predictable market progress, with minimal fluctuations. Steady demand across multiple applications provides suppliers with stable revenue opportunities and allows for targeted product improvements to meet evolving network and connectivity requirements.
| Metric | Value |
|---|---|
| Estimated Value in (2025E) | USD 624.3 million |
| Forecast Value in (2035F) | USD 969.6 million |
| Forecast CAGR (2025 to 2035) | 4.5% |
Emerging trends include low-loss, high-precision, and multi-fiber designs to address growing bandwidth requirements. Manufacturers are developing ruggedized and modular adapters suitable for enterprise, industrial, and telecommunication environments. Expansion in cloud data centers, 5G networks, and high-speed enterprise infrastructure is accelerating adoption. Advanced simulation and design optimization tools improve optical efficiency. Collaborations between component makers, network service providers, and OEMs support customized solutions for specific operational needs.
The LC standard adapters market is distributed across data center infrastructure at 38%, telecommunication networks at 27%, enterprise networking at 16%, fiber optic testing at 11%, and industrial or specialty applications at 8%. Data centers drive demand due to high-density connectivity needs and the requirement for low-loss, reliable fiber connections. Telecommunication networks utilize LC adapters to maintain signal integrity and support network scalability. Enterprise networking applications adopt them to simplify cabling and enhance operational efficiency. Fiber optic testing and measurement systems rely on adapters for accurate calibration and performance verification. Industrial and specialty applications include robotics, automation, and harsh-environment systems, where compact, high-performance adapters ensure consistent optical signal quality and reliable operation.
The LC standard adapters market represents a stable fiber optic connectivity segment driven by network standardization demands, data center expansion, and telecommunications infrastructure modernization. With the global market growing from USD 624.3 million in 2025 to USD 969.6 million by 2035 at a 4.5% CAGR, strategic opportunities emerge through high-density applications, 5G network integration, and geographic expansion in rapidly digitalizing economies. Data centers commanding USD 229.7 million in 2025, single-mode fiber dominance, and China's 6.1% growth rate reflect the essential role of standardized connectivity in ensuring network interoperability and reliable optical transmission.
The market benefits from ongoing digital transformation, cloud computing expansion, and the need for vendor-agnostic connectivity solutions. Single-mode fiber's market leadership demonstrates the preference for long-distance, high-bandwidth applications, while data center dominance signals the importance of standardized components in hyperscale infrastructure deployments.
Market expansion is being supported by the increasing global demand for standardized fiber optic connectivity and the corresponding need for interoperable optical components that can maintain consistent performance while providing reliable connection solutions across various network applications. Modern telecommunications providers and data center operators are increasingly focused on implementing connectivity solutions that can ensure network interoperability, reduce installation complexity, and provide consistent optical performance across different equipment vendors and network configurations. LC standard adapters' proven ability to deliver standardized connectivity, enhanced interoperability, and operational reliability makes them essential components for contemporary fiber optic network infrastructure and high-speed data transmission applications.
Network operator’s preference for components that combine standardization benefits with operational efficiency and cost-effectiveness is creating opportunities for innovative adapter implementations. The rising influence of cloud computing and distributed networking demands is also contributing to increased adoption of LC standard adapters that can provide reliable optical connections without compromising network flexibility or operational scalability.
The LC standard adapters market is projected to grow at a CAGR of 4.5%, driven by increasing demand for high-speed fiber optic connectivity and expanding data infrastructure. Single-mode adapters dominate the fiber type segment with around 63% of the market share, reflecting their use in long-distance transmission systems where insertion loss is typically 0.2–0.5 dB and return loss exceeds 50 dB. Multimode adapters cover the remaining 37%, primarily for short-reach connections under 500 meters. Data centers lead the application segment with about 50% of the market, driven by hyperscale deployments, high-density racks with 10–40 optical ports, and the need for low-latency, high-bandwidth connections in cloud and enterprise networks.
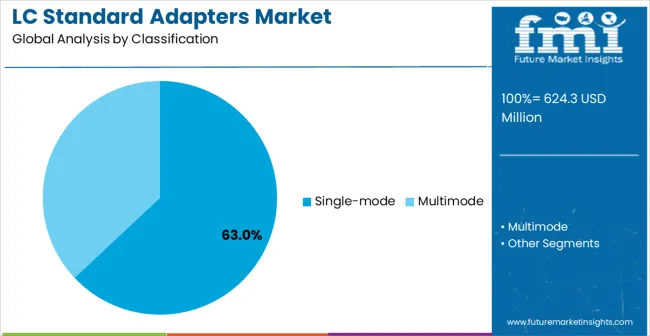
Single-mode LC adapters hold approximately 63% of the fiber type segment, making them the preferred solution for long-distance optical communication up to 80 km. They deliver low insertion loss (0.2–0.5 dB), high return loss (>50 dB), and maintain signal integrity across varying environmental conditions. Major manufacturers include Corning, Amphenol, TE Connectivity, and Senko Advanced Components. Single-mode adapters are widely used in metro, long-haul, and enterprise networks where precise fiber alignment is critical. Their support for high-density configurations and integration with automated fiber management systems ensures reliable, scalable network deployment.
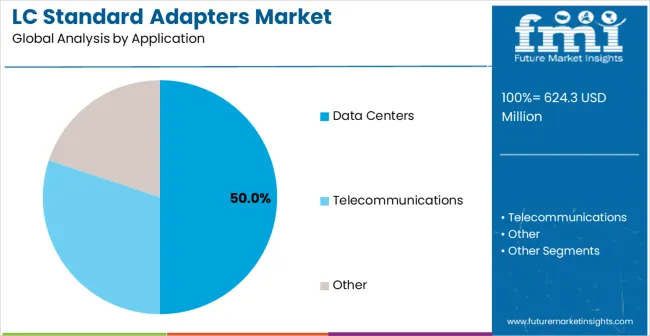
Data centers account for approximately 50% of the application market, representing the largest segment for LC standard adapters. Each hyperscale rack typically houses 10–40 optical ports, requiring precise and durable adapters to maintain low insertion loss and operational stability. Manufacturers such as Corning, Amphenol, TE Connectivity, and Senko Advanced Components provide solutions optimized for continuous high-speed operation. Segment growth is driven by the expansion of cloud services, adoption of 400G and 800G optical links, and the need to maintain network reliability above 99.999%. LC adapters in data centers help reduce downtime while supporting high-bandwidth connectivity and efficient data traffic management.
The LC standard adapters market is advancing steadily due to increasing demand for standardized fiber optic connectivity and growing adoption of interoperable networking components that provide consistent performance and reliable connections across diverse telecommunications applications. The market faces challenges, including competition from alternative connector technologies, price pressure from commodity optical components, and the need for continuous innovation to support emerging high-speed standards. Innovation in optical connector design and automated manufacturing continues to influence product development and market expansion patterns.
The growing deployment of standardized network infrastructure and multi-vendor equipment environments is driving demand for interoperable fiber optic connectivity solutions that can support consistent performance while enabling flexible network configurations and equipment integration. Advanced standardization initiatives provide improved network compatibility while allowing more efficient equipment procurement and reduced inventory complexity across various network operators and service providers. Manufacturers are increasingly recognizing the competitive advantages of standardization compliance for market expansion and customer adoption.
Modern LC standard adapter producers are incorporating advanced optical technologies and enhanced connector designs to improve signal transmission quality, reduce insertion loss, and ensure consistent performance for demanding network applications. These technologies improve network reliability while enabling new applications, including high-speed data transmission and advanced network architectures. Advanced optical integration also allows network operators to support enhanced performance requirements and future network evolution while maintaining standardization compliance.
| Country | CAGR (2025-2035) |
|---|---|
| China | 6.1% |
| India | 5.6% |
| Germany | 5.2% |
| Brazil | 4.7% |
| USA | 4.3% |
| UK | 3.8% |
| Japan | 3.4% |
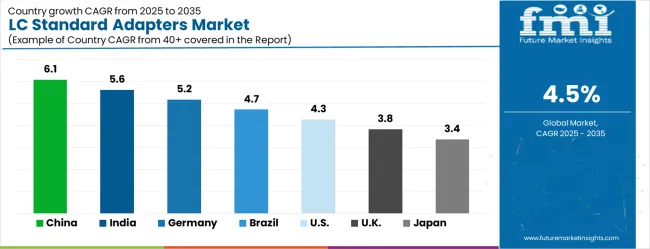
The LC standard adapters market is experiencing steady growth globally, with China leading at a 6.1% CAGR through 2035, driven by the expanding telecommunications infrastructure, growing data center construction, and significant investment in 5G network deployment. India follows at 5.6%, supported by rapid digital transformation initiatives, increasing fiber optic network expansion, and growing attention on telecommunications infrastructure development. Germany shows growth at 5.2%, emphasizing technological innovation and advanced optical networking solutions. Brazil records 4.7%, focusing on telecommunications modernization and digital infrastructure expansion. The USA demonstrates 4.3% growth, driven by data center expansion and network infrastructure upgrades. The UK exhibits 3.8% growth, supported by fiber optic network deployments and telecommunications infrastructure improvement. Japan shows 3.4% growth, emphasizing precision manufacturing and advanced optical component development.
The report covers an in-depth analysis of 40+ countries, Top-performing countries are highlighted below.
China leads with a 6.1% CAGR, above the global 4.5%. Adoption is concentrated in Guangdong, Jiangsu, and Zhejiang, which collectively account for nearly 55% of national installations. The telecom sector contributes 42% of demand, driven by 5G deployment and expansion of backbone fiber networks. Data center growth in Shanghai and Shenzhen represents 35% of adoption, supporting enterprise and hyperscale operations. Suppliers such as Amphenol, TE Connectivity, and local manufacturer FiberHome are providing adapters with insertion loss below 0.3 dB and durability exceeding 5000 mating cycles. Automated network testing and high-density patch panel integration are adopted in 28% of large-scale projects. Expansion of enterprise networking and smart city initiatives is expected to steady high CAGR through 2035.
India records a 5.6% CAGR, above global 4.5%. Adoption is concentrated in Maharashtra, Karnataka, and Tamil Nadu, accounting for 50% of total installations. The telecom sector, particularly fiber-to-the-home (FTTH) projects, represents 38% of demand, while data center expansion contributes 33%. Suppliers like Amphenol, Corning, and Sterlite Technologies are deploying adapters with insertion loss below 0.35 dB and >3000 mating cycles. High-density rack integration is applied in 26% of enterprise projects, while 5G metro fiber rollout drives network reliability upgrades. Government and private investments in cloud infrastructure are expected to maintain growth above the global average.
Germany shows a 5.2% CAGR, exceeding the global 4.5%. Adoption is concentrated in Bavaria, North Rhine-Westphalia, and Baden-Württemberg, representing 60% of installations. Industrial automation, smart manufacturing, and telecom networks account for 43% of demand. High-speed data centers in Frankfurt and Munich contribute 32% of adoption. Suppliers including TE Connectivity, Amphenol, and Rosenberger offer adapters with insertion loss <0.3 dB and reliability exceeding 4000 mating cycles. Industrial network upgrades and metro fiber expansions in 25% of large-scale projects drive growth. Adoption of adapters integrated with automated testing systems improves operational reliability.
Brazil has a 4.7% CAGR, slightly above the global 4.5%. Adoption is concentrated in São Paulo, Rio de Janeiro, and Minas Gerais, representing 50% of installations. Telecom modernization projects account for 37% of demand, while enterprise data centers drive 30%. Suppliers including TE Connectivity, Corning, and Furukawa Electric offer adapters with low insertion loss (<0.35 dB) and durability >3000 mating cycles. Metro fiber rollout in 22% of urban areas accelerates adoption, while tropical climate-resistant designs are applied in 28% of industrial networks. Demand is boosted by modernization of manufacturing facilities and energy sector networks.
The USA grows at 4.3% CAGR, slightly below the global 4.5%. Adoption is focused in California, Texas, and New York, which account for 55% of installations. Hyperscale data centers represent 40% of demand, while telecom 5G metro fiber contributes 35%. Suppliers including Corning, Amphenol, and Panduit provide adapters with insertion loss <0.3 dB and high mating cycle durability. High-density cabling integration is applied in 30% of enterprise networks, improving operational efficiency. Rising cloud services and corporate networking projects are key drivers despite slightly lower growth than global average.
The UK exhibits 3.8% CAGR, below global 4.5%. Adoption is concentrated in London, Manchester, and Birmingham, which represent 50% of installations. Telecom infrastructure expansion and enterprise networking account for 38% of demand. Suppliers like TE Connectivity, Amphenol, and CommScope provide adapters with insertion loss <0.35 dB and >3000 mating cycles. Fiber-to-the-building (FTTB) deployments in 25% of urban areas drive growth. Automated testing integration and high-density patch panels are implemented in 22% of networks to improve reliability. The adoption rate is restrained by slower expansion of metro fiber compared with Asia and Germany.
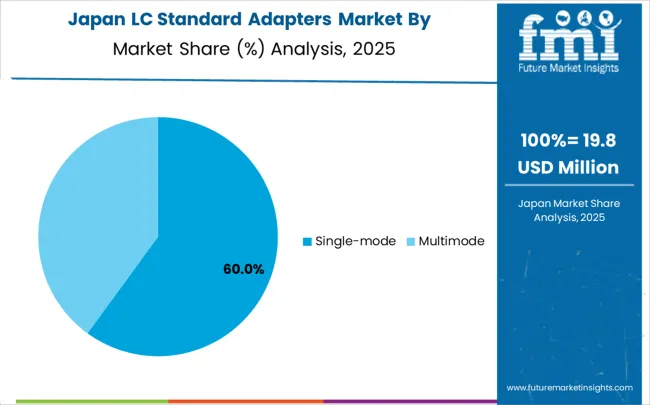
Japan records 3.4% CAGR, below global 4.5%. Adoption is concentrated in Tokyo, Osaka, and Kanagawa, representing 50% of installations. Telecom upgrades and industrial data centers drive 35% of demand, while enterprise networking contributes 30%. Suppliers including Corning, TE Connectivity, and JDSU offer compact adapters with low insertion loss (<0.3 dB) and >3500 mating cycles. Automated network testing is applied in 24% of large-scale projects, improving operational reliability. Market growth is restrained by slower metro fiber expansion and mature infrastructure compared with China and India.
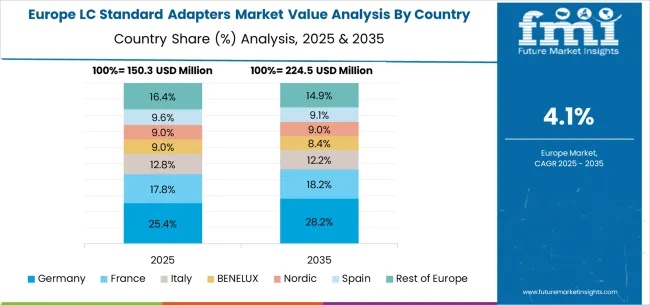
The LC standard adapters market in Europe is projected to grow from USD 145.0 million in 2025 to USD 225.3 million by 2035, registering a CAGR of 4.5% over the forecast period. Germany is expected to maintain its leadership position with a 29.7% market share in 2025, moderating slightly to 29.4% by 2035, supported by its strong telecommunications infrastructure, advanced optical networking capabilities, and comprehensive manufacturing networks serving major European markets.
The United Kingdom follows with a 23.2% share in 2025, projected to reach 23.4% by 2035, driven by robust fiber optic network deployment, established telecommunications infrastructure, and strong demand for standardized optical connectivity solutions across carrier and enterprise applications. France holds an 18.6% share in 2025, rising to 18.8% by 2035, supported by telecommunications modernization programs and increasing adoption of high-performance optical networking technologies in service provider networks. Italy records 12.1% in 2025, inching to 12.2% by 2035, with growth underpinned by telecommunications infrastructure improvement and increasing data center development activities. Spain contributes 9.4% in 2025, moving to 9.5% by 2035, supported by expanding fiber optic networks and telecommunications service enhancement programs. The Netherlands maintains a 3.1% share in 2025, growing to 3.2% by 2035. The Rest of Europe region, including Nordic countries, Eastern Europe, Belgium, Switzerland, and Austria, is anticipated to gain momentum, expanding its collective share from 3.9% to 3.5% by 2035, attributed to increasing adoption of standardized optical networking solutions in Nordic countries and growing telecommunications activities across Eastern European markets implementing infrastructure modernization programs.
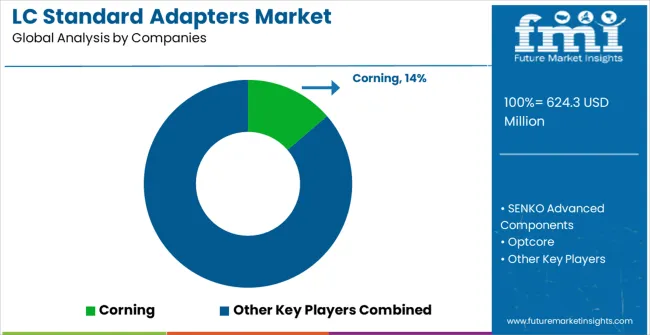
The LC standard adapters market is characterized by competition among established optical component manufacturers, specialized fiber optic connectivity providers, and integrated telecommunications solution companies. Companies are investing in advanced optical technology research, standardization compliance, precision manufacturing improvements, and comprehensive product portfolios to deliver consistent, high-performance, and reliable optical connectivity solutions. Innovation in optical connector design, automated manufacturing processes, and standardization technologies is central to strengthening market position and competitive advantage.
Corning leads the market with a strong market share, offering comprehensive optical connectivity solutions with a focus on advanced materials technology and standardization compliance capabilities. SENKO Advanced Components provides specialized fiber optic components with a focus on high-density applications and telecommunications markets. Optcore delivers innovative connectivity solutions with a focus on advanced optical networking and data center applications. Amphenol specializes in comprehensive connectivity products with focus on telecommunications infrastructure and network equipment integration. Molex focuses on optical networking components and integrated connectivity solutions for diverse market applications. Fibertronics offers specialized fiber optic connectivity systems with focus on telecommunications and enterprise environments.
| Items | Values |
|---|---|
| Quantitative Units (2025) | USD 624.3 million |
| Fiber Type | Single-mode, Multimode |
| Application | Data Centers, Telecommunications |
| Regions Covered | North America, Europe, East Asia, South Asia & Pacific, Latin America, Middle East & Africa |
| Countries Covered | United States, Canada, United Kingdom, Germany, France, China, Japan, South Korea, India, Brazil, Australia and 40+ countries |
| Key Companies Profiled | Corning, SENKO Advanced Components, Optcore, Amphenol, Molex, and Fibertronics |
| Additional Attributes | Dollar sales by fiber type and application category, regional demand trends, competitive landscape, technological advancements in optical connectivity, standardization compliance innovation, manufacturing automation development, and performance optimization |
The global LC standard adapters market is estimated to be valued at USD 624.3 million in 2025.
The market size for the LC standard adapters market is projected to reach USD 969.6 million by 2035.
The LC standard adapters market is expected to grow at a 4.5% CAGR between 2025 and 2035.
The key product types in LC standard adapters market are single-mode and multimode.
In terms of application, data centers segment to command 50.0% share in the LC standard adapters market in 2025.


Our Research Products

The "Full Research Suite" delivers actionable market intel, deep dives on markets or technologies, so clients act faster, cut risk, and unlock growth.

The Leaderboard benchmarks and ranks top vendors, classifying them as Established Leaders, Leading Challengers, or Disruptors & Challengers.

Locates where complements amplify value and substitutes erode it, forecasting net impact by horizon

We deliver granular, decision-grade intel: market sizing, 5-year forecasts, pricing, adoption, usage, revenue, and operational KPIs—plus competitor tracking, regulation, and value chains—across 60 countries broadly.

Spot the shifts before they hit your P&L. We track inflection points, adoption curves, pricing moves, and ecosystem plays to show where demand is heading, why it is changing, and what to do next across high-growth markets and disruptive tech

Real-time reads of user behavior. We track shifting priorities, perceptions of today’s and next-gen services, and provider experience, then pace how fast tech moves from trial to adoption, blending buyer, consumer, and channel inputs with social signals (#WhySwitch, #UX).

Partner with our analyst team to build a custom report designed around your business priorities. From analysing market trends to assessing competitors or crafting bespoke datasets, we tailor insights to your needs.
Supplier Intelligence
Discovery & Profiling
Capacity & Footprint
Performance & Risk
Compliance & Governance
Commercial Readiness
Who Supplies Whom
Scorecards & Shortlists
Playbooks & Docs
Category Intelligence
Definition & Scope
Demand & Use Cases
Cost Drivers
Market Structure
Supply Chain Map
Trade & Policy
Operating Norms
Deliverables
Buyer Intelligence
Account Basics
Spend & Scope
Procurement Model
Vendor Requirements
Terms & Policies
Entry Strategy
Pain Points & Triggers
Outputs
Pricing Analysis
Benchmarks
Trends
Should-Cost
Indexation
Landed Cost
Commercial Terms
Deliverables
Brand Analysis
Positioning & Value Prop
Share & Presence
Customer Evidence
Go-to-Market
Digital & Reputation
Compliance & Trust
KPIs & Gaps
Outputs
Full Research Suite comprises of:
Market outlook & trends analysis
Interviews & case studies
Strategic recommendations
Vendor profiles & capabilities analysis
5-year forecasts
8 regions and 60+ country-level data splits
Market segment data splits
12 months of continuous data updates
DELIVERED AS:
PDF EXCEL ONLINE
LC Fiber Optic Adapters Market Size and Share Forecast Outlook 2025 to 2035
LC Dust Shutter Adapters Market Size and Share Forecast Outlook 2025 to 2035
All-in-One LC Adapters Market Size and Share Forecast Outlook 2025 to 2035
Standard V Belts Market Size and Share Forecast Outlook 2025 to 2035
Standard Liner Market Size and Share Forecast Outlook 2025 to 2035
LCD Digital Microscope Market Size and Share Forecast Outlook 2025 to 2035
Standard High Precision Power Analyzers Market Size and Share Forecast Outlook 2025 to 2035
LCD Glass Market Size and Share Forecast Outlook 2025 to 2035
LCD TV Core Chip Market Size and Share Forecast Outlook 2025 to 2035
LCR Meters Market Analysis - Size, Share, and Forecast Outlook 2025 to 2035
Alcohol Packaging Market Forecast and Outlook 2025 to 2035
Alcoholic Drinks Packaging Market Size and Share Forecast Outlook 2025 to 2035
Alcohol Dehydrogenase Enzymes Market Size and Share Forecast Outlook 2025 to 2035
Alcohol Based Disinfectants Market Size and Share Forecast Outlook 2025 to 2035
Ulcerative Colitis Treatment Market Size and Share Forecast Outlook 2025 to 2035
Alcohol Ingredients Market Analysis - Size, Share, and Forecast Outlook 2025 to 2035
Alcoholic Flavors Market Size, Growth, and Forecast for 2025 to 2035
Ulcerated Necrobiosis Lipoidica Management Market Trends - Growth & Forecast 2025 to 2035
Alcoholic Hepatitis Treatment Market Analysis - Size, Share & Forecast 2025 to 2035
Alcohol Use Disorder Treatment Market Growth - Demand & Innovations 2025 to 2035

Thank you!
You will receive an email from our Business Development Manager. Please be sure to check your SPAM/JUNK folder too.
Chat With
MaRIA