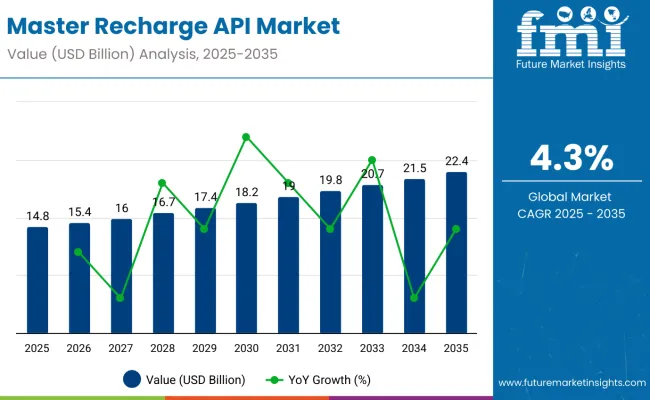
The master recharge API market is expected to grow steadily, reaching USD 14.8 billion in 2025 and USD 22.4 billion by 2035, at a CAGR of 4.3%. Prepaid mobile recharge continues to dominate as the leading service, with an estimated 32.8% market share in 2025. The rise of mobile penetration and smartphone adoption in emerging markets is driving the use of prepaid services, especially where consumers prefer pay-as-you-go models due to financial limitations or employment status.
| Attributes | Description |
|---|---|
| Estimated Global Master Recharge API Market Size (2025) | USD 14.8 billion |
| Projected Global Master Recharge API Market Size (2035) | USD 22.4 billion |
| Value-based CAGR (2025 to 2035) | 4.3% |
In addition to these growth drivers, recent industry developments are playing a pivotal role in shaping the market landscape. In November 2024, Mastercard launched Pay Local, a service enabling consumers to link their Mastercard credit or debit cards to participating local digital wallets. This integration allows consumers to make seamless card-based payments at over 35 million merchants worldwide, expanding the boundaries of digital payment acceptance.
Jorn Lambert, Mastercard’s Chief Product Officer, emphasized, “Mastercard continues to set new standards for the payments industry by offering global solutions that make a local impact. Our work with domestic networks and alternative payment methods underscores our dedication to delivering meaningful innovation.
With Mastercard Pay Local, we are expanding the boundaries of acceptance.” This development is part of Mastercard’s ongoing strategy to enhance digital payment accessibility and integrate traditional payment methods with evolving digital platforms. The initiative aims to make mobile recharge services more accessible, particularly in regions with growing digital wallet adoption, as mentioned in a press release by Mastercard
The continued rise of smartphone adoption is further catalyzing the demand for master recharge APIs, enabling seamless digital recharging processes. As consumers increasingly rely on mobile devices for communication, entertainment, and daily activities, the need for convenient and cost-effective recharge solutions becomes more pronounced. The expansion of mobile broadband networks in emerging regions is driving the demand for digital recharge services, providing greater access and convenience.
According to Statista, retailers and agents will continue to be major end-users in 2025, capturing 34.4% of the market share. This growth is attributed to the increasing number of micro-entrepreneurs providing recharge services in underserved areas, leveraging master recharge APIs to operate small-scale businesses. These businesses not only offer mobile recharge services but also bundle utility bill payments, ticketing services, and banking services-creating a robust ecosystem of essential services for customers.
As mobile service demands evolve, there is growing demand for multi-functional service points, where customers can access a wide variety of services under one roof. This trend is fostering the rise of agents and retailers who are becoming central hubs for mobile recharge and other essential services. This evolution in service models highlights a shift towards convenient and localized solutions for consumers.
The master recharge API market is rapidly evolving as companies leverage smart technologies to streamline and automate mobile recharge processes. These APIs enable seamless integration across multiple recharge services such as mobile, DTH, data cards, and utility payments. By incorporating features like real-time processing, multi-operator support, and automated refunds, these platforms enhance user experience while handling high transaction volumes efficiently. Catering to both B2B and B2C segments, leading providers are focused on delivering scalable, secure, and easy-to-integrate solutions that meet the diverse needs of modern digital payment ecosystems.
This table presents a numerical comparison of the master recharge API market growth and trends. For a thorough analysis of the industry’s anticipated growth, the CAGR has been analyzed in semi-annual intervals. This includes a comparison of the historical analysis period of 2024 to 2034 and the forecast period of 2025 to 2035.
| Particular | Value CAGR |
|---|---|
| H1 | 22.8% (2024 to 2034) |
| H2 | 23.5% (2024 to 2034) |
| H1 | 23% (2025 to 2035) |
| H2 | 23.7% (2025 to 2035) |
Industry’s expansion accelerated at a CAGR of 22.8% in the first half (H1) of the 2024 and 2034 period and then increased slightly to 23.5% in the second half (H2) of the same period. Throughout the projection period, which runs from H1 2025 to H2 2035, the CAGR is forecasted to initially increase to 23% before finally climbing to 23.7% in the second half.
The global master recharge API market is expected to experience significant growth driven by the increasing adoption of prepaid mobile recharge services and the expansion of retailers and agents as key end users. By 2025, prepaid mobile recharge services will represent 34.2% of the market, while retailers and agents will hold 35.7% share.
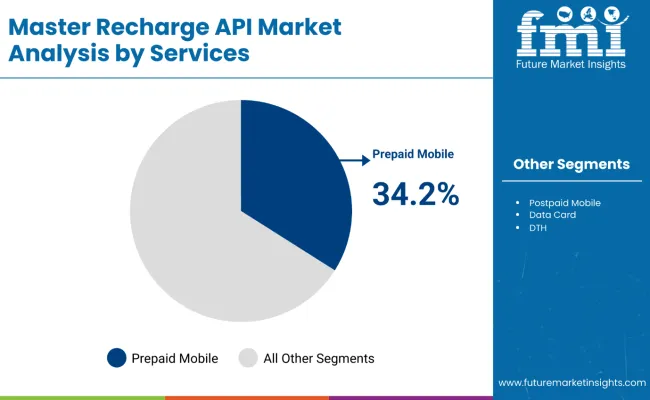
In 2025, prepaid mobile recharge services are projected to account for 34.2% of the global master recharge API market. In many emerging economies, the prepaid mobile tariff model is widely adopted due to the high number of individuals who prefer or rely on pay-as-you-go services. This is particularly true for populations with limited credit access or those employed in the informal sector. The expansion of mobile networks and the increasing penetration of smartphones in these regions have driven the demand for prepaid mobile recharge services.
As mobile services continue to grow, they significantly impact the master recharge API market by increasing the number of recharges processed daily. Prepaid services are also preferred for their flexibility and ease of use, especially for users who manage their spending or do not wish to commit to long-term contracts. The global increase in demand for prepaid mobile services, paired with advancements in technology, will continue to propel the growth of recharge API solutions that streamline and simplify the recharge process.
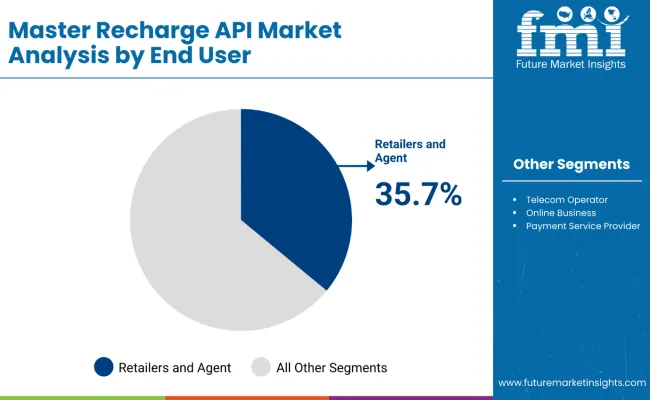
Retailers and agents are expected to hold 35.7% of the global market share for master recharge APIs by 2025. These end users provide an essential service to the growing demand for mobile recharges, utility bill payments, ticketing, and banking services. The concept of combining various services under one point of access has made these service points highly attractive to customers seeking convenience. The emergence of micro-entrepreneurs in both urban and rural areas has led to an increased number of agents offering mobile recharge services.
These micro-entrepreneurs use master recharge APIs to quickly set up small-scale recharge businesses, allowing them to serve local communities with on-demand mobile recharge solutions. As this entrepreneurial trend continues to expand, it positively impacts the growth of the master recharge API market, particularly in regions with limited infrastructure and high mobile service demand. The convenience of offering multiple services at one point has made these agents essential to the continued adoption and growth of mobile recharge services worldwide.
Subscription-based Recharge Services Gain Traction in the Industry
The subscription-based approach provides the benefits of automatic recurring charges. It is in line with the recent shift of consumers to subscription systems in multiple fields. The role of blockchain technology in securing Master Recharge API transactions is critical. Master recharge APIs help service providers to facilitate subscription recharges, meaning that clients can pay bills at regular intervals depending on the usage rates.
This trend helps in creating value for the users and also helping the business entities in terms of repeat business and revenues. Choosing the option of subscription-based recharge services is beneficial for providers and can be used to meet the needs of users who prefer to avoid any unexpected situation with the mobile recharge.
Importance of Enhanced Customer Support and Seld-service Options Surges in the Industry
Providing better customer service and self-services also become a significant factor for consideration in the master recharge API industry due to the heightened competition among companies to create more personalized experiences for clients.
Current contemporary measures in master recharge API are caballing premium customer support capabilities such as chatbots, AI inveterate assistants, and self-service portals that enable users to tackle problems and queries personally apace. This trend helps customers to be satisfied and retained as businesses shift focus to provide recharge APIs to their customers to meet their needs enthusiastically.
Emphasis on Data Security and Compliance Heightens for Businesses and Consumers Alike
With cyber threats and breaches on the rise, data protection and lack of compliance have become significant issues for corporations and individuals. Almost all the major master recharge API providers have incorporated SSL, SSL V2, SSL V3, encryption, tokenization and regulatory compliance measures to protect customer information. Firms with proper security standards and data protection measures are likely to gain customers' and partners’ trust. This emphasis can encourage the use of recharge APIs because of the emphasis on security as firms continue to advance in technology.
Tier 1 companies include the top leaders in the master recharge API industry, capturing around 59% of the global industry share. Leading brands like Paytm, Google Pay, Mobikwik, Oxigen, Freecharge, PhonePe, and Amazon Pay dominate this industry with their strong presence and quality offerings. They have a high recognition and are preferred by a vast array of users. They implement reward systems to incentivize frequent use of their platforms, which is attractive for users too.
Tier 2 companies include EzRecharge, MyRecharge, Euronet, Airtel Payments Bank, JioMoney, PayU, and ItzCash (now known as EbixCash). These companies occupy around 24% of the global industry share. They focus on customizing their services to meet the specific needs of different users, including language support and regional offers. They keep on enhancing their APIs to be more user-friendly, robust, and secure.
XPay Life, Suvidhaa, RechargeADDA, Pay1, Mswipe, JustRechargeIt, Finserv MARKETS, and Spice Money fall under the Tier 3 companies’ category. These growing companies are focusing on implementing sound security protocols to protect user data and transactions. They use data analytics to understand user behavior preferences. This helps them in tailoring services and marketing efforts.
This section gives insights into the master recharge API market forecast in top countries. Information on regions like North America, Europe, Asia Pacific, and others has been granulated, focusing on the top countries. Australia is expected to be at the forefront, expanding at a 7.8% CAGR until 2035. China follows next, expanding at a 4.8% CAGR until 2035. Lastly, the United States is also on the list, expanding at a 1.1% CAGR until 2035. This data indicates that the Asia Pacific region is likely to make remarkable progress in the coming years.
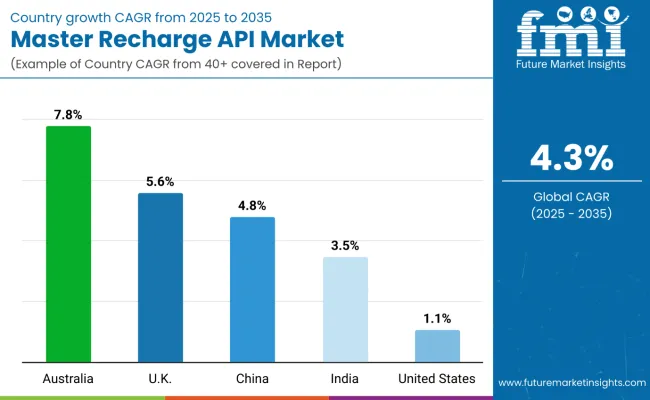
| Countries | Value CAGR (2025 to 2035) |
|---|---|
| Australia | 7.8% |
| China | 4.8% |
| United States | 1.1% |
The demand for master recharge API in Australia is anticipated to surge at a 7.8% CAGR until 2035. There has been a high adoption of digital technologies in the Australian economy especially in telecommunication and e-commerce. Digital channels remain the most popular method of recharging mobile balances due to the availability of online resources and applications.
Mobile payments, online banking, and other forms of touchless payments have become increasingly popular in Australia. This trend supports the industry’s development as more organizations resort to using online payment platforms to sell recharge services to the clients.
The demand for master recharge API in China is predicted to rise at a 4.8% CAGR till 2035. China is at the forefront of countries with the most potential for digital payment solutions, headed by Alipay and WeChat Pay. These two digital payment behemoths have incorporated several services such as mobile recharge into their respective platforms. Master Recharge APIs enable recharge functionalities to be incorporated into these digital payment players. Thus, enhancing the growth of the industry since most consumers prefer to recharge their balances via these familiar digital payment tools.
The master recharge API market growth in the United States is estimated at a 1.1% CAGR until 2035. Mobile payment solutions, online banking, and contactless transactions are popular and widely used across the United States. Apple Pay, Google Wallet, PayPal and other similar money services are rather popular, and integrating mobile payment services through master recharge APIs provides customers with comfort.
This trend improves the usage of mobile payment services and thus fuels the industry growth. There is also a growing convergence of recharge services with e-commerce giants such as Amazon, and digital platforms such as Uber. This integration is helpful in improving the user convenience and thus helps to boost the industry’s growth.
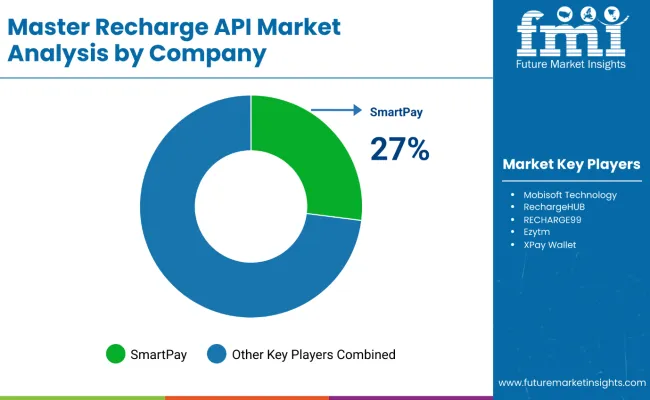
Considering the master recharge API market dynamics, it is essential to identify leaders and new entrants that can challenge them. Major master recharge API providers such as Ezetop (Ding) and Euronet Worldwide control vast networks and have efficient frameworks. Other emerging players are MyRecharge API and Ajira Pay, which target specific segments and provide affordable services and tailored products.
Establishments operating with innovation such as Xoxoday incorporate recharge services into larger systems. Competition is high and widespread and the key elements currently under competition pressure include price, service and quality delivered, and technological solutions.
| Report Attributes | Details |
|---|---|
| Industry Size (2025E) | USD 14.8 billion |
| Industry Size (2035F) | USD 22.4 billion |
| CAGR (2025 to 2035) | 4.3% |
| Base Year for Estimation | 2024 |
| Historical Period | 2020 to 2024 |
| Projections Period | 2025 to 2035 |
| Quantitative Units | USD billion for value |
| Services Analyzed (Segment 1) | Prepaid Mobile Recharge, Postpaid Mobile Recharge, Data Card, DTH, Electricity, Insurance, Others |
| End Users Analyzed (Segment 2) | Telecom Operators, Retailers and Agents, Online Businesses, Payment Service Providers, Others |
| Regions Covered | North America; Latin America; Europe; East Asia; South Asia & Pacific; Middle East & Africa (MEA) |
| Countries Covered | United States, Canada, Mexico, Germany, United Kingdom, France, Italy, Spain, China, Japan, South Korea, India, Australia, UAE, South Africa |
| Key Players influencing the Master Recharge API Market | Axis Softech Pvt Ltd, Cyrus Technoedge, Ezetop, Indian Web Technologies (IWT), LBS Software, MyRecharge, Pixyrs Softech, Pointer Soft Technologies, Recharge Handa |
| Additional Attributes | Dollar sales by service category (Prepaid vs. Postpaid), Role of online businesses in market growth, Payment service provider trends, Regional API usage gaps, End-user adoption patterns |
The industry has been classified into Prepaid Mobile Recharge, Postpaid Mobile Recharge, Data Card, DTH, Electricity, Insurance, and Others.
The sector is segmented into Telecom Operators, Retailers and Agents, Online Businesses, Payment Service Providers, and Others.
Analysis of the industry has been conducted in the countries of North America, Latin America, Europe, East Asia, South Asia & Pacific, Middle East & Africa (MEA).
Industry is set to reach USD 14.8 billion by 2025.
The industry is expected to reach USD 22.4 billion by 2035.
Industry is set to report a CAGR of 4.3% from 2025 to 2035.
Prepaid mobile recharge leads the industry, with 32.4% of industry shares captured in 2025.
The demand in Australia is expected to advance at a CAGR of 7.8% through 2035.


Full Research Suite comprises of:
Market outlook & trends analysis
Interviews & case studies
Strategic recommendations
Vendor profiles & capabilities analysis
5-year forecasts
8 regions and 60+ country-level data splits
Market segment data splits
12 months of continuous data updates
DELIVERED AS:
PDF EXCEL ONLINE
Master Recharge API Industry Analysis in Malaysia Size and Share Forecast Outlook 2025 to 2035
Masterbatch Market Size and Share Forecast Outlook 2025 to 2035
Stigmasterol-Rich Plant Sterols Market Analysis by Source and Application others Through 2035
Healthcare Master Data Management Market Size and Share Forecast Outlook 2025 to 2035
Flame Retardant Masterbatch Market Size and Share Forecast Outlook 2025 to 2035
Electronic Trial Master File (eTMF) System Market Size and Share Forecast Outlook 2025 to 2035
Oxygen Scavenger Masterbatch Market Size and Share Forecast Outlook 2025 to 2035
Automotive Brake Booster and Master Cylinder Market Size and Share Forecast Outlook 2025 to 2035
Rechargeable Thin Film Battery Market Size and Share Forecast Outlook 2025 to 2035
Rechargeable Light Market Size and Share Forecast Outlook 2025 to 2035
Rechargeable Tires Market Size and Share Forecast Outlook 2025 to 2035
Rechargeable Batteries Market
Non-rechargeable Thin Film Battery Market Size and Share Forecast Outlook 2025 to 2035
Apigenin Market Size and Share Forecast Outlook 2025 to 2035
API Monetization Platform Market by Component, Enterprise Size, Industry & Region Forecast till 2035
Rapid Microbiology Testing Market Forecast Outlook 2025 to 2035
Rapid Test Cards Market Size and Share Forecast Outlook 2025 to 2035
Rapid Prototyping Materials Market Size and Share Forecast Outlook 2025 to 2035
Rapid Test Readers Market Size and Share Forecast Outlook 2025 to 2035
Papillary Thyroid Cancer Market Size and Share Forecast Outlook 2025 to 2035

Thank you!
You will receive an email from our Business Development Manager. Please be sure to check your SPAM/JUNK folder too.
Chat With
MaRIA