Reports

- Global Locations -

Headquarters

Future Market Insights, Inc.

Christiana Corporate, 200
Continental Drive, Suite 401,
Newark, Delaware - 19713,
United States

T: +1-845-579-5705

Americas

Future Market Insights, Inc.

616 Corporate Way, Suite 2-9018,
Valley Cottage, NY 10989, United States

T: +1-347-918-3531

MEA

Future Market Insights

1602-6 Jumeirah Bay X2 Tower, Plot No: JLT-PH2-X2A,
Jumeirah Lakes Towers, Dubai,
United Arab Emirates

Europe

Future Market Insights

3rd Floor, 207 Regent Street,
W1B 3HH London
United Kingdom

T: + 44 (0) 20 8123 9659
D: +44 (0) 20 3287 4268

Asia Pacific

Future Market Insights

IndiaLand Global Tech Park, Unit UG-1, Behind Grand HighStreet, Phase 1, Hinjawadi, MH, Pune – 411057, India

Medical Cart Market Outlook for 2024 to 2034

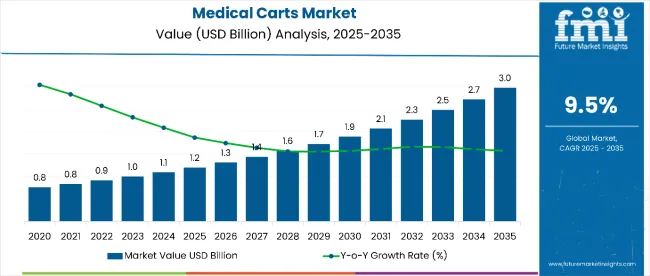
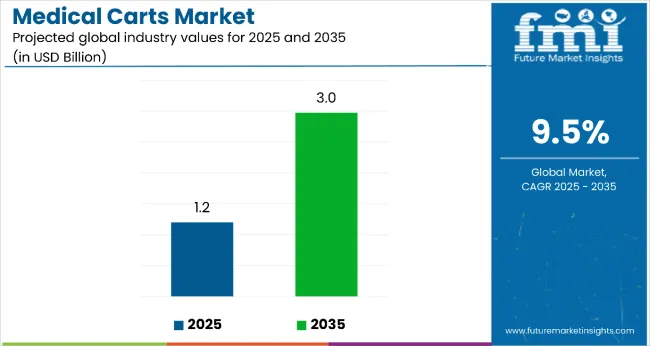
The medical cart market is valued at US$ 1,136.9 million in 2024 and is projected to reach US$ 2,759.69 million by 2034, exhibiting an outstanding CAGR of 9.3% over the forecast period.

Key Market Drivers

The medical cart market generated an estimated revenue of US$ 671.66 million in 2019. In the last five years, the market grew at a CAGR of 11.1% and added a revenue of US$ 465.24 million. Several reasons can be attributed to this growth:

  • The increasing adoption of digital healthcare solutions and electronic health records (EHR) requires mobile and technologically advanced medical carts.
  • Growing emphasis on providing patient care at the point of need drives the demand for medical carts that enable efficient point-of-care services.
  • Continuous innovation in medical cart technology, incorporating features such as IoT connectivity, touch screens, and automation, enhances functionality and usability in healthcare settings.
  • The expanding elderly population requires mobile healthcare solutions for improved accessibility to prompt and effective healthcare services.
  • Increasing incidences of chronic diseases, such as cancer, diabetes, and various cardiovascular diseases, necessitate mobile medical equipment.
  • Government regulations encourage the use of advanced medical equipment in healthcare settings.
  • Growing awareness among healthcare professionals about the benefits of medical carts enhances patient care and workflow efficiency.
Attributes Key Statistics
Medical Cart Market Value (2024) US$ 1,136.9 million
Anticipated Forecast Value (2034) US$ 2,759.69 million
CAGR (2024 to 2034) 9.3%

Don't pay for what you don't need

Customize your report by selecting specific countries or regions and save 30%!

Consumption Analysis of the Medical Cart Market

  • The adoption of medical carts in healthcare is touching the skies. Medical carts are widely used in hospitals for various purposes, such as medication administration, emergency response, and point-of-care services.
  • Medical carts have also gained immense popularity in nursing homes and long-term care facilities, where they are often used for medication distribution, vital sign monitoring, and other healthcare activities.
  • Medical carts are also in great demand among ambulatory surgical centers as they play a crucial role in facilitating surgical procedures by providing a mobile and organized platform for necessary equipment.
  • Sales of medical carts among emergency medical services have seen a tremendous rise in the last few years. These entities use specialized medical carts to deliver critical care and emergency interventions on the field.
  • Medical carts also find applications in dental offices, where they are used to organize and transport dental instruments, medications, and other necessary tools within their practice.

Factors Adversely Affecting the Medical Cart Market

The medical cart market is anticipated to surpass a global valuation of US$ 2,759.69 million by 2034. The market is projected to rise at a 9.30% CAGR. While the market is expected to experience remarkable growth, several restraining factors could adversely affect its development:

  • The significant upfront investment required for acquiring medical carts with advanced technology is the largest deterrent keeping small and medium healthcare facilities away from the market.
  • Integration of IoT connectivity and electronic features in medical carts raises concerns about data security and patient privacy, potentially hindering widespread adoption.
  • Resistance to change is another major factor adversely affecting market growth. Healthcare professional's hesitancy in adapting to new technologies impacts the seamless integration of advanced medical carts into existing workflows.
  • Limited space in healthcare facilities restricts the adoption of larger or more feature-rich medical carts, affecting their practicality in certain environments.
  • Insufficient training programs for healthcare staff on the proper use of advanced medical carts can lead to inefficiencies and errors, thus affecting the market adversely.
Sabyasachi Ghosh
Sabyasachi Ghosh

Principal Consultant

Talk to Analyst

Find your sweet spots for generating winning opportunities in this market.

Comparative View of Adjacent Industries

The section provides a comparative analysis of the medical cart market, the medical bed market, and the portable medical device market. The growth factors and critical challenges in respective markets have also been discussed below. Based on these numbers, the market for portable medical devices is anticipated to overpower the other two in the coming future. Medical Cart Market

Medical Cart Market:

Attributes Medical Cart Market
CAGR (2024 to 2034) 9.30%
Growth Factor Rising prevalence of chronic diseases and hospital infrastructure upgrades promoting the use of modern medical carts
Trend Increasing emphasis on ergonomic design and enhanced mobility features, allowing medical carts to navigate efficiently in healthcare settings.

Medical Bed Market:

Attributes Medical Bed Market
CAGR (2023 to 2033) 4.2%
Growth Factor The demand for bariatric medical beds continues to increase due to the rising obesity rates worldwide. They often feature oversized mattresses, more robust frames, and higher-weight capabilities.
Trend Growing environmental awareness is pushing the development of environmentally friendly and long-lasting medical bed materials and designs.

Portable Medical Devices Market:

Attributes Portable Medical Devices Market
CAGR (2023 to 2033) 10.7%
Growth Factor Increasing demand for on-the-go healthcare solutions, technological advancements enabling miniaturization, and a rising focus on remote patient monitoring and telehealth.
Trend Increasing adoption of portable devices for point-of-care testing, enabling rapid diagnostics and timely decision-making in various healthcare settings.

Category-wise Insights

Emergency Carts Gaining Impetus in the Healthcare Sector

Attributes Details
Top Product Type Emergency Carts
Market Share in 2024 27.90%

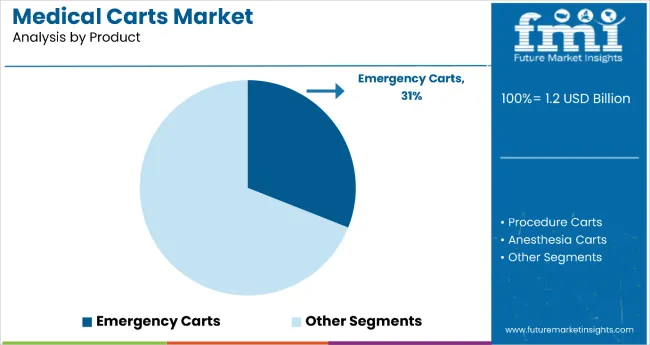
Depending on the product type, the medical cart market is bifurcated into emergency carts, procedure carts, anesthesia carts, computer medical carts, specialty carts, medication carts, etc. The emergency carts segment dominates the market and is anticipated to hold a share of 27.09% in 2024.

  • Time is a crucial factor during medical emergencies. Emergency carts, equipped with essential medical supplies and medications, enable healthcare professionals to respond to critical situations quickly.
  • Healthcare facilities also prefer emergency medical carts as they are designed to house crucial life-saving equipment, such as defibrillators, airway management devices, and emergency medications.
  • The preparedness of medical facilities also drives the demand for these telemedicine carts to embrace remote healthcare practices, improve accessibility to virtual consultations, and enhance patient care by integrating telemedicine technologies.
  • With an increase in acute care settings, including emergency rooms and critical care units, the demand for emergency carts has risen proportionally.
  • Their adoption rate in the past few years has also skyrocketed due to their versatility, making them a sought-after solution for healthcare facilities aiming to address diverse emergency scenarios effectively.

Demand for Medical Carts in Hospitals to Touch Skies in the Future

Attributes Details
End User Hospitals
Market Share 31.40%

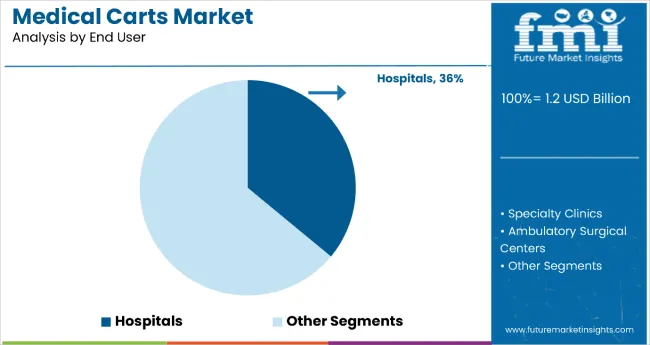
Based on end users, the medical cart market is categorized into hospitals, specialty clinics, ambulatory surgical centers, diagnostic centers, etc. The hospital segment dominates the market and is anticipated to hold 31.40% of the market share in 2024.

  • Hospitals are experiencing a growing demand for medical carts due to the increasing emphasis on delivering efficient and timely point-of-care services.
  • The adoption of advanced medical carts with integrated technologies is also driven by the need to streamline healthcare workflows.
  • The significance of medical carts in emergency response situations has led to a heightened demand as hospitals prioritize quick access to life-saving equipment and medications during critical incidents.

Get the data you need at a Fraction of the cost

Personalize your report by choosing insights you need
and save 40%!

Country-wise Insights

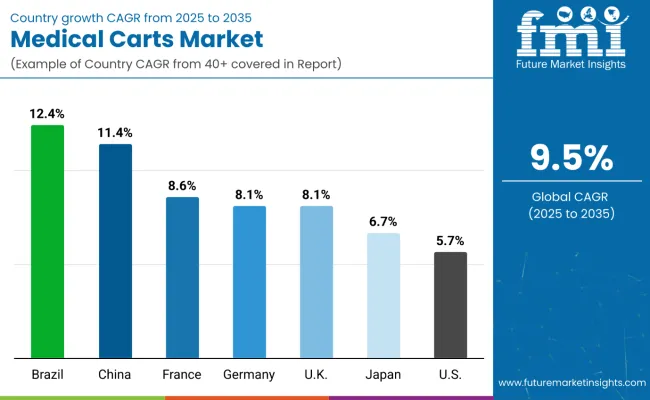
The section provides an analysis of the medical cart market by country, including India, China, the United States, Germany, and the United Kingdom. The table presents the CAGR for each country, indicating the expected growth of the market in that country through 2034.

Countries CAGR (2024 to 2034)
China 12.00%
India 10.40%
Germany 9.30%
United Kingdom 9.00%
United States 8.30%

Medical Cart Market in China

China is one of the leading countries in this market. The Chinese medical cart market is anticipated to retain its dominance by progressing at a CAGR of 12.00% till 2034.

  • The growing demand for advanced healthcare infrastructure in China is driving the market, as hospitals and healthcare facilities prioritize the adoption of modern medical carts to enhance patient care and streamline workflows.
  • Government initiatives aimed at modernizing the healthcare system in China have also created a significant demand for medical carts. Subsidies and incentives for adopting advanced medical equipment have further fueled the market's growth.

Medical Cart Market in India

The Indian medical cart market is anticipated to retain its dominance by progressing at an annual growth rate of 10.40% through 2034.

  • As India continues to increase investments in healthcare infrastructure, there is a growing demand for modern medical equipment, including medical carts. The significance of these carts in optimizing healthcare workflows has led to their increased adoption.
  • Besides this, government policies, such as Ayushman Bharat, Aam Aadmi Bima Yojana, etc., have significantly influenced the medical cart market by promoting accessibility and affordability of healthcare services.

Medical Cart Market in Germany

In the European region, Germany dominates the medical cart market. The German market is anticipated to exhibit an annual growth rate of 9.30% till 2034.

  • The German healthcare system's emphasis on efficiency and patient-centric care has fueled the demand for medical carts. These carts play a significant role in enhancing care delivery and meeting the evolving needs of healthcare facilities.
  • In the last few years, the inclination towards technological advancements in healthcare has contributed to substantial adoption of medical carts.

Medical Cart Market in the United Kingdom

The United Kingdom medical cart market is anticipated to register a CAGR of 9.00% through 2034.

  • The preference for delivering healthcare services at the point of care has led to a growing demand for medical carts in the United Kingdom as these carts facilitate efficient and immediate care delivery, aligning with the evolving preferences in healthcare.
  • The rising focus on infection control in the United Kingdom has increased the significance of medical carts with antimicrobial features. This demand for hygienic solutions is also driving sales of medical carts in the market.

Medical Cart Market in the United States

In the North American region, the United States leads the medical cart market. Over the next ten years, the demand for medical carts is projected to rise at a 15.20% CAGR in the country.

  • The rising prevalence of chronic diseases and the overall disease burden in the United States have intensified the need for effective and immediate healthcare interventions. Medical carts, equipped with necessary supplies, medications, and diagnostic tools, are instrumental in managing and addressing diverse medical conditions.
  • The United States’ prominence in medical tourism attracts patients from around the world. The demand for medical carts is bolstered by the need for modern and standardized equipment to maintain high-quality healthcare services and meet international standards in healthcare facilities catering to medical tourists.

Competitive Landscape

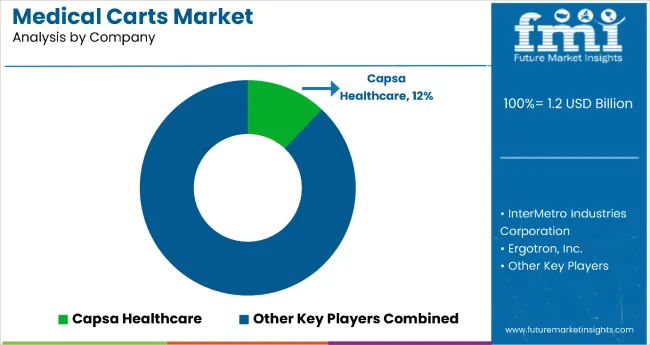
The medical cart market has key players like InterMetro Industries Corporation, Inc., Capsa Healthcare, Harloff Company, Waterloo Healthcare, Midmark Corporation, etc. These companies are investing heavily in incorporating advanced technologies like IoT connectivity, automation, and smart features to enhance the functionality of medical carts. They also collaborate with other companies or form joint ventures to pool resources and expertise.

Recent Developments

  • In October 2023, OSF HealthCare partnered with Summit Venture Studio to license and expand Medical Cart AR, an augmented reality training app developed by OSF Innovation. The app assists healthcare providers in swiftly locating key equipment during medical emergencies.
  • Top of FormI
  • n September 2023, the Louisville Metro Health Department generously donated medical carts to Jefferson County Public Schools (JCPS) high schools, including Waggener. The carts, equipped with vital supplies like epi-pens, asthma treatments, "stop the bleed" kits, and Narcan, aimed to enhance emergency preparedness.
  • In November 2022, Centura Health in Centennial, Colorado, enhanced its telehealth capabilities by integrating remote patient monitoring (RPM), medical carts, and Epic Electronic Health Record (EHR). The move aimed to align their digital strategy with EHR capabilities, facilitating comprehensive and evolving whole-person care.Top of Form

Key Companies in the Market

  • InterMetro Industries Corporation, Inc.
  • Capsa Healthcare
  • Harloff Company
  • Waterloo Healthcare
  • Midmark Corporation
  • Ergotron, Inc.
  • Enovate Medical
  • Armstrong Medical Industries, Inc.
  • Jaco, Inc.
  • ITD GmbH (ITD Medical Technology)
  • AFC Industries, Inc.
  • Medline Industries, Inc.
  • Advantech Co., Ltd.
  • MedViron, Inc.
  • Howard Industries, Inc.
  • The Bergmann Group
  • Pearson Medical Technologies, LLC
  • Medikar
  • Villard
  • CompuCaddy

Market Segmentation

By Product Type:

  • Emergency Carts
  • Procedure Carts
  • Anesthesia Carts
  • Computer Medical Carts
  • Specialty Carts
  • Medication Carts
  • Others

By Material Type:

  • Polymer
  • Steel
  • Aluminum

By Energy Source:

  • Powered
  • Non-powered

By End User:

  • Hospitals
  • Specialty Clinics
  • Ambulatory Surgical Centers
  • Diagnostic Centers
  • Rehab Centers
  • Nursing Homes
  • Homecare Settings

By Region:

  • North America
  • Latin America
  • Europe
  • Asia Pacific
  • Middle East and Africa

Frequently Asked Questions

How Big is the Medical Cart Market in 2024?

The medical cart market is expected to be worth US$ 1,136.9 million by 2024.

What is the Sales Forecast for Medical Carts through 2034?

The market for medical carts is expected to reach US$ 2,759.69 million by 2034.

At What Rate is the Medical Cart Market Expected to Grow?

The medical cart market is growing at a CAGR of 9.30% from 2024 to 2034.

Which are the Key Manufacturing Companies in the Market?

Some of the key players in the market are InterMetro Industries Corporation, Inc., Capsa Healthcare, Harloff Company, Waterloo Healthcare, Midmark Corporation, etc.

Which Product Type is Stimulating Market Growth?

Emergency carts are highly preferred medical carts, dominating the market with a 27.90% share.

Table of Content

1. Executive Summary

    1.1. Global Market Outlook

    1.2. Demand-side Trends

    1.3. Supply-side Trends

    1.4. Technology Roadmap Analysis

    1.5. Analysis and Recommendations

2. Market Overview

    2.1. Market Coverage / Taxonomy

    2.2. Market Definition / Scope / Limitations

3. Market Background

    3.1. Market Dynamics

        3.1.1. Drivers

        3.1.2. Restraints

        3.1.3. Opportunity

        3.1.4. Trends

    3.2. Scenario Forecast

        3.2.1. Demand in Optimistic Scenario

        3.2.2. Demand in Likely Scenario

        3.2.3. Demand in Conservative Scenario

    3.3. Opportunity Map Analysis

    3.4. Product Life Cycle Analysis

    3.5. Supply Chain Analysis

        3.5.1. Supply Side Participants and their Roles

            3.5.1.1. Producers

            3.5.1.2. Mid-Level Participants (Traders/ Agents/ Brokers)

            3.5.1.3. Wholesalers and Distributors

        3.5.2. Value Added and Value Created at Node in the Supply Chain

        3.5.3. List of Raw Material Suppliers

        3.5.4. List of Existing and Potential Buyer’s

    3.6. Investment Feasibility Matrix

    3.7. Value Chain Analysis

        3.7.1. Profit Margin Analysis

        3.7.2. Wholesalers and Distributors

        3.7.3. Retailers

    3.8. PESTLE and Porter’s Analysis

    3.9. Regulatory Landscape

        3.9.1. By Key Regions

        3.9.2. By Key Countries

    3.10. Regional Parent Market Outlook

    3.11. Production and Consumption Statistics

    3.12. Import and Export Statistics

4. Global Market Analysis 2019 to 2023 and Forecast, 2024 to 2034

    4.1. Historical Market Size Value (US$ Million) & Volume (Units) Analysis, 2019 to 2023

    4.2. Current and Future Market Size Value (US$ Million) & Volume (Units) Projections, 2024 to 2034

        4.2.1. Y-o-Y Growth Trend Analysis

        4.2.2. Absolute $ Opportunity Analysis

5. Global Market Analysis 2019 to 2023 and Forecast 2024 to 2034, By Product Type

    5.1. Introduction / Key Findings

    5.2. Historical Market Size Value (US$ Million) & Volume (Units) Analysis By Product Type, 2019 to 2023

    5.3. Current and Future Market Size Value (US$ Million) & Volume (Units) Analysis and Forecast By Product Type, 2024 to 2034

        5.3.1. Emergency Carts

        5.3.2. Procedure Cart

        5.3.3. Anaesthesia Cart

        5.3.4. Computer Medical Carts

        5.3.5. Specialty Carts

        5.3.6. Medication Carts

        5.3.7. Others

    5.4. Y-o-Y Growth Trend Analysis By Product Type, 2019 to 2023

    5.5. Absolute $ Opportunity Analysis By Product Type, 2024 to 2034

6. Global Market Analysis 2019 to 2023 and Forecast 2024 to 2034, By Material Type

    6.1. Introduction / Key Findings

    6.2. Historical Market Size Value (US$ Million) & Volume (Units) Analysis By Material Type, 2019 to 2023

    6.3. Current and Future Market Size Value (US$ Million) & Volume (Units) Analysis and Forecast By Material Type, 2024 to 2034

        6.3.1. Polymer

        6.3.2. Steel

        6.3.3. Aluminum

    6.4. Y-o-Y Growth Trend Analysis By Material Type, 2019 to 2023

    6.5. Absolute $ Opportunity Analysis By Material Type, 2024 to 2034

7. Global Market Analysis 2019 to 2023 and Forecast 2024 to 2034, By Energy Source

    7.1. Introduction / Key Findings

    7.2. Historical Market Size Value (US$ Million) & Volume (Units) Analysis By Energy Source, 2019 to 2023

    7.3. Current and Future Market Size Value (US$ Million) & Volume (Units) Analysis and Forecast By Energy Source, 2024 to 2034

        7.3.1. Powered

        7.3.2. Non-Powered

    7.4. Y-o-Y Growth Trend Analysis By Energy Source, 2019 to 2023

    7.5. Absolute $ Opportunity Analysis By Energy Source, 2024 to 2034

8. Global Market Analysis 2019 to 2023 and Forecast 2024 to 2034, By End User

    8.1. Introduction / Key Findings

    8.2. Historical Market Size Value (US$ Million) & Volume (Units) Analysis By End User, 2019 to 2023

    8.3. Current and Future Market Size Value (US$ Million) & Volume (Units) Analysis and Forecast By End User, 2024 to 2034

        8.3.1. Hospitals

        8.3.2. Specialty Clinics

        8.3.3. Ambulatory Surgical Centres

        8.3.4. Diagnostic Centres

        8.3.5. Rehab Centres

        8.3.6. Nursing Homes

        8.3.7. Homecare Settings

    8.4. Y-o-Y Growth Trend Analysis By End User, 2019 to 2023

    8.5. Absolute $ Opportunity Analysis By End User, 2024 to 2034

9. Global Market Analysis 2019 to 2023 and Forecast 2024 to 2034, By Region

    9.1. Introduction

    9.2. Historical Market Size Value (US$ Million) & Volume (Units) Analysis By Region, 2019 to 2023

    9.3. Current Market Size Value (US$ Million) & Volume (Units) Analysis and Forecast By Region, 2024 to 2034

        9.3.1. North America

        9.3.2. Latin America

        9.3.3. Western Europe

        9.3.4. Eastern Europe

        9.3.5. South Asia and Pacific

        9.3.6. East Asia

        9.3.7. Middle East and Africa

    9.4. Market Attractiveness Analysis By Region

10. North America Market Analysis 2019 to 2023 and Forecast 2024 to 2034, By Country

    10.1. Historical Market Size Value (US$ Million) & Volume (Units) Trend Analysis By Market Taxonomy, 2019 to 2023

    10.2. Market Size Value (US$ Million) & Volume (Units) Forecast By Market Taxonomy, 2024 to 2034

        10.2.1. By Country

            10.2.1.1. USA

            10.2.1.2. Canada

        10.2.2. By Product Type

        10.2.3. By Material Type

        10.2.4. By Energy Source

        10.2.5. By End User

    10.3. Market Attractiveness Analysis

        10.3.1. By Country

        10.3.2. By Product Type

        10.3.3. By Material Type

        10.3.4. By Energy Source

        10.3.5. By End User

    10.4. Key Takeaways

11. Latin America Market Analysis 2019 to 2023 and Forecast 2024 to 2034, By Country

    11.1. Historical Market Size Value (US$ Million) & Volume (Units) Trend Analysis By Market Taxonomy, 2019 to 2023

    11.2. Market Size Value (US$ Million) & Volume (Units) Forecast By Market Taxonomy, 2024 to 2034

        11.2.1. By Country

            11.2.1.1. Brazil

            11.2.1.2. Mexico

            11.2.1.3. Rest of Latin America

        11.2.2. By Product Type

        11.2.3. By Material Type

        11.2.4. By Energy Source

        11.2.5. By End User

    11.3. Market Attractiveness Analysis

        11.3.1. By Country

        11.3.2. By Product Type

        11.3.3. By Material Type

        11.3.4. By Energy Source

        11.3.5. By End User

    11.4. Key Takeaways

12. Western Europe Market Analysis 2019 to 2023 and Forecast 2024 to 2034, By Country

    12.1. Historical Market Size Value (US$ Million) & Volume (Units) Trend Analysis By Market Taxonomy, 2019 to 2023

    12.2. Market Size Value (US$ Million) & Volume (Units) Forecast By Market Taxonomy, 2024 to 2034

        12.2.1. By Country

            12.2.1.1. Germany

            12.2.1.2. UK

            12.2.1.3. France

            12.2.1.4. Spain

            12.2.1.5. Italy

            12.2.1.6. Rest of Western Europe

        12.2.2. By Product Type

        12.2.3. By Material Type

        12.2.4. By Energy Source

        12.2.5. By End User

    12.3. Market Attractiveness Analysis

        12.3.1. By Country

        12.3.2. By Product Type

        12.3.3. By Material Type

        12.3.4. By Energy Source

        12.3.5. By End User

    12.4. Key Takeaways

13. Eastern Europe Market Analysis 2019 to 2023 and Forecast 2024 to 2034, By Country

    13.1. Historical Market Size Value (US$ Million) & Volume (Units) Trend Analysis By Market Taxonomy, 2019 to 2023

    13.2. Market Size Value (US$ Million) & Volume (Units) Forecast By Market Taxonomy, 2024 to 2034

        13.2.1. By Country

            13.2.1.1. Poland

            13.2.1.2. Russia

            13.2.1.3. Czech Republic

            13.2.1.4. Romania

            13.2.1.5. Rest of Eastern Europe

        13.2.2. By Product Type

        13.2.3. By Material Type

        13.2.4. By Energy Source

        13.2.5. By End User

    13.3. Market Attractiveness Analysis

        13.3.1. By Country

        13.3.2. By Product Type

        13.3.3. By Material Type

        13.3.4. By Energy Source

        13.3.5. By End User

    13.4. Key Takeaways

14. South Asia and Pacific Market Analysis 2019 to 2023 and Forecast 2024 to 2034, By Country

    14.1. Historical Market Size Value (US$ Million) & Volume (Units) Trend Analysis By Market Taxonomy, 2019 to 2023

    14.2. Market Size Value (US$ Million) & Volume (Units) Forecast By Market Taxonomy, 2024 to 2034

        14.2.1. By Country

            14.2.1.1. India

            14.2.1.2. Bangladesh

            14.2.1.3. Australia

            14.2.1.4. New Zealand

            14.2.1.5. Rest of South Asia and Pacific

        14.2.2. By Product Type

        14.2.3. By Material Type

        14.2.4. By Energy Source

        14.2.5. By End User

    14.3. Market Attractiveness Analysis

        14.3.1. By Country

        14.3.2. By Product Type

        14.3.3. By Material Type

        14.3.4. By Energy Source

        14.3.5. By End User

    14.4. Key Takeaways

15. East Asia Market Analysis 2019 to 2023 and Forecast 2024 to 2034, By Country

    15.1. Historical Market Size Value (US$ Million) & Volume (Units) Trend Analysis By Market Taxonomy, 2019 to 2023

    15.2. Market Size Value (US$ Million) & Volume (Units) Forecast By Market Taxonomy, 2024 to 2034

        15.2.1. By Country

            15.2.1.1. China

            15.2.1.2. Japan

            15.2.1.3. South Korea

        15.2.2. By Product Type

        15.2.3. By Material Type

        15.2.4. By Energy Source

        15.2.5. By End User

    15.3. Market Attractiveness Analysis

        15.3.1. By Country

        15.3.2. By Product Type

        15.3.3. By Material Type

        15.3.4. By Energy Source

        15.3.5. By End User

    15.4. Key Takeaways

16. Middle East and Africa Market Analysis 2019 to 2023 and Forecast 2024 to 2034, By Country

    16.1. Historical Market Size Value (US$ Million) & Volume (Units) Trend Analysis By Market Taxonomy, 2019 to 2023

    16.2. Market Size Value (US$ Million) & Volume (Units) Forecast By Market Taxonomy, 2024 to 2034

        16.2.1. By Country

            16.2.1.1. GCC Countries

            16.2.1.2. South Africa

            16.2.1.3. Israel

            16.2.1.4. Rest of MEA

        16.2.2. By Product Type

        16.2.3. By Material Type

        16.2.4. By Energy Source

        16.2.5. By End User

    16.3. Market Attractiveness Analysis

        16.3.1. By Country

        16.3.2. By Product Type

        16.3.3. By Material Type

        16.3.4. By Energy Source

        16.3.5. By End User

    16.4. Key Takeaways

17. Key Countries Market Analysis

    17.1. USA

        17.1.1. Pricing Analysis

        17.1.2. Market Share Analysis, 2023

            17.1.2.1. By Product Type

            17.1.2.2. By Material Type

            17.1.2.3. By Energy Source

            17.1.2.4. By End User

    17.2. Canada

        17.2.1. Pricing Analysis

        17.2.2. Market Share Analysis, 2023

            17.2.2.1. By Product Type

            17.2.2.2. By Material Type

            17.2.2.3. By Energy Source

            17.2.2.4. By End User

    17.3. Brazil

        17.3.1. Pricing Analysis

        17.3.2. Market Share Analysis, 2023

            17.3.2.1. By Product Type

            17.3.2.2. By Material Type

            17.3.2.3. By Energy Source

            17.3.2.4. By End User

    17.4. Mexico

        17.4.1. Pricing Analysis

        17.4.2. Market Share Analysis, 2023

            17.4.2.1. By Product Type

            17.4.2.2. By Material Type

            17.4.2.3. By Energy Source

            17.4.2.4. By End User

    17.5. Germany

        17.5.1. Pricing Analysis

        17.5.2. Market Share Analysis, 2023

            17.5.2.1. By Product Type

            17.5.2.2. By Material Type

            17.5.2.3. By Energy Source

            17.5.2.4. By End User

    17.6. UK

        17.6.1. Pricing Analysis

        17.6.2. Market Share Analysis, 2023

            17.6.2.1. By Product Type

            17.6.2.2. By Material Type

            17.6.2.3. By Energy Source

            17.6.2.4. By End User

    17.7. France

        17.7.1. Pricing Analysis

        17.7.2. Market Share Analysis, 2023

            17.7.2.1. By Product Type

            17.7.2.2. By Material Type

            17.7.2.3. By Energy Source

            17.7.2.4. By End User

    17.8. Spain

        17.8.1. Pricing Analysis

        17.8.2. Market Share Analysis, 2023

            17.8.2.1. By Product Type

            17.8.2.2. By Material Type

            17.8.2.3. By Energy Source

            17.8.2.4. By End User

    17.9. Italy

        17.9.1. Pricing Analysis

        17.9.2. Market Share Analysis, 2023

            17.9.2.1. By Product Type

            17.9.2.2. By Material Type

            17.9.2.3. By Energy Source

            17.9.2.4. By End User

    17.10. Poland

        17.10.1. Pricing Analysis

        17.10.2. Market Share Analysis, 2023

            17.10.2.1. By Product Type

            17.10.2.2. By Material Type

            17.10.2.3. By Energy Source

            17.10.2.4. By End User

    17.11. Russia

        17.11.1. Pricing Analysis

        17.11.2. Market Share Analysis, 2023

            17.11.2.1. By Product Type

            17.11.2.2. By Material Type

            17.11.2.3. By Energy Source

            17.11.2.4. By End User

    17.12. Czech Republic

        17.12.1. Pricing Analysis

        17.12.2. Market Share Analysis, 2023

            17.12.2.1. By Product Type

            17.12.2.2. By Material Type

            17.12.2.3. By Energy Source

            17.12.2.4. By End User

    17.13. Romania

        17.13.1. Pricing Analysis

        17.13.2. Market Share Analysis, 2023

            17.13.2.1. By Product Type

            17.13.2.2. By Material Type

            17.13.2.3. By Energy Source

            17.13.2.4. By End User

    17.14. India

        17.14.1. Pricing Analysis

        17.14.2. Market Share Analysis, 2023

            17.14.2.1. By Product Type

            17.14.2.2. By Material Type

            17.14.2.3. By Energy Source

            17.14.2.4. By End User

    17.15. Bangladesh

        17.15.1. Pricing Analysis

        17.15.2. Market Share Analysis, 2023

            17.15.2.1. By Product Type

            17.15.2.2. By Material Type

            17.15.2.3. By Energy Source

            17.15.2.4. By End User

    17.16. Australia

        17.16.1. Pricing Analysis

        17.16.2. Market Share Analysis, 2023

            17.16.2.1. By Product Type

            17.16.2.2. By Material Type

            17.16.2.3. By Energy Source

            17.16.2.4. By End User

    17.17. New Zealand

        17.17.1. Pricing Analysis

        17.17.2. Market Share Analysis, 2023

            17.17.2.1. By Product Type

            17.17.2.2. By Material Type

            17.17.2.3. By Energy Source

            17.17.2.4. By End User

    17.18. China

        17.18.1. Pricing Analysis

        17.18.2. Market Share Analysis, 2023

            17.18.2.1. By Product Type

            17.18.2.2. By Material Type

            17.18.2.3. By Energy Source

            17.18.2.4. By End User

    17.19. Japan

        17.19.1. Pricing Analysis

        17.19.2. Market Share Analysis, 2023

            17.19.2.1. By Product Type

            17.19.2.2. By Material Type

            17.19.2.3. By Energy Source

            17.19.2.4. By End User

    17.20. South Korea

        17.20.1. Pricing Analysis

        17.20.2. Market Share Analysis, 2023

            17.20.2.1. By Product Type

            17.20.2.2. By Material Type

            17.20.2.3. By Energy Source

            17.20.2.4. By End User

    17.21. GCC Countries

        17.21.1. Pricing Analysis

        17.21.2. Market Share Analysis, 2023

            17.21.2.1. By Product Type

            17.21.2.2. By Material Type

            17.21.2.3. By Energy Source

            17.21.2.4. By End User

    17.22. South Africa

        17.22.1. Pricing Analysis

        17.22.2. Market Share Analysis, 2023

            17.22.2.1. By Product Type

            17.22.2.2. By Material Type

            17.22.2.3. By Energy Source

            17.22.2.4. By End User

    17.23. Israel

        17.23.1. Pricing Analysis

        17.23.2. Market Share Analysis, 2023

            17.23.2.1. By Product Type

            17.23.2.2. By Material Type

            17.23.2.3. By Energy Source

            17.23.2.4. By End User

18. Market Structure Analysis

    18.1. Competition Dashboard

    18.2. Competition Benchmarking

    18.3. Market Share Analysis of Top Players

        18.3.1. By Regional

        18.3.2. By Product Type

        18.3.3. By Material Type

        18.3.4. By Energy Source

        18.3.5. By End User

19. Competition Analysis

    19.1. Competition Deep Dive

        19.1.1. InterMetro Industries Corporation, Inc.

            19.1.1.1. Overview

            19.1.1.2. Product Portfolio

            19.1.1.3. Profitability by Market Segments

            19.1.1.4. Sales Footprint

            19.1.1.5. Strategy Overview

                19.1.1.5.1. Marketing Strategy

                19.1.1.5.2. Product Strategy

                19.1.1.5.3. Channel Strategy

        19.1.2. Capsa Healthcare

            19.1.2.1. Overview

            19.1.2.2. Product Portfolio

            19.1.2.3. Profitability by Market Segments

            19.1.2.4. Sales Footprint

            19.1.2.5. Strategy Overview

                19.1.2.5.1. Marketing Strategy

                19.1.2.5.2. Product Strategy

                19.1.2.5.3. Channel Strategy

        19.1.3. Harloff Company

            19.1.3.1. Overview

            19.1.3.2. Product Portfolio

            19.1.3.3. Profitability by Market Segments

            19.1.3.4. Sales Footprint

            19.1.3.5. Strategy Overview

                19.1.3.5.1. Marketing Strategy

                19.1.3.5.2. Product Strategy

                19.1.3.5.3. Channel Strategy

        19.1.4. Waterloo Healthcare

            19.1.4.1. Overview

            19.1.4.2. Product Portfolio

            19.1.4.3. Profitability by Market Segments

            19.1.4.4. Sales Footprint

            19.1.4.5. Strategy Overview

                19.1.4.5.1. Marketing Strategy

                19.1.4.5.2. Product Strategy

                19.1.4.5.3. Channel Strategy

        19.1.5. Midmark Corporation

            19.1.5.1. Overview

            19.1.5.2. Product Portfolio

            19.1.5.3. Profitability by Market Segments

            19.1.5.4. Sales Footprint

            19.1.5.5. Strategy Overview

                19.1.5.5.1. Marketing Strategy

                19.1.5.5.2. Product Strategy

                19.1.5.5.3. Channel Strategy

        19.1.6. AFC Industries, Inc.

            19.1.6.1. Overview

            19.1.6.2. Product Portfolio

            19.1.6.3. Profitability by Market Segments

            19.1.6.4. Sales Footprint

            19.1.6.5. Strategy Overview

                19.1.6.5.1. Marketing Strategy

                19.1.6.5.2. Product Strategy

                19.1.6.5.3. Channel Strategy

        19.1.7. Ergotron, Inc.

            19.1.7.1. Overview

            19.1.7.2. Product Portfolio

            19.1.7.3. Profitability by Market Segments

            19.1.7.4. Sales Footprint

            19.1.7.5. Strategy Overview

                19.1.7.5.1. Marketing Strategy

                19.1.7.5.2. Product Strategy

                19.1.7.5.3. Channel Strategy

        19.1.8. Jaco, Inc.

            19.1.8.1. Overview

            19.1.8.2. Product Portfolio

            19.1.8.3. Profitability by Market Segments

            19.1.8.4. Sales Footprint

            19.1.8.5. Strategy Overview

                19.1.8.5.1. Marketing Strategy

                19.1.8.5.2. Product Strategy

                19.1.8.5.3. Channel Strategy

        19.1.9. Alimed Inc.

            19.1.9.1. Overview

            19.1.9.2. Product Portfolio

            19.1.9.3. Profitability by Market Segments

            19.1.9.4. Sales Footprint

            19.1.9.5. Strategy Overview

                19.1.9.5.1. Marketing Strategy

                19.1.9.5.2. Product Strategy

                19.1.9.5.3. Channel Strategy

        19.1.10. Advantech Co. Ltd.

            19.1.10.1. Overview

            19.1.10.2. Product Portfolio

            19.1.10.3. Profitability by Market Segments

            19.1.10.4. Sales Footprint

            19.1.10.5. Strategy Overview

                19.1.10.5.1. Marketing Strategy

                19.1.10.5.2. Product Strategy

                19.1.10.5.3. Channel Strategy

20. Assumptions & Acronyms Used

21. Research Methodology

Don't pay for what you don't need

Customize your report by selecting specific countries or regions and save 30%!

List of Tables

Table 1: Global Market Value (US$ Million) Forecast by Region, 2019 to 2034

Table 2: Global Market Volume (Units) Forecast by Region, 2019 to 2034

Table 3: Global Market Value (US$ Million) Forecast by Product Type, 2019 to 2034

Table 4: Global Market Volume (Units) Forecast by Product Type, 2019 to 2034

Table 5: Global Market Value (US$ Million) Forecast by Material Type, 2019 to 2034

Table 6: Global Market Volume (Units) Forecast by Material Type, 2019 to 2034

Table 7: Global Market Value (US$ Million) Forecast by Energy Source, 2019 to 2034

Table 8: Global Market Volume (Units) Forecast by Energy Source, 2019 to 2034

Table 9: Global Market Value (US$ Million) Forecast by End User, 2019 to 2034

Table 10: Global Market Volume (Units) Forecast by End User, 2019 to 2034

Table 11: North America Market Value (US$ Million) Forecast by Country, 2019 to 2034

Table 12: North America Market Volume (Units) Forecast by Country, 2019 to 2034

Table 13: North America Market Value (US$ Million) Forecast by Product Type, 2019 to 2034

Table 14: North America Market Volume (Units) Forecast by Product Type, 2019 to 2034

Table 15: North America Market Value (US$ Million) Forecast by Material Type, 2019 to 2034

Table 16: North America Market Volume (Units) Forecast by Material Type, 2019 to 2034

Table 17: North America Market Value (US$ Million) Forecast by Energy Source, 2019 to 2034

Table 18: North America Market Volume (Units) Forecast by Energy Source, 2019 to 2034

Table 19: North America Market Value (US$ Million) Forecast by End User, 2019 to 2034

Table 20: North America Market Volume (Units) Forecast by End User, 2019 to 2034

Table 21: Latin America Market Value (US$ Million) Forecast by Country, 2019 to 2034

Table 22: Latin America Market Volume (Units) Forecast by Country, 2019 to 2034

Table 23: Latin America Market Value (US$ Million) Forecast by Product Type, 2019 to 2034

Table 24: Latin America Market Volume (Units) Forecast by Product Type, 2019 to 2034

Table 25: Latin America Market Value (US$ Million) Forecast by Material Type, 2019 to 2034

Table 26: Latin America Market Volume (Units) Forecast by Material Type, 2019 to 2034

Table 27: Latin America Market Value (US$ Million) Forecast by Energy Source, 2019 to 2034

Table 28: Latin America Market Volume (Units) Forecast by Energy Source, 2019 to 2034

Table 29: Latin America Market Value (US$ Million) Forecast by End User, 2019 to 2034

Table 30: Latin America Market Volume (Units) Forecast by End User, 2019 to 2034

Table 31: Western Europe Market Value (US$ Million) Forecast by Country, 2019 to 2034

Table 32: Western Europe Market Volume (Units) Forecast by Country, 2019 to 2034

Table 33: Western Europe Market Value (US$ Million) Forecast by Product Type, 2019 to 2034

Table 34: Western Europe Market Volume (Units) Forecast by Product Type, 2019 to 2034

Table 35: Western Europe Market Value (US$ Million) Forecast by Material Type, 2019 to 2034

Table 36: Western Europe Market Volume (Units) Forecast by Material Type, 2019 to 2034

Table 37: Western Europe Market Value (US$ Million) Forecast by Energy Source, 2019 to 2034

Table 38: Western Europe Market Volume (Units) Forecast by Energy Source, 2019 to 2034

Table 39: Western Europe Market Value (US$ Million) Forecast by End User, 2019 to 2034

Table 40: Western Europe Market Volume (Units) Forecast by End User, 2019 to 2034

Table 41: Eastern Europe Market Value (US$ Million) Forecast by Country, 2019 to 2034

Table 42: Eastern Europe Market Volume (Units) Forecast by Country, 2019 to 2034

Table 43: Eastern Europe Market Value (US$ Million) Forecast by Product Type, 2019 to 2034

Table 44: Eastern Europe Market Volume (Units) Forecast by Product Type, 2019 to 2034

Table 45: Eastern Europe Market Value (US$ Million) Forecast by Material Type, 2019 to 2034

Table 46: Eastern Europe Market Volume (Units) Forecast by Material Type, 2019 to 2034

Table 47: Eastern Europe Market Value (US$ Million) Forecast by Energy Source, 2019 to 2034

Table 48: Eastern Europe Market Volume (Units) Forecast by Energy Source, 2019 to 2034

Table 49: Eastern Europe Market Value (US$ Million) Forecast by End User, 2019 to 2034

Table 50: Eastern Europe Market Volume (Units) Forecast by End User, 2019 to 2034

Table 51: South Asia and Pacific Market Value (US$ Million) Forecast by Country, 2019 to 2034

Table 52: South Asia and Pacific Market Volume (Units) Forecast by Country, 2019 to 2034

Table 53: South Asia and Pacific Market Value (US$ Million) Forecast by Product Type, 2019 to 2034

Table 54: South Asia and Pacific Market Volume (Units) Forecast by Product Type, 2019 to 2034

Table 55: South Asia and Pacific Market Value (US$ Million) Forecast by Material Type, 2019 to 2034

Table 56: South Asia and Pacific Market Volume (Units) Forecast by Material Type, 2019 to 2034

Table 57: South Asia and Pacific Market Value (US$ Million) Forecast by Energy Source, 2019 to 2034

Table 58: South Asia and Pacific Market Volume (Units) Forecast by Energy Source, 2019 to 2034

Table 59: South Asia and Pacific Market Value (US$ Million) Forecast by End User, 2019 to 2034

Table 60: South Asia and Pacific Market Volume (Units) Forecast by End User, 2019 to 2034

Table 61: East Asia Market Value (US$ Million) Forecast by Country, 2019 to 2034

Table 62: East Asia Market Volume (Units) Forecast by Country, 2019 to 2034

Table 63: East Asia Market Value (US$ Million) Forecast by Product Type, 2019 to 2034

Table 64: East Asia Market Volume (Units) Forecast by Product Type, 2019 to 2034

Table 65: East Asia Market Value (US$ Million) Forecast by Material Type, 2019 to 2034

Table 66: East Asia Market Volume (Units) Forecast by Material Type, 2019 to 2034

Table 67: East Asia Market Value (US$ Million) Forecast by Energy Source, 2019 to 2034

Table 68: East Asia Market Volume (Units) Forecast by Energy Source, 2019 to 2034

Table 69: East Asia Market Value (US$ Million) Forecast by End User, 2019 to 2034

Table 70: East Asia Market Volume (Units) Forecast by End User, 2019 to 2034

Table 71: Middle East and Africa Market Value (US$ Million) Forecast by Country, 2019 to 2034

Table 72: Middle East and Africa Market Volume (Units) Forecast by Country, 2019 to 2034

Table 73: Middle East and Africa Market Value (US$ Million) Forecast by Product Type, 2019 to 2034

Table 74: Middle East and Africa Market Volume (Units) Forecast by Product Type, 2019 to 2034

Table 75: Middle East and Africa Market Value (US$ Million) Forecast by Material Type, 2019 to 2034

Table 76: Middle East and Africa Market Volume (Units) Forecast by Material Type, 2019 to 2034

Table 77: Middle East and Africa Market Value (US$ Million) Forecast by Energy Source, 2019 to 2034

Table 78: Middle East and Africa Market Volume (Units) Forecast by Energy Source, 2019 to 2034

Table 79: Middle East and Africa Market Value (US$ Million) Forecast by End User, 2019 to 2034

Table 80: Middle East and Africa Market Volume (Units) Forecast by End User, 2019 to 2034
Sabyasachi Ghosh
Sabyasachi Ghosh

Principal Consultant

Talk to Analyst

Find your sweet spots for generating winning opportunities in this market.

List of Charts

Figure 1: Global Market Value (US$ Million) by Product Type, 2024 to 2034

Figure 2: Global Market Value (US$ Million) by Material Type, 2024 to 2034

Figure 3: Global Market Value (US$ Million) by Energy Source, 2024 to 2034

Figure 4: Global Market Value (US$ Million) by End User, 2024 to 2034

Figure 5: Global Market Value (US$ Million) by Region, 2024 to 2034

Figure 6: Global Market Value (US$ Million) Analysis by Region, 2019 to 2034

Figure 7: Global Market Volume (Units) Analysis by Region, 2019 to 2034

Figure 8: Global Market Value Share (%) and BPS Analysis by Region, 2024 to 2034

Figure 9: Global Market Y-o-Y Growth (%) Projections by Region, 2024 to 2034

Figure 10: Global Market Value (US$ Million) Analysis by Product Type, 2019 to 2034

Figure 11: Global Market Volume (Units) Analysis by Product Type, 2019 to 2034

Figure 12: Global Market Value Share (%) and BPS Analysis by Product Type, 2024 to 2034

Figure 13: Global Market Y-o-Y Growth (%) Projections by Product Type, 2024 to 2034

Figure 14: Global Market Value (US$ Million) Analysis by Material Type, 2019 to 2034

Figure 15: Global Market Volume (Units) Analysis by Material Type, 2019 to 2034

Figure 16: Global Market Value Share (%) and BPS Analysis by Material Type, 2024 to 2034

Figure 17: Global Market Y-o-Y Growth (%) Projections by Material Type, 2024 to 2034

Figure 18: Global Market Value (US$ Million) Analysis by Energy Source, 2019 to 2034

Figure 19: Global Market Volume (Units) Analysis by Energy Source, 2019 to 2034

Figure 20: Global Market Value Share (%) and BPS Analysis by Energy Source, 2024 to 2034

Figure 21: Global Market Y-o-Y Growth (%) Projections by Energy Source, 2024 to 2034

Figure 22: Global Market Value (US$ Million) Analysis by End User, 2019 to 2034

Figure 23: Global Market Volume (Units) Analysis by End User, 2019 to 2034

Figure 24: Global Market Value Share (%) and BPS Analysis by End User, 2024 to 2034

Figure 25: Global Market Y-o-Y Growth (%) Projections by End User, 2024 to 2034

Figure 26: Global Market Attractiveness by Product Type, 2024 to 2034

Figure 27: Global Market Attractiveness by Material Type, 2024 to 2034

Figure 28: Global Market Attractiveness by Energy Source, 2024 to 2034

Figure 29: Global Market Attractiveness by End User, 2024 to 2034

Figure 30: Global Market Attractiveness by Region, 2024 to 2034

Figure 31: North America Market Value (US$ Million) by Product Type, 2024 to 2034

Figure 32: North America Market Value (US$ Million) by Material Type, 2024 to 2034

Figure 33: North America Market Value (US$ Million) by Energy Source, 2024 to 2034

Figure 34: North America Market Value (US$ Million) by End User, 2024 to 2034

Figure 35: North America Market Value (US$ Million) by Country, 2024 to 2034

Figure 36: North America Market Value (US$ Million) Analysis by Country, 2019 to 2034

Figure 37: North America Market Volume (Units) Analysis by Country, 2019 to 2034

Figure 38: North America Market Value Share (%) and BPS Analysis by Country, 2024 to 2034

Figure 39: North America Market Y-o-Y Growth (%) Projections by Country, 2024 to 2034

Figure 40: North America Market Value (US$ Million) Analysis by Product Type, 2019 to 2034

Figure 41: North America Market Volume (Units) Analysis by Product Type, 2019 to 2034

Figure 42: North America Market Value Share (%) and BPS Analysis by Product Type, 2024 to 2034

Figure 43: North America Market Y-o-Y Growth (%) Projections by Product Type, 2024 to 2034

Figure 44: North America Market Value (US$ Million) Analysis by Material Type, 2019 to 2034

Figure 45: North America Market Volume (Units) Analysis by Material Type, 2019 to 2034

Figure 46: North America Market Value Share (%) and BPS Analysis by Material Type, 2024 to 2034

Figure 47: North America Market Y-o-Y Growth (%) Projections by Material Type, 2024 to 2034

Figure 48: North America Market Value (US$ Million) Analysis by Energy Source, 2019 to 2034

Figure 49: North America Market Volume (Units) Analysis by Energy Source, 2019 to 2034

Figure 50: North America Market Value Share (%) and BPS Analysis by Energy Source, 2024 to 2034

Figure 51: North America Market Y-o-Y Growth (%) Projections by Energy Source, 2024 to 2034

Figure 52: North America Market Value (US$ Million) Analysis by End User, 2019 to 2034

Figure 53: North America Market Volume (Units) Analysis by End User, 2019 to 2034

Figure 54: North America Market Value Share (%) and BPS Analysis by End User, 2024 to 2034

Figure 55: North America Market Y-o-Y Growth (%) Projections by End User, 2024 to 2034

Figure 56: North America Market Attractiveness by Product Type, 2024 to 2034

Figure 57: North America Market Attractiveness by Material Type, 2024 to 2034

Figure 58: North America Market Attractiveness by Energy Source, 2024 to 2034

Figure 59: North America Market Attractiveness by End User, 2024 to 2034

Figure 60: North America Market Attractiveness by Country, 2024 to 2034

Figure 61: Latin America Market Value (US$ Million) by Product Type, 2024 to 2034

Figure 62: Latin America Market Value (US$ Million) by Material Type, 2024 to 2034

Figure 63: Latin America Market Value (US$ Million) by Energy Source, 2024 to 2034

Figure 64: Latin America Market Value (US$ Million) by End User, 2024 to 2034

Figure 65: Latin America Market Value (US$ Million) by Country, 2024 to 2034

Figure 66: Latin America Market Value (US$ Million) Analysis by Country, 2019 to 2034

Figure 67: Latin America Market Volume (Units) Analysis by Country, 2019 to 2034

Figure 68: Latin America Market Value Share (%) and BPS Analysis by Country, 2024 to 2034

Figure 69: Latin America Market Y-o-Y Growth (%) Projections by Country, 2024 to 2034

Figure 70: Latin America Market Value (US$ Million) Analysis by Product Type, 2019 to 2034

Figure 71: Latin America Market Volume (Units) Analysis by Product Type, 2019 to 2034

Figure 72: Latin America Market Value Share (%) and BPS Analysis by Product Type, 2024 to 2034

Figure 73: Latin America Market Y-o-Y Growth (%) Projections by Product Type, 2024 to 2034

Figure 74: Latin America Market Value (US$ Million) Analysis by Material Type, 2019 to 2034

Figure 75: Latin America Market Volume (Units) Analysis by Material Type, 2019 to 2034

Figure 76: Latin America Market Value Share (%) and BPS Analysis by Material Type, 2024 to 2034

Figure 77: Latin America Market Y-o-Y Growth (%) Projections by Material Type, 2024 to 2034

Figure 78: Latin America Market Value (US$ Million) Analysis by Energy Source, 2019 to 2034

Figure 79: Latin America Market Volume (Units) Analysis by Energy Source, 2019 to 2034

Figure 80: Latin America Market Value Share (%) and BPS Analysis by Energy Source, 2024 to 2034

Figure 81: Latin America Market Y-o-Y Growth (%) Projections by Energy Source, 2024 to 2034

Figure 82: Latin America Market Value (US$ Million) Analysis by End User, 2019 to 2034

Figure 83: Latin America Market Volume (Units) Analysis by End User, 2019 to 2034

Figure 84: Latin America Market Value Share (%) and BPS Analysis by End User, 2024 to 2034

Figure 85: Latin America Market Y-o-Y Growth (%) Projections by End User, 2024 to 2034

Figure 86: Latin America Market Attractiveness by Product Type, 2024 to 2034

Figure 87: Latin America Market Attractiveness by Material Type, 2024 to 2034

Figure 88: Latin America Market Attractiveness by Energy Source, 2024 to 2034

Figure 89: Latin America Market Attractiveness by End User, 2024 to 2034

Figure 90: Latin America Market Attractiveness by Country, 2024 to 2034

Figure 91: Western Europe Market Value (US$ Million) by Product Type, 2024 to 2034

Figure 92: Western Europe Market Value (US$ Million) by Material Type, 2024 to 2034

Figure 93: Western Europe Market Value (US$ Million) by Energy Source, 2024 to 2034

Figure 94: Western Europe Market Value (US$ Million) by End User, 2024 to 2034

Figure 95: Western Europe Market Value (US$ Million) by Country, 2024 to 2034

Figure 96: Western Europe Market Value (US$ Million) Analysis by Country, 2019 to 2034

Figure 97: Western Europe Market Volume (Units) Analysis by Country, 2019 to 2034

Figure 98: Western Europe Market Value Share (%) and BPS Analysis by Country, 2024 to 2034

Figure 99: Western Europe Market Y-o-Y Growth (%) Projections by Country, 2024 to 2034

Figure 100: Western Europe Market Value (US$ Million) Analysis by Product Type, 2019 to 2034

Figure 101: Western Europe Market Volume (Units) Analysis by Product Type, 2019 to 2034

Figure 102: Western Europe Market Value Share (%) and BPS Analysis by Product Type, 2024 to 2034

Figure 103: Western Europe Market Y-o-Y Growth (%) Projections by Product Type, 2024 to 2034

Figure 104: Western Europe Market Value (US$ Million) Analysis by Material Type, 2019 to 2034

Figure 105: Western Europe Market Volume (Units) Analysis by Material Type, 2019 to 2034

Figure 106: Western Europe Market Value Share (%) and BPS Analysis by Material Type, 2024 to 2034

Figure 107: Western Europe Market Y-o-Y Growth (%) Projections by Material Type, 2024 to 2034

Figure 108: Western Europe Market Value (US$ Million) Analysis by Energy Source, 2019 to 2034

Figure 109: Western Europe Market Volume (Units) Analysis by Energy Source, 2019 to 2034

Figure 110: Western Europe Market Value Share (%) and BPS Analysis by Energy Source, 2024 to 2034

Figure 111: Western Europe Market Y-o-Y Growth (%) Projections by Energy Source, 2024 to 2034

Figure 112: Western Europe Market Value (US$ Million) Analysis by End User, 2019 to 2034

Figure 113: Western Europe Market Volume (Units) Analysis by End User, 2019 to 2034

Figure 114: Western Europe Market Value Share (%) and BPS Analysis by End User, 2024 to 2034

Figure 115: Western Europe Market Y-o-Y Growth (%) Projections by End User, 2024 to 2034

Figure 116: Western Europe Market Attractiveness by Product Type, 2024 to 2034

Figure 117: Western Europe Market Attractiveness by Material Type, 2024 to 2034

Figure 118: Western Europe Market Attractiveness by Energy Source, 2024 to 2034

Figure 119: Western Europe Market Attractiveness by End User, 2024 to 2034

Figure 120: Western Europe Market Attractiveness by Country, 2024 to 2034

Figure 121: Eastern Europe Market Value (US$ Million) by Product Type, 2024 to 2034

Figure 122: Eastern Europe Market Value (US$ Million) by Material Type, 2024 to 2034

Figure 123: Eastern Europe Market Value (US$ Million) by Energy Source, 2024 to 2034

Figure 124: Eastern Europe Market Value (US$ Million) by End User, 2024 to 2034

Figure 125: Eastern Europe Market Value (US$ Million) by Country, 2024 to 2034

Figure 126: Eastern Europe Market Value (US$ Million) Analysis by Country, 2019 to 2034

Figure 127: Eastern Europe Market Volume (Units) Analysis by Country, 2019 to 2034

Figure 128: Eastern Europe Market Value Share (%) and BPS Analysis by Country, 2024 to 2034

Figure 129: Eastern Europe Market Y-o-Y Growth (%) Projections by Country, 2024 to 2034

Figure 130: Eastern Europe Market Value (US$ Million) Analysis by Product Type, 2019 to 2034

Figure 131: Eastern Europe Market Volume (Units) Analysis by Product Type, 2019 to 2034

Figure 132: Eastern Europe Market Value Share (%) and BPS Analysis by Product Type, 2024 to 2034

Figure 133: Eastern Europe Market Y-o-Y Growth (%) Projections by Product Type, 2024 to 2034

Figure 134: Eastern Europe Market Value (US$ Million) Analysis by Material Type, 2019 to 2034

Figure 135: Eastern Europe Market Volume (Units) Analysis by Material Type, 2019 to 2034

Figure 136: Eastern Europe Market Value Share (%) and BPS Analysis by Material Type, 2024 to 2034

Figure 137: Eastern Europe Market Y-o-Y Growth (%) Projections by Material Type, 2024 to 2034

Figure 138: Eastern Europe Market Value (US$ Million) Analysis by Energy Source, 2019 to 2034

Figure 139: Eastern Europe Market Volume (Units) Analysis by Energy Source, 2019 to 2034

Figure 140: Eastern Europe Market Value Share (%) and BPS Analysis by Energy Source, 2024 to 2034

Figure 141: Eastern Europe Market Y-o-Y Growth (%) Projections by Energy Source, 2024 to 2034

Figure 142: Eastern Europe Market Value (US$ Million) Analysis by End User, 2019 to 2034

Figure 143: Eastern Europe Market Volume (Units) Analysis by End User, 2019 to 2034

Figure 144: Eastern Europe Market Value Share (%) and BPS Analysis by End User, 2024 to 2034

Figure 145: Eastern Europe Market Y-o-Y Growth (%) Projections by End User, 2024 to 2034

Figure 146: Eastern Europe Market Attractiveness by Product Type, 2024 to 2034

Figure 147: Eastern Europe Market Attractiveness by Material Type, 2024 to 2034

Figure 148: Eastern Europe Market Attractiveness by Energy Source, 2024 to 2034

Figure 149: Eastern Europe Market Attractiveness by End User, 2024 to 2034

Figure 150: Eastern Europe Market Attractiveness by Country, 2024 to 2034

Figure 151: South Asia and Pacific Market Value (US$ Million) by Product Type, 2024 to 2034

Figure 152: South Asia and Pacific Market Value (US$ Million) by Material Type, 2024 to 2034

Figure 153: South Asia and Pacific Market Value (US$ Million) by Energy Source, 2024 to 2034

Figure 154: South Asia and Pacific Market Value (US$ Million) by End User, 2024 to 2034

Figure 155: South Asia and Pacific Market Value (US$ Million) by Country, 2024 to 2034

Figure 156: South Asia and Pacific Market Value (US$ Million) Analysis by Country, 2019 to 2034

Figure 157: South Asia and Pacific Market Volume (Units) Analysis by Country, 2019 to 2034

Figure 158: South Asia and Pacific Market Value Share (%) and BPS Analysis by Country, 2024 to 2034

Figure 159: South Asia and Pacific Market Y-o-Y Growth (%) Projections by Country, 2024 to 2034

Figure 160: South Asia and Pacific Market Value (US$ Million) Analysis by Product Type, 2019 to 2034

Figure 161: South Asia and Pacific Market Volume (Units) Analysis by Product Type, 2019 to 2034

Figure 162: South Asia and Pacific Market Value Share (%) and BPS Analysis by Product Type, 2024 to 2034

Figure 163: South Asia and Pacific Market Y-o-Y Growth (%) Projections by Product Type, 2024 to 2034

Figure 164: South Asia and Pacific Market Value (US$ Million) Analysis by Material Type, 2019 to 2034

Figure 165: South Asia and Pacific Market Volume (Units) Analysis by Material Type, 2019 to 2034

Figure 166: South Asia and Pacific Market Value Share (%) and BPS Analysis by Material Type, 2024 to 2034

Figure 167: South Asia and Pacific Market Y-o-Y Growth (%) Projections by Material Type, 2024 to 2034

Figure 168: South Asia and Pacific Market Value (US$ Million) Analysis by Energy Source, 2019 to 2034

Figure 169: South Asia and Pacific Market Volume (Units) Analysis by Energy Source, 2019 to 2034

Figure 170: South Asia and Pacific Market Value Share (%) and BPS Analysis by Energy Source, 2024 to 2034

Figure 171: South Asia and Pacific Market Y-o-Y Growth (%) Projections by Energy Source, 2024 to 2034

Figure 172: South Asia and Pacific Market Value (US$ Million) Analysis by End User, 2019 to 2034

Figure 173: South Asia and Pacific Market Volume (Units) Analysis by End User, 2019 to 2034

Figure 174: South Asia and Pacific Market Value Share (%) and BPS Analysis by End User, 2024 to 2034

Figure 175: South Asia and Pacific Market Y-o-Y Growth (%) Projections by End User, 2024 to 2034

Figure 176: South Asia and Pacific Market Attractiveness by Product Type, 2024 to 2034

Figure 177: South Asia and Pacific Market Attractiveness by Material Type, 2024 to 2034

Figure 178: South Asia and Pacific Market Attractiveness by Energy Source, 2024 to 2034

Figure 179: South Asia and Pacific Market Attractiveness by End User, 2024 to 2034

Figure 180: South Asia and Pacific Market Attractiveness by Country, 2024 to 2034

Figure 181: East Asia Market Value (US$ Million) by Product Type, 2024 to 2034

Figure 182: East Asia Market Value (US$ Million) by Material Type, 2024 to 2034

Figure 183: East Asia Market Value (US$ Million) by Energy Source, 2024 to 2034

Figure 184: East Asia Market Value (US$ Million) by End User, 2024 to 2034

Figure 185: East Asia Market Value (US$ Million) by Country, 2024 to 2034

Figure 186: East Asia Market Value (US$ Million) Analysis by Country, 2019 to 2034

Figure 187: East Asia Market Volume (Units) Analysis by Country, 2019 to 2034

Figure 188: East Asia Market Value Share (%) and BPS Analysis by Country, 2024 to 2034

Figure 189: East Asia Market Y-o-Y Growth (%) Projections by Country, 2024 to 2034

Figure 190: East Asia Market Value (US$ Million) Analysis by Product Type, 2019 to 2034

Figure 191: East Asia Market Volume (Units) Analysis by Product Type, 2019 to 2034

Figure 192: East Asia Market Value Share (%) and BPS Analysis by Product Type, 2024 to 2034

Figure 193: East Asia Market Y-o-Y Growth (%) Projections by Product Type, 2024 to 2034

Figure 194: East Asia Market Value (US$ Million) Analysis by Material Type, 2019 to 2034

Figure 195: East Asia Market Volume (Units) Analysis by Material Type, 2019 to 2034

Figure 196: East Asia Market Value Share (%) and BPS Analysis by Material Type, 2024 to 2034

Figure 197: East Asia Market Y-o-Y Growth (%) Projections by Material Type, 2024 to 2034

Figure 198: East Asia Market Value (US$ Million) Analysis by Energy Source, 2019 to 2034

Figure 199: East Asia Market Volume (Units) Analysis by Energy Source, 2019 to 2034

Figure 200: East Asia Market Value Share (%) and BPS Analysis by Energy Source, 2024 to 2034

Figure 201: East Asia Market Y-o-Y Growth (%) Projections by Energy Source, 2024 to 2034

Figure 202: East Asia Market Value (US$ Million) Analysis by End User, 2019 to 2034

Figure 203: East Asia Market Volume (Units) Analysis by End User, 2019 to 2034

Figure 204: East Asia Market Value Share (%) and BPS Analysis by End User, 2024 to 2034

Figure 205: East Asia Market Y-o-Y Growth (%) Projections by End User, 2024 to 2034

Figure 206: East Asia Market Attractiveness by Product Type, 2024 to 2034

Figure 207: East Asia Market Attractiveness by Material Type, 2024 to 2034

Figure 208: East Asia Market Attractiveness by Energy Source, 2024 to 2034

Figure 209: East Asia Market Attractiveness by End User, 2024 to 2034

Figure 210: East Asia Market Attractiveness by Country, 2024 to 2034

Figure 211: Middle East and Africa Market Value (US$ Million) by Product Type, 2024 to 2034

Figure 212: Middle East and Africa Market Value (US$ Million) by Material Type, 2024 to 2034

Figure 213: Middle East and Africa Market Value (US$ Million) by Energy Source, 2024 to 2034

Figure 214: Middle East and Africa Market Value (US$ Million) by End User, 2024 to 2034

Figure 215: Middle East and Africa Market Value (US$ Million) by Country, 2024 to 2034

Figure 216: Middle East and Africa Market Value (US$ Million) Analysis by Country, 2019 to 2034

Figure 217: Middle East and Africa Market Volume (Units) Analysis by Country, 2019 to 2034

Figure 218: Middle East and Africa Market Value Share (%) and BPS Analysis by Country, 2024 to 2034

Figure 219: Middle East and Africa Market Y-o-Y Growth (%) Projections by Country, 2024 to 2034

Figure 220: Middle East and Africa Market Value (US$ Million) Analysis by Product Type, 2019 to 2034

Figure 221: Middle East and Africa Market Volume (Units) Analysis by Product Type, 2019 to 2034

Figure 222: Middle East and Africa Market Value Share (%) and BPS Analysis by Product Type, 2024 to 2034

Figure 223: Middle East and Africa Market Y-o-Y Growth (%) Projections by Product Type, 2024 to 2034

Figure 224: Middle East and Africa Market Value (US$ Million) Analysis by Material Type, 2019 to 2034

Figure 225: Middle East and Africa Market Volume (Units) Analysis by Material Type, 2019 to 2034

Figure 226: Middle East and Africa Market Value Share (%) and BPS Analysis by Material Type, 2024 to 2034

Figure 227: Middle East and Africa Market Y-o-Y Growth (%) Projections by Material Type, 2024 to 2034

Figure 228: Middle East and Africa Market Value (US$ Million) Analysis by Energy Source, 2019 to 2034

Figure 229: Middle East and Africa Market Volume (Units) Analysis by Energy Source, 2019 to 2034

Figure 230: Middle East and Africa Market Value Share (%) and BPS Analysis by Energy Source, 2024 to 2034

Figure 231: Middle East and Africa Market Y-o-Y Growth (%) Projections by Energy Source, 2024 to 2034

Figure 232: Middle East and Africa Market Value (US$ Million) Analysis by End User, 2019 to 2034

Figure 233: Middle East and Africa Market Volume (Units) Analysis by End User, 2019 to 2034

Figure 234: Middle East and Africa Market Value Share (%) and BPS Analysis by End User, 2024 to 2034

Figure 235: Middle East and Africa Market Y-o-Y Growth (%) Projections by End User, 2024 to 2034

Figure 236: Middle East and Africa Market Attractiveness by Product Type, 2024 to 2034

Figure 237: Middle East and Africa Market Attractiveness by Material Type, 2024 to 2034

Figure 238: Middle East and Africa Market Attractiveness by Energy Source, 2024 to 2034

Figure 239: Middle East and Africa Market Attractiveness by End User, 2024 to 2034

Figure 240: Middle East and Africa Market Attractiveness by Country, 2024 to 2034

Recommendations

Healthcare

Medical Bed Market

Published : October 2023

Healthcare

Portable Medical Devices Market

Published : February 2023

Explore Healthcare Insights

View Reports