

- Market Size (2026)
- USD 105.15 Bn
- Forecast (2036)
- USD 330.35 Bn
- CAGR (2026 to 2036)
- 12.1%
Medical Device Contract Manufacturing Market Size, Market Forecast and Outlook By FMI
USD 105.15 billion in 2026 and USD 330.35 billion by 2036 at a 12.1% CAGR.
The medical device contract manufacturing industry value is forecast to grow from USD 93.80 billion in 2025 to USD 330.35 billion by 2036 at 12.1% CAGR as OEMs outsource validated production-transfer work. Finished devices are forecast to represent 38.0% share in 2026 because OEMs prefer partners that can keep final assembly and release records under one quality system. Class II devices are expected to secure 46.0% share in 2026, led by repeatable production volume and structured compliance needs.
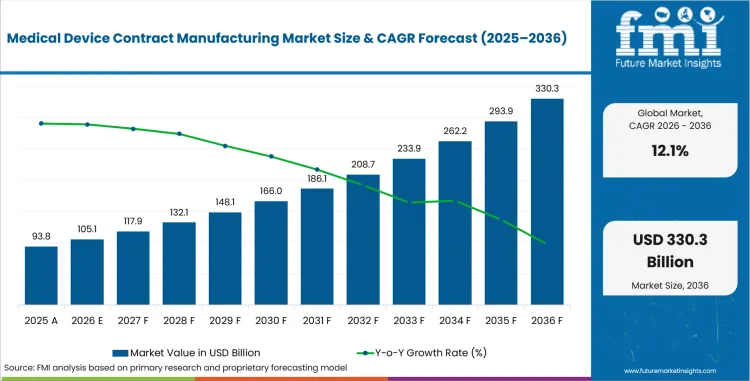
Medical Device Contract Manufacturing Market Overview: Size and Forecast
- 2026 Market Size: USD 105.15 billion
- 2036 Market Size: USD 330.35 billion
- Forecast CAGR: 12.1% from 2026 to 2036
- Leading Service Type: Finished Devices
- Finished Devices Share in 2026: 38.0%
- Leading Device Class: Class II Devices
- Class II Devices Share in 2026: 46.0%
- Fastest-growing Country: India
- India CAGR: 14.2% by 2036
Summary of the Medical Device Contract Manufacturing Market
- Demand and Growth Drivers
- OEMs are outsourcing more validated assembly and production work as device portfolios become broader and compliance requirements increase.
- Contract manufacturers are gaining importance where buyers need scale, quality-system discipline, and faster capacity access without building new plants.
- Finished-device outsourcing is rising as OEMs place more assembly, inspection, packaging, and sterilization-linked work with qualified suppliers.
- Regulatory documentation and audit readiness are becoming core selection factors as buyers reduce supplier risk across global device programs.
- Product and Segment View
- Finished devices are projected to lead the service type segment with 38.0% share as OEMs reduce internal transfer risk.
- Class II devices are estimated to lead the device class segment with 46.0% share given their broad use in monitoring and surgical tools.
- Cardiovascular applications are projected to account for 24.0% of application revenue in 2026 due to catheters and implantable components.
- Injection molding is expected to represent 31.0% of process revenue in 2026 as polymer housings and fluid-path parts require repeatable tooling.
- Large OEMs are projected to account for 58.0% of customer revenue in 2026 as supplier qualification favors long-term global programs.
- Geography and Competitive Outlook
- The United States is projected to record 11.6% CAGR through 2036 because FDA-registered supply chains support domestic and nearshore sourcing.
- Germany is expected to expand at 10.4% CAGR through 2036 as precision medtech production supports high-value components.
- Jabil is estimated to hold 7.5% share among profiled suppliers, with Flex and Integer Holdings competing on scale and design-transfer depth.
- Contract manufacturers in orthopedic contract manufacturing gain where implant machining and sterile packaging sit close to final release work.
- Analyst Opinion
- Anurag Sharma, Principal Analyst at FMI says, "I see this market shifting from simple outsourcing to production ownership. Medical device OEMs are not only buying labor capacity. They are buying process validation, quality-system discipline, and launch-risk reduction. The strongest demand comes from three linked routes. One is complex Class II device production that needs controlled repeatability. The second is Class III and implantable work that needs material traceability and cleanroom control. The third is drug delivery and diagnostics work that needs design transfer before scale-up. Cost pressure is real, but compliance pressure is stronger. Suppliers win when they prove ISO 13485 discipline, engineering change control, and cleanroom ramp-up without slowing the OEM launch calendar."
Regulated production depth is the main pressure point for medical device contract manufacturers as OEMs review supplier qualification and cleanroom readiness. FDA recorded 30,120 registered medical device establishments in FY 2024. The supplier base included 14,057 domestic establishments and 16,063 foreign establishments. Contract manufacturers with validated transfer processes and audit-ready documentation should secure more launch programs.
Which factors support expansion in the medical device contract manufacturing market?
Validated assembly, cleanroom capacity, and compliance-led production transfer support market value across regulated OEM channels.
- Market value is supported by outsourced manufacturing programs that cover components, sub-assemblies, finished devices, packaging, and sterilization-linked services.
- Supplier pricing reflects cleanroom class, validation workload, material traceability, inspection depth, and device history record control before unit volume affects margins.
- Revenue improves when OEMs transfer validated assembly and release work to suppliers that can manage production, documentation, and quality checks together.
- Buyer trust rises when contract manufacturers show ISO-certified systems, audit readiness, process validation, and regulatory documentation discipline.
- Growth is reinforced by OEM demand for faster capacity access without building new plants or adding fixed manufacturing overhead.
Why is the Medical Device Contract Manufacturing Market Growing?
OEMs are outsourcing more production-transfer work as complex devices need validation before commercial launch.
- Cleanroom assembly demand is rising with sterile implants, wearable devices, and drug-delivery systems.
- Device makers use contract manufacturers to reduce capital lock-in when launch volumes are uncertain.
- Regionalized supply chains are gaining priority as buyers reduce dependence on one geography.
- Qualification costs push OEMs toward fewer suppliers with stronger quality systems and wider manufacturing reach.
Device OEMs increasingly treat contract manufacturers as launch-risk partners. FDA recorded 30,120 registered medical device establishments in FY 2024, with China accounting for 6,829 establishments in FDA foreign-region reporting. This scale shows that regulated device production already relies on cross-border manufacturing networks. For contract manufacturers, the practical result is clear: buyers pay for controlled production records, traceability, and inspection readiness. Suppliers able to move prototypes into production with fewer late design changes capture the higher-value portion of the forecast.
Capacity demand is strongest where device complexity meets sterile or precision production. India’s government reported 194 manufacturers allotted land in three medical device parks by September 2025, and 34 units had started plant construction. This creates local supply options for OEMs that want cost control without losing regulated production discipline. The same pattern supports portable medical devices and homecare medical devices, where device makers need scalable assembly close to end-market demand.
How is the medical device contract manufacturing market segmented?
The medical device contract manufacturing industry is segmented by service type, device class, application, manufacturing process, and customer type.
- Finished devices are projected to account for 38.0% of service type revenue in 2026 as OEMs shift final assembly and release steps to audited partners.
- With an estimated 46.0% share in 2026, Class II devices are expected to lead by device class due to repeatable volume production.
- Cardiovascular applications are anticipated to hold 24.0% of application revenue in 2026 with catheter, guidewire, and implant programs driving repeat orders.
- Injection molding is projected to represent 31.0% of manufacturing process revenue in 2026 as medical plastics need validated tooling and cavity control.
- Large OEMs are expected to command 58.0% of customer revenue in 2026 given long supplier approval cycles and global manufacturing contracts.
Segmentation is shaped by where the OEM gives up control without giving up accountability. Germany’s medtech production value reached EUR 46 billion in 2024, with around 900 manufacturers active in prosthesis and orthopedics. This depth explains why components and finished device work often cluster near engineering talent and clinical users. It also supports adjacent growth in wearable healthcare devices and 3D printed medical devices, where design iteration and production validation sit close together.
Why do finished devices lead the medical device contract manufacturing market?
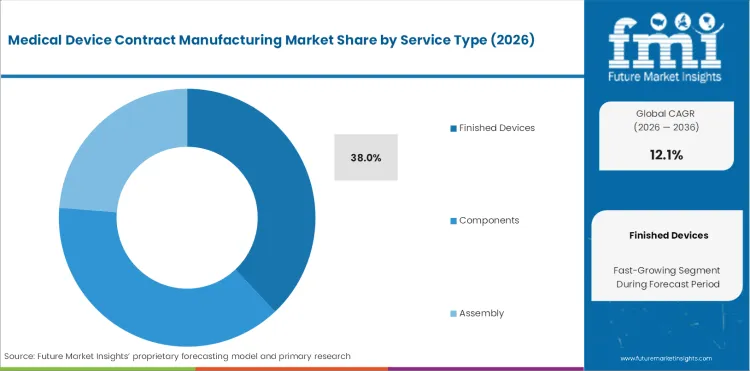
- Finished devices are projected to account for 38.0% of service revenue in 2026 as OEMs place assembly, packaging, and release work with suppliers able to control full device history records.
- Buyers value finished-device partners when sterile barrier validation and labeling control sit in one quality system, which lowers handoff risk before commercial release.
Which device class leads the medical device contract manufacturing market?
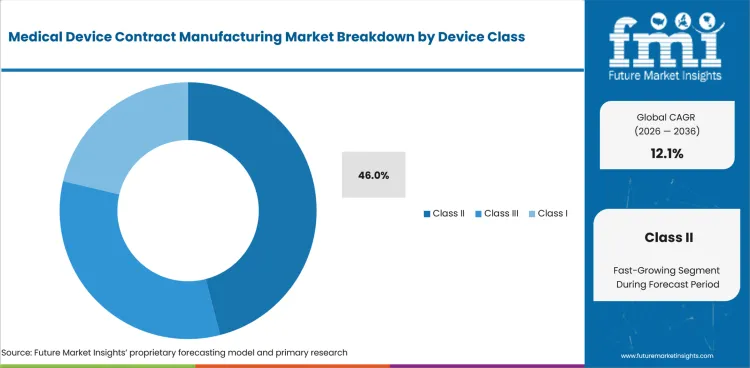
- Class II devices are estimated to hold 46.0% share in 2026 because they combine recurring production volume with enough regulatory control to justify outsourced quality-system investment.
- These programs often include monitoring tools, surgical instruments, and fluid-path devices, so contract manufacturers must show process validation without the slower economics of low-volume implants.
Which application leads the medical device contract manufacturing market?
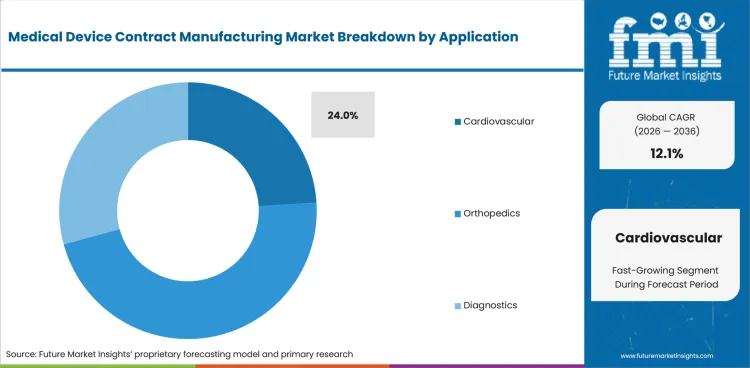
- Cardiovascular applications are anticipated to account for 24.0% share in 2026 as catheter systems, guidewires, and delivery tools require precision assembly and material traceability.
- Integer’s January 2026 disclosure highlighted structural heart delivery systems, neurovascular catheters, and electrophysiology tools as key solutions, showing how suppliers target high-control programs.
Which manufacturing process leads the medical device contract manufacturing market?
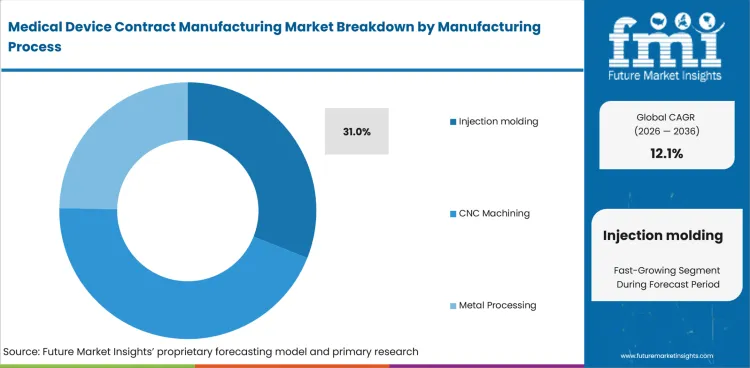
- Injection molding is expected to represent 31.0% share in 2026 as medical housings, connectors, and diagnostic parts need repeatable tooling under validated process windows.
- Micro-molding capability carries pricing power when customers need tight polymer tolerances, especially in minimally invasive surgery and rapid diagnostic cartridges.
Which customer type leads the medical device contract manufacturing market?
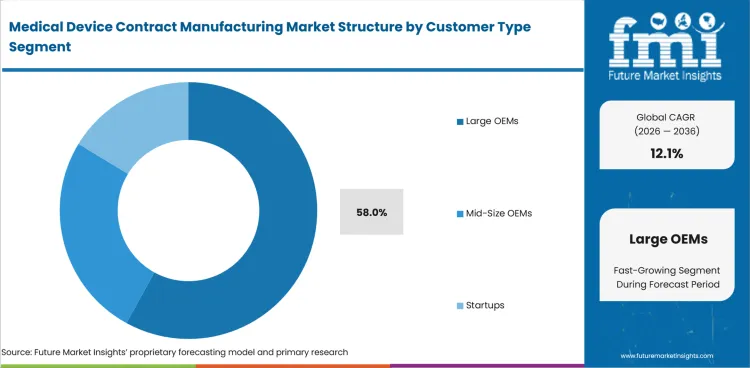
- Large OEMs are projected to account for 58.0% share in 2026 as global device firms qualify fewer partners for larger and longer programs.
- Supplier selection often starts with ISO 13485 coverage, cleanroom capacity, and transfer history, then moves to cost only after process risk is screened.
What are the drivers, restraints, and opportunities in the medical device contract manufacturing market?
Design transfer and validated assembly support growth while compliance cost limits supplier onboarding.
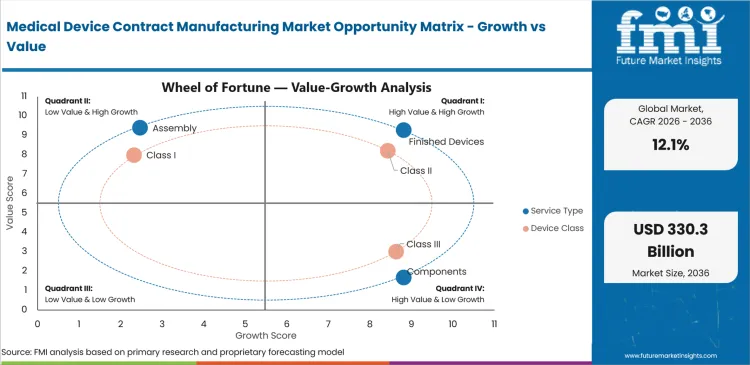
- Driver: OEMs are shifting production-transfer work to partners that can combine engineering validation with repeatable manufacturing records.
- Restraint: Supplier qualification cost limits smaller firms that cannot maintain audit-ready process validation and device history controls.
- Opportunity: Connected and wearable devices create demand for contract manufacturers that can link electronics assembly with cleanroom release steps.
Medical Device Contract Manufacturing Market Demand Outlook
Demand outlook is moving toward qualified partners that can support design transfer, cleanroom assembly, and release documentation before product launch. Flex opened a healthcare new-product-introduction center near Boston in March 2025 with an 8,000 sq. ft. NPI lab and a 2,000 sq. ft. quality and design validation lab. Sanmina expanded its Fermoy facility in November 2025 with an ISO 8 cleanroom for wearable medical devices. These developments show that OEMs are buying launch-risk reduction as much as production capacity.
Consumer Segmentation and Purchase Behavior Analysis
Large OEMs form the main buying pool because supplier qualification is expensive and transfer programs often run across multiple product families. Mid-size OEMs usually seek partners for pilot production and packaging validation. Startups use contract manufacturers when prototype success must be converted into regulated production without building an internal plant.
Voice of Customer and Decision-driver Analysis
OEM purchasing decisions are shaped by ISO 13485 coverage, cleanroom capacity, design-transfer history, and release-document control. Buyers compare suppliers by validated process windows before reviewing unit cost. Contract manufacturers with engineering support and sterilization coordination should convert more quotes into long-term programs.
Which countries are growing fastest in the medical device contract manufacturing market?
India leads at 14.2% CAGR through 2036. China follows at 13.4% CAGR. The United States is forecast at 11.6% CAGR. The United Kingdom is projected at 11.2% CAGR. France is estimated at 10.6% CAGR. Germany follows at 10.4% CAGR. Japan is forecast at 9.8% CAGR.
.webp "Top Country Growth Comparison Medical Device Contract Manufacturing Market Cagr (2026 2036)")
| Country | CAGR |
|---|---|
| India | 14.2% |
| China | 13.4% |
| United States | 11.6% |
| United Kingdom | 11.2% |
| France | 10.6% |
| Germany | 10.4% |
| Japan | 9.8% |
| Source | Future Market Insights, 2026. |
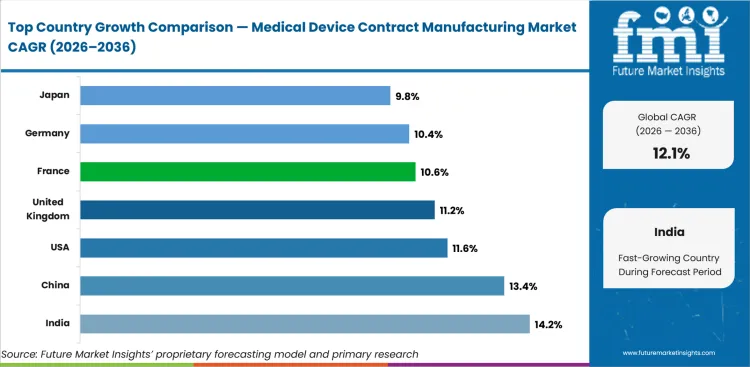
How do country-level CAGRs compare in the medical device contract manufacturing market?
India leads country growth while Japan records the most cautious expansion outlook among profiled markets.
- India is forecast to record 14.2% CAGR through 2036 as medical device parks and domestic production support outsourced capacity.
- China is projected to record 13.4% CAGR through 2036 as local production policy supports more device assembly and component sourcing.
- The United States is expected to expand at 11.6% CAGR through 2036 as FDA-facing supply chains support domestic and nearshore sourcing.
- The United Kingdom is forecast to record 11.2% CAGR through 2036 as medtech turnover and SME supplier depth support outsourced production.
- France is projected to rise at 10.6% CAGR through 2036 as device turnover and export activity support production partnerships.
- Germany is estimated to grow at 10.4% CAGR through 2036 as precision medtech production supports high-value component manufacturing.
- Japan is forecast to record 9.8% CAGR through 2036 as structured PMDA rules and precision supplier capability support selective outsourcing.
How fast is the medical device contract manufacturing market growing in India?
A 14.2% CAGR through 2036 reflects medical device park investment and local production incentives.
Country Market Snapshot Table
| Parameter | Value |
|---|---|
| Market Size in 2025 (Value) | USD 3,677.8 million |
| Market Size in 2026 (Value) | USD 4,200.0 million |
| Market Forecast in 2036 (Value) | USD 15,887.7 million |
| CAGR (2026 to 2036) | 14.2% |
| Years Considered | 2021 to 2036 |
| Base Year | 2025 |
| Forecast Period | 2026 to 2036 |
| Units Considered | Value (USD million) |
| Leading Sub-Region | Greater Noida, Ujjain, and Kanchipuram medical device parks |
India Medical Device Contract Manufacturing Market Outlook
India medical device contract manufacturing demand is shaped by park-based capacity and local production incentives. OEMs are evaluating Indian partners for imaging, diagnostics, consumables, and high-end equipment programs.
Cost control remains the main opening for Indian suppliers. Buyers still require validated processes, cleanroom records, and device documentation before shifting regulated production.
Key Growth Drivers
- Medical device parks reduce infrastructure barriers for contract manufacturers. The Press Information Bureau reported in December 2025 that 194 manufacturers had been allotted land across three approved parks.
- Export scale supports supplier qualification. India Brand Equity Foundation reported in 2026 that medical device exports reached Rs. 31,120 crore in FY25.
- Export ambition is expected to support component and assembly suppliers that can pass OEM audits for traceability and quality systems.
- Domestic OEMs are expected to use contract manufacturers where cleanroom buildout and process validation would slow launch timing.
Key Restraints
- Import dependence still limits local value capture. The U.S. International Trade Administration reported in June 2025 that India relied on imports for nearly 70.0% of medical devices.
- Smaller suppliers may struggle to document sterilization validation and device history records at global OEM standards.
- Local component maturity can slow high-end device outsourcing when precision machining and electronics assembly remain concentrated among fewer suppliers.
What makes India unique
India is unique due to park-based medtech capacity and government-backed production support.
Key Companies
- Poly Medicure Ltd.
- Meril Life Sciences Pvt. Ltd.
- Trivitron Healthcare Pvt. Ltd.
- Skanray Technologies Pvt. Ltd.
- Sahajanand Medical Technologies Pvt. Ltd.
- Hindustan Syringes & Medical Devices Ltd.
- Jabil India
Sales & Marketing Channels
- Park-based supplier discovery
- Government incentive-linked manufacturing
- Direct OEM qualification
- Distributor-backed domestic sales
- Export manufacturing partnerships
- Hospital tender support networks
Country Segment Breakdown Table
| Segment | Sub-Segments |
|---|---|
| By Service Type | Finished Devices · Components · Assembly · Packaging · Sterilization |
| By Device Class | Class II · Class III · Class I · IVD |
| By Application | Cardiovascular · Orthopedics · Diagnostics · Drug Delivery · Surgical |
| By Manufacturing Process | Injection Molding · CNC Machining · Metal Processing · Electronics Assembly · Additive Fabrication |
| By Customer Type | Large OEMs · Mid-Size OEMs · Startups · Hospital Programs |
| Key Sub-Regions Covered | Greater Noida · Ujjain · Kanchipuram · Hyderabad · Bengaluru · Pune |
Frequently Asked Questions
How fast is India medical device contract manufacturing market growing?
India is projected to grow at 14.2% CAGR from 2026 to 2036 with park-based manufacturing support.
Who leads India medical device contract manufacturing market?
Poly Medicure, Meril Life Sciences, Trivitron Healthcare, Skanray, and Jabil India compete through local production and OEM supply.
What is driving adoption in India medical device contract manufacturing market?
Medical device parks and production incentives are moving device programs toward qualified local suppliers.
What is driving medical device contract manufacturing growth in China?
A 13.4% CAGR through 2036 reflects local production policy and large regulated manufacturing capacity.
Country Market Snapshot Table
| Parameter | Value |
|---|---|
| Market Size in 2025 (Value) | USD 16,313.9 million |
| Market Size in 2026 (Value) | USD 18,500.0 million |
| Market Forecast in 2036 (Value) | USD 65,002.2 million |
| CAGR (2026 to 2036) | 13.4% |
| Years Considered | 2021 to 2036 |
| Base Year | 2025 |
| Forecast Period | 2026 to 2036 |
| Units Considered | Value (USD million) |
| Leading Sub-Region | Jiangsu, Guangdong, Shanghai, and Zhejiang production clusters |
China Medical Device Contract Manufacturing Market Outlook
China medical device contract manufacturing demand is shaped by local production policy and deep supplier capacity. OEMs use Chinese partners for components, assembly, electronics, and selected finished-device programs.
Regulatory and procurement risk is higher for export-facing programs. Suppliers need stronger quality evidence, change control, and market-specific documentation before winning global transfer work.
Key Growth Drivers
- Local production policy supports device assembly transfer. NMPA issued Announcement No. 30 in June 2025 to improve domestic production arrangements for imported medical devices.
- Industrial growth supports manufacturing capacity. China’s official statistics reported that high-tech manufacturing value added increased by 12.5% year on year in the first quarter of 2026.
- Local OEMs are expected to expand outsourced component and electronics assembly where production scale lowers unit cost.
- Export-facing suppliers can capture repeat work when they show process validation and traceability across regulated device classes.
Key Restraints
- Procurement restrictions can affect export-facing suppliers. The European Commission restricted Chinese companies from EU public medical device procurement above EUR 5.0 million in June 2025.
- Documentation gaps can slow transfers when OEMs require device master records and validated change-control procedures.
- Lower-value disposables can face margin pressure when buyers treat molding and assembly capacity as interchangeable.
What makes China unique
China is unique due to domestic production policy and large medical device manufacturing clusters.
Key Companies
- Shenzhen Mindray Bio-Medical Electronics Co. Ltd.
- MicroPort Scientific Corporation
- Lepu Medical Technology Co. Ltd.
- Shandong Weigao Group Medical Polymer Co. Ltd.
- United Imaging Healthcare Co. Ltd.
- Yuwell Medical
- Jabil China
Sales & Marketing Channels
- Local OEM supplier qualification
- Provincial industrial park routes
- NMPA-linked registration support
- Export manufacturing relationships
- Distributor-backed component sourcing
- Joint development with domestic device brands
Country Segment Breakdown Table
| Segment | Sub-Segments |
|---|---|
| By Service Type | Finished Devices · Components · Assembly · Packaging · Sterilization |
| By Device Class | Class II · Class III · Class I · IVD |
| By Application | Cardiovascular · Orthopedics · Diagnostics · Drug Delivery · Surgical |
| By Manufacturing Process | Injection Molding · CNC Machining · Metal Processing · Electronics Assembly · Additive Fabrication |
| By Customer Type | Large OEMs · Mid-Size OEMs · Startups · Hospital Programs |
| Key Sub-Regions Covered | Jiangsu · Guangdong · Shanghai · Zhejiang · Beijing-Tianjin-Hebei · Greater Bay Area |
Frequently Asked Questions
How fast is China medical device contract manufacturing market growing?
China is projected to expand at 13.4% CAGR from 2026 to 2036 with domestic production routes.
Who leads China medical device contract manufacturing market?
Mindray, MicroPort, Lepu Medical, Weigao, United Imaging, and Jabil China operate across device production and supply programs.
What is driving adoption in China medical device contract manufacturing market?
NMPA localization policy and large manufacturing clusters are supporting outsourced device production.
What is the medical device contract manufacturing outlook in the United States?
An 11.6% CAGR through 2036 is supported by FDA-facing production depth and nearshore sourcing.
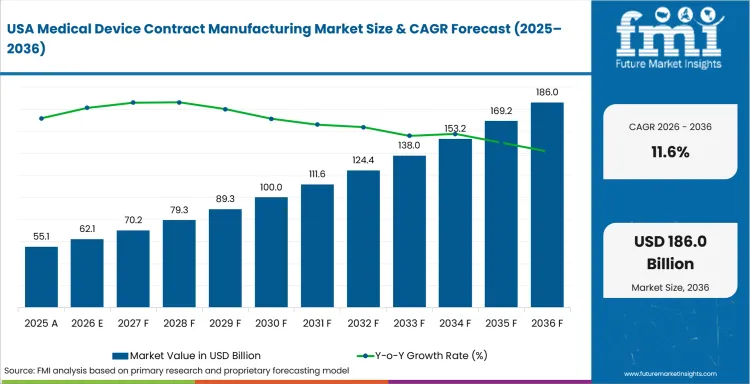
Country Market Snapshot Table
| Parameter | Value |
|---|---|
| Market Size in 2025 (Value) | USD 31,362.0 million |
| Market Size in 2026 (Value) | USD 35,000.0 million |
| Market Forecast in 2036 (Value) | USD 104,787.3 million |
| CAGR (2026 to 2036) | 11.6% |
| Years Considered | 2021 to 2036 |
| Base Year | 2025 |
| Forecast Period | 2026 to 2036 |
| Units Considered | Value (USD million) |
| Leading Sub-Region | Boston, Minneapolis, California, and FDA-facing production clusters |
United States Medical Device Contract Manufacturing Market Outlook
United States medical device contract manufacturing demand is shaped by FDA-facing supplier depth and domestic production reassessment. OEMs use U.S. partners where inspection readiness and launch-risk control matter more than low-cost assembly.
Domestic suppliers benefit from proximity to engineering teams and clinical users. Capacity pressure remains visible in cleanroom assembly, sterile packaging, and high-control electronics programs.
Key Growth Drivers
- FDA-facing OEMs value domestic supplier depth. FDA recorded 14,057 domestic registered device establishments in FY 2024.
- Export scale supports high-control manufacturing programs. The U.S. International Trade Administration stated in January 2026 that U.S. medical technology exports exceeded USD 103.0 billion.
- Surgical robotics and wearable clinical devices are expected to support electronics assembly and validated production-transfer demand.
- Nearshore planning is expected to favor suppliers that combine USA quality oversight with regional component sourcing.
Key Restraints
- Supplier price pressure remains visible. The Producer Price Index for medical equipment and supplies manufacturing reached 142.198 in May 2026.
- FDA inspection readiness raises operating cost for contract manufacturers that support Class II and Class III programs.
- Startups may delay transfer work when funding cycles restrict tooling orders and validation batches.
What makes United States unique
The United States is unique due to FDA-facing supplier depth and large medtech export scale.
Key Companies
- Jabil Inc.
- Flex Ltd.
- Integer Holdings Corporation
- Sanmina Corporation
- TE Connectivity Ltd.
- Viant Medical
- Resonetics LLC
Sales & Marketing Channels
- Direct OEM qualification
- FDA-facing design transfer
- Nearshore production planning
- NPI engineering centers
- Cleanroom assembly programs
- Sterile packaging networks
Country Segment Breakdown Table
| Segment | Sub-Segments |
|---|---|
| By Service Type | Finished Devices · Components · Assembly · Packaging · Sterilization |
| By Device Class | Class II · Class III · Class I · IVD |
| By Application | Cardiovascular · Orthopedics · Diagnostics · Drug Delivery · Surgical |
| By Manufacturing Process | Injection Molding · CNC Machining · Metal Processing · Electronics Assembly · Additive Fabrication |
| By Customer Type | Large OEMs · Mid-Size OEMs · Startups · Hospital Programs |
| Key Sub-Regions Covered | Boston · Minneapolis · California · Texas · Indiana · North Carolina |
Frequently Asked Questions
How fast is United States medical device contract manufacturing market growing?
The United States is expected to expand at 11.6% CAGR from 2026 to 2036 through FDA-facing supply chains.
Who leads United States medical device contract manufacturing market?
Jabil, Flex, Integer, Sanmina, TE Connectivity, Viant, and Resonetics compete through launch and manufacturing depth.
What is driving adoption in United States medical device contract manufacturing market?
FDA-registered supply depth and nearshore production planning are pushing OEMs toward qualified U.S. partners.
How is the medical device contract manufacturing market performing in the United Kingdom?
An 11.2% CAGR through 2036 reflects medtech turnover and SME supplier depth.
Country Market Snapshot Table
| Parameter | Value |
|---|---|
| Market Size in 2025 (Value) | USD 5,845.3 million |
| Market Size in 2026 (Value) | USD 6,500.0 million |
| Market Forecast in 2036 (Value) | USD 18,798.1 million |
| CAGR (2026 to 2036) | 11.2% |
| Years Considered | 2021 to 2036 |
| Base Year | 2025 |
| Forecast Period | 2026 to 2036 |
| Units Considered | Value (USD million) |
| Leading Sub-Region | Cambridge, Oxford, and Midlands medical technology corridors |
United Kingdom Medical Device Contract Manufacturing Market Outlook
United Kingdom medical device contract manufacturing demand is shaped by SME supplier depth and strong clinical innovation corridors. OEMs and startups need partners that can support design transfer, packaging, and validation before market entry.
The post-market surveillance environment raises documentation demands. Contract manufacturers with audit-ready records and UKCA support can improve buyer confidence.
Key Growth Drivers
- Medtech turnover supports outsourcing demand. The Office for Life Sciences reported in October 2025 that the medical technology subsector generated GBP 48.0 billion in turnover in 2023 to 2024.
- Supplier breadth supports partner discovery. The U.S. International Trade Administration stated in January 2026 that the UK medtech industry included more than 4,000 businesses.
- Diagnostics and connected-care startups are expected to need design-transfer partners before moving into repeat production.
- NHS innovation pathways can support small-batch validation demand where clinical programs require regulated prototype conversion.
Key Restraints
- Post-market surveillance work raises documentation pressure. MHRA guidance updated in March 2026 states that new PMS requirements took effect from 16 June 2025.
- Dual UK and EU compliance planning can slow supplier approval when OEMs target both market routes.
- Smaller device firms may delay outsourced production when capital funding remains tied to clinical or regulatory milestones.
What makes United Kingdom unique
The United Kingdom is unique due to SME medtech depth and UKCA-linked documentation needs.
Key Companies
- Smith & Nephew plc
- Pennine Healthcare
- Carclo Technical Plastics
- Europlaz Technologies Ltd.
- G&H | ITL
- Kimal plc
- Cirtec Medical UK
Sales & Marketing Channels
- Direct OEM qualification
- Clinical innovation corridors
- NHS-linked supplier discovery
- UKCA documentation support
- Design-transfer partnerships
- Specialist component networks
Country Segment Breakdown Table
| Segment | Sub-Segments |
|---|---|
| By Service Type | Finished Devices · Components · Assembly · Packaging · Sterilization |
| By Device Class | Class II · Class III · Class I · IVD |
| By Application | Cardiovascular · Orthopedics · Diagnostics · Drug Delivery · Surgical |
| By Manufacturing Process | Injection Molding · CNC Machining · Metal Processing · Electronics Assembly · Additive Fabrication |
| By Customer Type | Large OEMs · Mid-Size OEMs · Startups · Hospital Programs |
| Key Sub-Regions Covered | Cambridge · Oxford · Midlands · London · Manchester · Wales |
Frequently Asked Questions
How fast is United Kingdom medical device contract manufacturing market growing?
The United Kingdom is forecast to grow at 11.2% CAGR from 2026 to 2036 through medtech supplier depth.
Who leads United Kingdom medical device contract manufacturing market?
Smith & Nephew, Pennine Healthcare, Europlaz, Carclo, G&H ITL, and Kimal compete through local medtech programs.
What is driving adoption in United Kingdom medical device contract manufacturing market?
Medtech turnover and SME manufacturing depth are supporting design-transfer and validation partnerships.
What is the medical device contract manufacturing forecast for France?
A 10.6% CAGR through 2036 reflects device turnover and export-oriented medtech activity.
Country Market Snapshot Table
| Parameter | Value |
|---|---|
| Market Size in 2025 (Value) | USD 4,520.8 million |
| Market Size in 2026 (Value) | USD 5,000.0 million |
| Market Forecast in 2036 (Value) | USD 13,700.2 million |
| CAGR (2026 to 2036) | 10.6% |
| Years Considered | 2021 to 2036 |
| Base Year | 2025 |
| Forecast Period | 2026 to 2036 |
| Units Considered | Value (USD million) |
| Leading Sub-Region | Île-de-France, Lyon, Grenoble, and export-oriented medtech corridors |
France Medical Device Contract Manufacturing Market Outlook
France medical device contract manufacturing demand is shaped by medtech turnover and export-oriented production. Contract manufacturers support diagnostics, implants, surgical tools, and connected device programs.
Supplier qualification depends on EU regulatory documentation and clinical-market access needs. French suppliers with design-transfer capability can serve OEMs that need European production credibility.
Key Growth Drivers
- Device turnover supports production partnerships. The U.S. International Trade Administration estimated France’s medical devices turnover at USD 41.6 billion in 2024.
- European innovation depth supports French supplier specialization. MedTech Europe reported more than 15,700 medtech patent applications filed with the EPO in 2024.
- EU documentation rules are expected to favor suppliers that can support technical files and production validation.
- SME-led device activity can create demand for contract manufacturing partners that handle design transfer and pilot production.
Key Restraints
- High national health spending tightens reimbursement scrutiny. OECD reported in November 2025 that France spent 11.5% of GDP on health in 2024.
- Smaller OEMs may struggle to fund validation batches before reimbursement and clinical adoption are clearer.
- EU launch planning can slow supplier transfer when multiple country requirements affect labeling and packaging control.
What makes France unique
France is unique due to export-oriented device activity and European clinical documentation needs.
Key Companies
- Medefab
- Sonceboz Medical
- Sotralentz Packaging Healthcare
- Vygon
- SGH Healthcaring
- Groupe Plastivaloire Healthcare
- Eolane Medical
Sales & Marketing Channels
- Direct OEM qualification
- EU technical-file support
- Hospital-linked pilot production
- Export manufacturing partnerships
- Diagnostics supply networks
- Specialist plastics and electronics sourcing
Country Segment Breakdown Table
| Segment | Sub-Segments |
|---|---|
| By Service Type | Finished Devices · Components · Assembly · Packaging · Sterilization |
| By Device Class | Class II · Class III · Class I · IVD |
| By Application | Cardiovascular · Orthopedics · Diagnostics · Drug Delivery · Surgical |
| By Manufacturing Process | Injection Molding · CNC Machining · Metal Processing · Electronics Assembly · Additive Fabrication |
| By Customer Type | Large OEMs · Mid-Size OEMs · Startups · Hospital Programs |
| Key Sub-Regions Covered | Île-de-France · Lyon · Grenoble · Toulouse · Lille · Nantes |
Frequently Asked Questions
How fast is France medical device contract manufacturing market growing?
France is projected to grow at 10.6% CAGR from 2026 to 2036 through medtech production partnerships.
Who leads France medical device contract manufacturing market?
Medefab, Vygon, SGH Healthcaring, Sonceboz Medical, and Eolane Medical compete through device manufacturing support.
What is driving adoption in France medical device contract manufacturing market?
Device turnover and EU documentation needs are supporting demand for design-transfer and production partners.
How fast is the medical device contract manufacturing market growing in Germany?
A 10.4% CAGR through 2036 reflects precision medtech production and high-value component manufacturing.
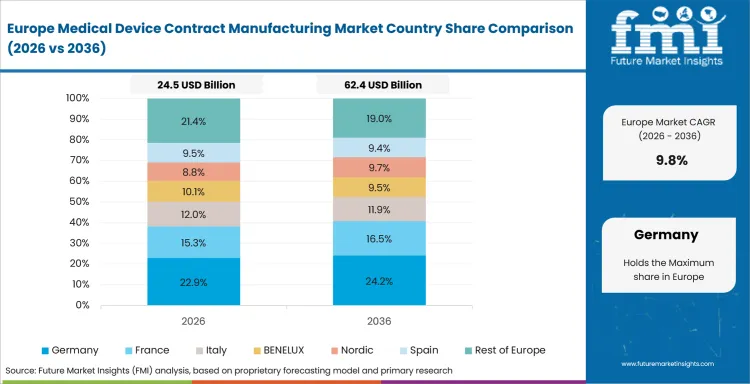
Country Market Snapshot Table
| Parameter | Value |
|---|---|
| Market Size in 2025 (Value) | USD 8,786.2 million |
| Market Size in 2026 (Value) | USD 9,700.0 million |
| Market Forecast in 2036 (Value) | USD 26,096.6 million |
| CAGR (2026 to 2036) | 10.4% |
| Years Considered | 2021 to 2036 |
| Base Year | 2025 |
| Forecast Period | 2026 to 2036 |
| Units Considered | Value (USD million) |
| Leading Sub-Region | Baden-Württemberg, Bavaria, and North Rhine-Westphalia medtech corridors |
Germany Medical Device Contract Manufacturing Market Outlook
Germany medical device contract manufacturing demand is shaped by precision engineering and large medtech production value. OEMs use German suppliers for implants, surgical tools, diagnostics parts, and high-tolerance assemblies.
Supplier selection is heavily tied to quality systems and technical documentation. High labor costs push suppliers toward automation and higher-value manufacturing programs.
Key Growth Drivers
- Production depth supports high-value outsourcing. Germany Trade & Invest reported Germany medtech production value at EUR 46.0 billion in 2024.
- Supplier breadth supports complex device work. SPECTARIS reported in April 2025 that Germany had around 1,510 medtech manufacturers in 2024.
- Orthopedic and surgical tool production is expected to support CNC machining and validated metal processing demand.
- Engineering-led suppliers can win transfer work where OEMs need design refinement before commercial release.
Key Restraints
- Market access pressure raises documentation workload. The U.S. International Trade Administration stated in August 2025 that Germany accounted for 26.5% of the European medical device market.
- High labor and energy costs can reduce margin in basic molding and machining work.
- Smaller manufacturers may avoid Class III transfer work when validation cost and liability exposure exceed expected order volume.
What makes Germany unique
Germany is unique due to precision engineering depth and high-value medtech component specialization.
Key Companies
- Gerresheimer AG
- Nolato Treff AG
- Freudenberg Medical Europe GmbH
- RAUMEDIC AG
- Sanner GmbH
- KLS Martin Group
- B. Braun OEM Division
Sales & Marketing Channels
- Direct OEM qualification
- Precision component programs
- MDR documentation support
- Orthopedic manufacturing corridors
- Sterile packaging networks
- Engineering-led supplier partnerships
Country Segment Breakdown Table
| Segment | Sub-Segments |
|---|---|
| By Service Type | Finished Devices · Components · Assembly · Packaging · Sterilization |
| By Device Class | Class II · Class III · Class I · IVD |
| By Application | Cardiovascular · Orthopedics · Diagnostics · Drug Delivery · Surgical |
| By Manufacturing Process | Injection Molding · CNC Machining · Metal Processing · Electronics Assembly · Additive Fabrication |
| By Customer Type | Large OEMs · Mid-Size OEMs · Startups · Hospital Programs |
| Key Sub-Regions Covered | Baden-Württemberg · Bavaria · North Rhine-Westphalia · Hesse · Berlin · Hamburg |
Frequently Asked Questions
How fast is Germany medical device contract manufacturing market growing?
Germany is estimated to grow at 10.4% CAGR from 2026 to 2036 through precision medtech production.
Who leads Germany medical device contract manufacturing market?
Gerresheimer, Nolato Treff, Freudenberg Medical, RAUMEDIC, Sanner, and KLS Martin compete through device component depth.
What is driving adoption in Germany medical device contract manufacturing market?
Precision engineering and medtech production value are supporting outsourced component and finished-device programs.
What is the medical device contract manufacturing outlook in Japan?
A 9.8% CAGR through 2036 reflects precision manufacturing and structured PMDA compliance.
Country Market Snapshot Table
| Parameter | Value |
|---|---|
| Market Size in 2025 (Value) | USD 6,375.2 million |
| Market Size in 2026 (Value) | USD 7,000.0 million |
| Market Forecast in 2036 (Value) | USD 17,858.4 million |
| CAGR (2026 to 2036) | 9.8% |
| Years Considered | 2021 to 2036 |
| Base Year | 2025 |
| Forecast Period | 2026 to 2036 |
| Units Considered | Value (USD million) |
| Leading Sub-Region | Tokyo, Osaka, Aichi, and Kanagawa precision device clusters |
Japan Medical Device Contract Manufacturing Market Outlook
Japan medical device contract manufacturing demand is shaped by precision supplier capability and structured regulatory approval. OEMs need partners that can meet PMDA expectations and maintain documentation discipline.
Demand is strongest in diagnostics, surgical tools, imaging components, and aging-care devices. Foreign suppliers face entry friction when documentation and local authorization routes are not planned early.
Key Growth Drivers
- Market size supports contract manufacturing demand. The U.S. International Trade Administration stated in November 2025 that MHLW data placed Japan’s 2024 medical device market at USD 32.0 billion.
- PMDA rules create a structured supplier gate. PMDA states that Japan classifies medical devices into four risk classes before foreign manufacturers use approval, certification, or notification routes.
- Precision production clusters are expected to support imaging parts, surgical instruments, and electronics-intensive device programs.
- Aging-care demand is expected to support contract manufacturing for monitoring devices and home-use medical equipment.
Key Restraints
- Import-market exposure keeps qualification cautious. JETRO reported in 2025 that Japan accounted for 5.7% of the global medical devices market in 2024.
- Domestic OEMs may prefer established supplier networks when new contract manufacturers lack local regulatory experience.
- Foreign contract manufacturers can face slower entry when MAH coordination and Japanese-language documentation are incomplete.
What makes Japan unique
Japan is unique due to precision supplier capability and structured PMDA approval requirements.
Key Companies
- Nipro Corporation
- Terumo Corporation
- Asahi Intecc Co. Ltd.
- JMS Co. Ltd.
- Mani Inc.
- Fukuda Denshi Co. Ltd.
- Nikkiso Co. Ltd.
Sales & Marketing Channels
- Direct OEM qualification
- PMDA-linked supplier registration
- Precision machining clusters
- Diagnostics assembly partnerships
- Hospital-facing device programs
- Aging-care device supply networks
Country Segment Breakdown Table
| Segment | Sub-Segments |
|---|---|
| By Service Type | Finished Devices · Components · Assembly · Packaging · Sterilization |
| By Device Class | Class II · Class III · Class I · IVD |
| By Application | Cardiovascular · Orthopedics · Diagnostics · Drug Delivery · Surgical |
| By Manufacturing Process | Injection Molding · CNC Machining · Metal Processing · Electronics Assembly · Additive Fabrication |
| By Customer Type | Large OEMs · Mid-Size OEMs · Startups · Hospital Programs |
| Key Sub-Regions Covered | Tokyo · Osaka · Aichi · Kanagawa · Shizuoka · Fukuoka |
Frequently Asked Questions
How fast is Japan medical device contract manufacturing market growing?
Japan is forecast to record 9.8% CAGR from 2026 to 2036 through precision manufacturing and PMDA discipline.
Who leads Japan medical device contract manufacturing market?
Nipro, Terumo, Asahi Intecc, JMS, Mani, Fukuda Denshi, and Nikkiso compete through precision device manufacturing.
What is driving adoption in Japan medical device contract manufacturing market?
Precision supplier capability and structured regulatory approval are supporting selective outsourcing.
Who are the leading companies in the medical device contract manufacturing market?
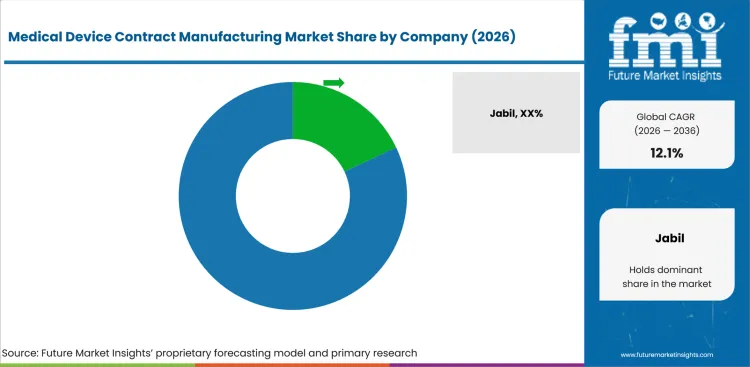
- The market is moderately concentrated because large OEMs qualify fewer suppliers for larger device programs.
- Jabil, Flex, Integer Holdings, Sanmina, and TE Connectivity hold advantages in global reach and quality-system depth.
- Specialist companies win with micro-molding, nitinol processing, battery integration, coatings, and catheter assembly.
- Entry barriers include ISO 13485 certification, cleanroom capital, process validation, and customer audit history.
Established suppliers compete on the ability to carry a device from design transfer into repeat production. Flex’s March 2025 NPI center near Boston shows how major suppliers are placing engineering and validation closer to healthcare innovation clusters. This gives large suppliers an advantage before the buyer reaches mass production. It also changes the value of early supplier involvement. Buyers reduce launch risk when process design, validation, and production planning are handled by one qualified partner. Capability depth separates global suppliers from component-only vendors. TE Connectivity expanded medical prototyping into Plymouth, Minnesota and Wilsonville, Oregon in November 2025, adding quick prototypes, 3D printing, polymer extrusion, and material testing.
This helps customers test concepts before locking design choices. Similar capability depth matters in manufacturing on demand for medical, wearable medical devices, and validated prototype-to-production work. Smaller specialist companies win when they solve a hard manufacturing problem better than a large generalist. Resonetics acquired Eden Holdings in September 2025, adding micro-molding, insert molding, advanced machining, and tooling for critical medical devices. This type of capability matters when OEMs need polymer precision or miniature components.
It supports adjacent demand for preclinical medical device testing services and medical device trays where device handling and validation connect to production. Entry is difficult because customers buy evidence before they buy capacity. Sanmina’s Fermoy expansion included an ISO 8 cleanroom and automation lines for wearable medical devices, which shows how capital intensity is moving into validated environments. New entrants must prove process control, audit readiness, and change management before they win meaningful programs. Packaging-related services in industry analysis of medical device packaging in southeast asia show how regional capacity matters when sterile formats and supply continuity shape buyer decisions.
Who are the key players in the medical device contract manufacturing market?
The market is best understood through a role-based taxonomy built around manufacturing depth and regulated production control.
Integrated Global CDMOs: Jabil, Flex, Integer Holdings, and Sanmina compete on global plant networks, ISO 13485 systems, and end-to-end production support. Jabil is estimated to hold 7.5% share among profiled suppliers, while Flex has NPI capacity near Boston and Sanmina has expanded European medical device cleanroom capacity.
Specialist Component and Technology Suppliers: TE Connectivity and Resonetics compete through components, prototyping, catheter technologies, molding, nitinol, coatings, sensors, and precision manufacturing. TE’s PROPELUS centers support design iteration, while Resonetics has expanded through acquisitions in micro-molding and integrated device capabilities.
Focused Contract Manufacturers: Viant and other focused suppliers compete in device assembly, sterile and non-sterile manufacturing, orthopedic implants, and engineering support. These suppliers are important where OEMs need a narrower but deeper capability set tied to specific applications or validated production steps.
How do top medical device contract manufacturing companies compare?
| Company | Design Transfer Depth | Cleanroom Assembly Control | Regulated Component Breadth | Geographic Footprint |
|---|---|---|---|---|
| Jabil | High | Strong | Strong | Global |
| Flex | High | Strong | Strong | Global |
| Integer Holdings | High | Medium | Strong | Global |
| Sanmina | Medium | Strong | Medium | North America and Europe |
| TE Connectivity | High | Medium | Strong | Global |
| Viant | Medium | Strong | Medium | North America and Europe |
| Resonetics | High | Medium | Strong | North America and Europe |
| Phillips Medisize | High | Strong | Strong | North America, Europe, and Asia |
| Gerresheimer | Medium | Strong | Medium | Global |
| Nolato | Medium | Medium | Medium | Europe, Asia, and North America |
Future Market Insights competitive analysis, 2026. Ratings reflect relative positioning based on design transfer depth, cleanroom assembly control, and regulated component breadth.
Key Developments in Medical Device Contract Manufacturing Market
- In September 2024, Molex signed an agreement to acquire Vectura Group for Phillips Medisize. The deal adds inhalation formulation and device development capabilities.
- In March 2025, Flex opened a healthcare NPI center near Boston. The center supports prototype, preclinical build, design verification, and production transfer work.
- In September 2025, Resonetics acquired Eden Holdings. The acquisition added micro-molding, insert molding, advanced machining, and tooling for critical medical devices.
- In November 2025, TE Connectivity expanded PROPELUS prototype centers into Minnesota and Oregon. The sites support quick prototypes and material testing for medical device customers.
- In November 2025, Sanmina expanded its Fermoy medical facility in Ireland. The expansion includes a new ISO 8 cleanroom and wearable-device automation lines.
Key Players in the Medical Device Contract Manufacturing Market
Integrated Global CDMOs
- Jabil
- Flex
- Integer Holdings
- Sanmina
Specialist Component and Technology Suppliers
- TE Connectivity
- Resonetics
Focused Contract Manufacturers
- Viant
- Phillips Medisize
- Gerresheimer
- Nolato
Medical Device Contract Manufacturing Market - Report Scope
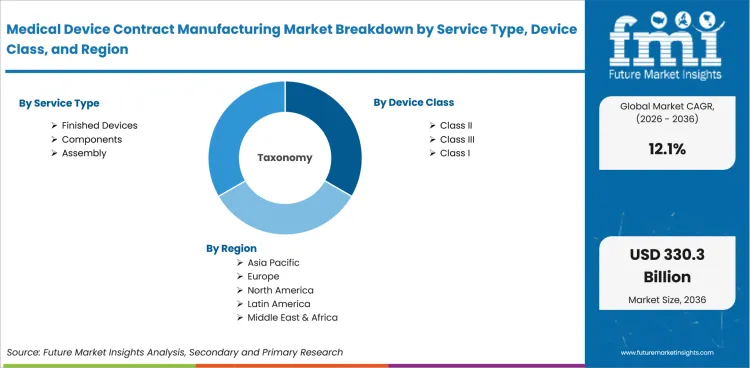
| Item | Value |
|---|---|
| Market size by 2036 | USD 330.35 billion |
| Growth rate | 12.1% CAGR from 2026 to 2036 |
| Forecast period | 2026 to 2036 |
| Base year value (2025) | USD 93.80 billion |
| By service type | Finished devices, components, assembly, packaging, sterilization |
| By device class | Class II, Class III, Class I, IVD |
| By application | Cardiovascular, orthopedics, diagnostics, drug delivery, surgical |
| By manufacturing process | Injection molding, CNC machining, metal processing, electronics assembly, additive fabrication |
| By customer type | Large OEMs, mid-size OEMs, startups, hospital programs |
| Regions covered | North America, Latin America, Europe, East Asia, South Asia and Pacific, Middle East and Africa |
| Countries covered | India, China, United States, United Kingdom, France, Germany, Japan |
| Key companies profiled | Jabil, Flex, Integer Holdings, Sanmina, TE Connectivity, Viant, Resonetics, Phillips Medisize, Gerresheimer, Nolato |
| Approach | Bottom-up supplier-boundary approach using device launch volume, cleanroom capacity, production-transfer intensity, quality-system depth, and country-level manufacturing activity |
Medical Device Contract Manufacturing Market - Scope & Definition
| Attribute | Detail |
|---|---|
| Market Definition | Outsourced manufacturing services for regulated medical devices, including design transfer, component production, assembly, packaging, sterilization coordination, validation support, and production release activities |
| Functions Covered | Design transfer, production engineering, precision component manufacturing, cleanroom assembly, device packaging, sterilization coordination, release testing support, and quality documentation |
| Applications Covered | Cardiovascular devices, orthopedic implants, diagnostic devices, drug delivery systems, surgical tools, wearable clinical devices, and home-care medical devices |
| End-Use Industries | Medical device OEMs, diagnostics companies, drug delivery device firms, hospital device programs, digital health device developers, and surgical technology companies |
| Grades Covered | Class I, Class II, Class III, and IVD device manufacturing programs with different validation and release-control requirements |
| Inclusions | Finished device manufacturing, molded components, machined implants, electronic assemblies, sterile packaging, cleanroom assembly, design-transfer support, and regulatory manufacturing documentation |
| Exclusions | Branded device sales by OEMs, pharmaceutical API manufacturing, biologics fill-finish, hospital device reprocessing, refurbished equipment resale, consumer wellness devices without medical claims, and unregulated repair services |
Medical Device Contract Manufacturing Market - Research Methodology
| Method | Description |
|---|---|
| Primary Research | FMI analyst interviews with medical device OEMs, contract manufacturers, component suppliers, cleanroom operators, sterilization partners, packaging specialists, and quality-system consultants across key markets |
| Desk Research | Review of FDA establishment data, NMPA updates, MHRA regulatory material, national medtech output data, official company disclosures, trade data, and peer-reviewed manufacturing references |
| Market Sizing & Forecasting | Bottom-up model combining supplier revenue pools, service scope, device-class outsourcing intensity, cleanroom capacity, country production depth, and customer qualification cycles |
| Data Validation | Cross-verification using regulatory registration data, company capability disclosures, national production and export indicators, country manufacturing programs, and expert review of device manufacturing boundaries |
Medical Device Contract Manufacturing Market by Segments
Medical Device Contract Manufacturing Market Segmented by Service Type:
- Finished Devices
- Components
- Assembly
- Packaging
- Sterilization
Medical Device Contract Manufacturing Market Segmented by Device Class:
- Class II
- Class III
- Class I
- IVD
Medical Device Contract Manufacturing Market Segmented by Application:
- Cardiovascular
- Orthopedics
- Diagnostics
- Drug Delivery
- Surgical
Medical Device Contract Manufacturing Market Segmented by Manufacturing Process:
- Injection Molding
- CNC Machining
- Metal Processing
- Electronics Assembly
- Additive Fabrication
Medical Device Contract Manufacturing Market Segmented by Customer Type:
- Large OEMs
- Mid-Size OEMs
- Startups
- Hospital Programs
Medical Device Contract Manufacturing Market by Region:
- North America
- United States
- Canada
- Mexico
- Latin America
- Brazil
- Chile
- Rest of Latin America
- Western Europe
- Germany
- UK
- Italy
- Spain
- France
- Nordic
- BENELUX
- Rest of Western Europe
- Eastern Europe
- Russia
- Poland
- Hungary
- Balkan & Baltic
- Rest of Eastern Europe
- East Asia
- China
- Japan
- South Korea
- South Asia and Pacific
- India
- ASEAN
- Australia & New Zealand
- Rest of South Asia and Pacific
- Middle East & Africa
- Kingdom of Saudi Arabia
- Other GCC Countries
- Turkiye
- South Africa
- Other African Union
- Rest of Middle East & Africa
Research Sources and Bibliography
- USA Food and Drug Administration. (2025, July). FY 2024 Annual Report on Inspections of Establishments. USA Food and Drug Administration.
- European Commission. (2025, November 27). The EUDAMED four first modules will be mandatory to use as of 28 May 2026. European Commission.
- Government of India Press Information Bureau. (2025, December 5). Implementation of the National Medical Devices Policy, 2023. Press Information Bureau.
- Germany Trade & Invest. (2025, September). The Medical Technology Industry in Germany. Germany Trade & Invest.
- USA International Trade Administration. (2026, May 22). France - Healthcare and Life Sciences. International Trade Administration.
- USA International Trade Administration. (2025, November 18). Japan - Medical Devices. International Trade Administration.
- National Medical Products Administration. (2025, August). Annual statistical report on drug supervision and administration. National Medical Products Administration.
- Flex. (2025, March 20). Flex Opens New Product Introduction Center Serving Healthcare Customers in North America. Flex Investor Relations.
- TE Connectivity. (2025, November 20). TE Connectivity expands medical device prototyping capabilities into United States. TE Connectivity.
- Resonetics. (2025, September 29). Resonetics acquires Eden Holdings, adding injection molding to its capabilities. Resonetics.
- Resonetics. (2026, March 23). Resonetics Completes the Acquisition of Resolution Medical, Expanding End-to-End Integrated Capabilities for Interventional and Neuromodulation Markets. Resonetics.
- Phillips Medisize. (2024, September 17). Molex, a Parent to Phillips Medisize, Announces Agreement to Acquire the Vectura Group Limited, Expanding Its Drug Delivery Capabilities in Inhalation. Phillips Medisize.
- Sanmina Corporation. (2025, November 3). Sanmina Announces Expansion of Ireland Manufacturing Site, Creating up to 150 Jobs. IDA Ireland.
- Integer Holdings Corporation. (2026, January 28). Integer to Highlight Integrated R&D Solutions and Expanded Coating Capabilities During MD&M West 2026. Integer Holdings Corporation.
- Gerresheimer. (2024, May 27). Gerresheimer expands capacities for Medical Systems in the USA. Gerresheimer.
- National Bureau of Statistics of China. (2026, February 28). Statistical communiqué of the People’s Republic of China on the 2025 national economic and social development. National Bureau of Statistics of China.
- National Medical Products Administration. (2025, June 11). NMPA Announcement on Further Improvement and Optimization of Matters Concerning the Production of Imported Medical Devices in Domestic Enterprises in China (No. 30, 2025). National Medical Products Administration.
- USA International Trade Administration. (2026, January 30). United Kingdom - Medical Technology and Digital Healthcare. International Trade Administration.
- Office for Life Sciences. (2025, October 2). Bioscience and health technology sector statistics 2023 to 2024. GOV.UK.
- Medicines and Healthcare products Regulatory Agency. (2026, March 12). Implementation of the future regulations. GOV.UK.
- USA Bureau of Labor Statistics. (2026, June 11). Producer Price Indexes — May 2026. USA Bureau of Labor Statistics.
- USA International Trade Administration. (2025, June 3). India Medical Devices. International Trade Administration.
- India Brand Equity Foundation. (2026). Medical devices industry in India. India Brand Equity Foundation.
- European Commission. (2025, June 19). Commission restricts Chinese participation in medical devices procurement. European Commission.
- SPECTARIS. (2025, April). The German medical technology industry. SPECTARIS.
- MedTech Europe. (2025, September). The European medical technology industry in figures 2025. MedTech Europe.
- USA International Trade Administration. (2026, January 30). United States - Medical Technology and Digital Healthcare. International Trade Administration.
- Pharmaceuticals and Medical Devices Agency. (2025). Regulations and approval/certification of medical devices. Pharmaceuticals and Medical Devices Agency.
- OECD. (2025, November 13). Health at a Glance 2025: France. OECD.
- USA International Trade Administration. (2025, August 1). Germany - Healthcare and Medical Technology. International Trade Administration.
The bibliography is provided for reader reference, and sources are primary non-commercial government, regulatory, academic, trade body, or official company publications.
This Report Answers
- Market size estimates for 2026 and forecasts through 2036 for the medical device contract manufacturing market.
- Insights across more than 30 regional and country-level markets.
- Analysis of demand drivers, outsourcing patterns, supplier qualification needs, and purchasing behavior.
- Evaluation of service types, device classes, applications, manufacturing processes, and customer groups.
- Assessment of FDA, NMPA, MHRA, PMDA, and EU regulatory impacts on contract manufacturing demand.
- Identification of opportunities across design transfer, cleanroom assembly, sterile packaging, and precision components.
- Evaluation of supply chain dynamics, cleanroom capacity, product launch support, and documentation requirements.
- Country-level growth analysis covering India, China, the United States, the United Kingdom, France, Germany, and Japan.
- Assessment of the competitive landscape, including global CDMOs and specialist component manufacturers.
- Delivery of market data, forecasts, and supporting analysis in PDF and Excel formats.
Frequently Asked Questions
What is the medical device contract manufacturing market size in 2026?
The medical device contract manufacturing market size is anticipated to cross USD 105.15 billion in 2026.
What is the medical device contract manufacturing market forecast for 2036?
The medical device contract manufacturing industry revenue is predicted to reach USD 330.35 billion by 2036 as OEM outsourcing expands.
What is the medical device contract manufacturing market CAGR?
The medical device contract manufacturing sector is projected to expand at 12.1% CAGR from 2026 to 2036.
What segment leads the medical device contract manufacturing market?
Finished devices are likely to capture 38.0% share in 2026 due to final assembly and release-control outsourcing.
What country grows fastest in the medical device contract manufacturing market?
India is set to record 14.2% CAGR by 2036, driven by medical device parks and domestic production support.
Preview the report firsthand - request a free sample
Get SampleGet the brochure for pricing and purchase details.
Get PDFTable of Content
- Executive Summary
- Global Market Outlook
- Demand to side Trends
- Supply to side Trends
- Technology Roadmap Analysis
- Analysis and Recommendations
- Market Overview
- Market Coverage / Taxonomy
- Market Definition / Scope / Limitations
- Research Methodology
- Chapter Orientation
- Analytical Lens and Working Hypotheses
- Market Structure, Signals, and Trend Drivers
- Benchmarking and Cross-market Comparability
- Market Sizing, Forecasting, and Opportunity Mapping
- Research Design and Evidence Framework
- Desk Research Programme (Secondary Evidence)
- Company Annual and Sustainability Reports
- Peer-reviewed Journals and Academic Literature
- Corporate Websites, Product Literature, and Technical Notes
- Earnings Decks and Investor Briefings
- Statutory Filings and Regulatory Disclosures
- Technical White Papers and Standards Notes
- Trade Journals, Industry Magazines, and Analyst Briefs
- Conference Proceedings, Webinars, and Seminar Materials
- Government Statistics Portals and Public Data Releases
- Press Releases and Reputable Media Coverage
- Specialist Newsletters and Curated Briefings
- Sector Databases and Reference Repositories
- FMI Internal Proprietary Databases and Historical Market Datasets
- Subscription Datasets and Paid Sources
- Social Channels, Communities, and Digital Listening Inputs
- Additional Desk Sources
- Expert Input and Fieldwork (Primary Evidence)
- Primary Modes
- Qualitative Interviews and Expert Elicitation
- Quantitative Surveys and Structured Data Capture
- Blended Approach
- Why Primary Evidence is Used
- Field Techniques
- Interviews
- Surveys
- Focus Groups
- Observational and In-context Research
- Social and Community Interactions
- Stakeholder Universe Engaged
- C-suite Leaders
- Board Members
- Presidents and Vice Presidents
- R&D and Innovation Heads
- Technical Specialists
- Domain Subject-matter Experts
- Scientists
- Physicians and Other Healthcare Professionals
- Governance, Ethics, and Data Stewardship
- Research Ethics
- Data Integrity and Handling
- Primary Modes
- Tooling, Models, and Reference Databases
- Desk Research Programme (Secondary Evidence)
- Data Engineering and Model Build
- Data Acquisition and Ingestion
- Cleaning, Normalisation, and Verification
- Synthesis, Triangulation, and Analysis
- Quality Assurance and Audit Trail
- Market Background
- Market Dynamics
- Drivers
- Restraints
- Opportunity
- Trends
- Scenario Forecast
- Demand in Optimistic Scenario
- Demand in Likely Scenario
- Demand in Conservative Scenario
- Opportunity Map Analysis
- Product Life Cycle Analysis
- Supply Chain Analysis
- Investment Feasibility Matrix
- Value Chain Analysis
- PESTLE and Porter’s Analysis
- Regulatory Landscape
- Regional Parent Market Outlook
- Production and Consumption Statistics
- Import and Export Statistics
- Market Dynamics
- Global Market Analysis 2021 to 2025 and Forecast, 2026 to 2036
- Historical Market Size Value (USD Million) Analysis, 2021 to 2025
- Current and Future Market Size Value (USD Million) Projections, 2026 to 2036
- Y to o to Y Growth Trend Analysis
- Absolute $ Opportunity Analysis
- Global Market Pricing Analysis 2021 to 2025 and Forecast 2026 to 2036
- Global Market Analysis 2021 to 2025 and Forecast 2026 to 2036, By Service Type
- Introduction / Key Findings
- Historical Market Size Value (USD Million) Analysis By Service Type , 2021 to 2025
- Current and Future Market Size Value (USD Million) Analysis and Forecast By Service Type , 2026 to 2036
- Finished Devices
- Components
- Assembly
- Finished Devices
- Y to o to Y Growth Trend Analysis By Service Type , 2021 to 2025
- Absolute $ Opportunity Analysis By Service Type , 2026 to 2036
- Global Market Analysis 2021 to 2025 and Forecast 2026 to 2036, By Device Class
- Introduction / Key Findings
- Historical Market Size Value (USD Million) Analysis By Device Class, 2021 to 2025
- Current and Future Market Size Value (USD Million) Analysis and Forecast By Device Class, 2026 to 2036
- Class II
- Class III
- Class I
- Class II
- Y to o to Y Growth Trend Analysis By Device Class, 2021 to 2025
- Absolute $ Opportunity Analysis By Device Class, 2026 to 2036
- Global Market Analysis 2021 to 2025 and Forecast 2026 to 2036, By Application
- Introduction / Key Findings
- Historical Market Size Value (USD Million) Analysis By Application, 2021 to 2025
- Current and Future Market Size Value (USD Million) Analysis and Forecast By Application, 2026 to 2036
- Cardiovascular
- Orthopedics
- Diagnostics
- Cardiovascular
- Y to o to Y Growth Trend Analysis By Application, 2021 to 2025
- Absolute $ Opportunity Analysis By Application, 2026 to 2036
- Global Market Analysis 2021 to 2025 and Forecast 2026 to 2036, By Manufacturing Process
- Introduction / Key Findings
- Historical Market Size Value (USD Million) Analysis By Manufacturing Process, 2021 to 2025
- Current and Future Market Size Value (USD Million) Analysis and Forecast By Manufacturing Process, 2026 to 2036
- Injection molding
- CNC Machining
- Metal Processing
- Injection molding
- Y to o to Y Growth Trend Analysis By Manufacturing Process, 2021 to 2025
- Absolute $ Opportunity Analysis By Manufacturing Process, 2026 to 2036
- Global Market Analysis 2021 to 2025 and Forecast 2026 to 2036, By Customer Type
- Introduction / Key Findings
- Historical Market Size Value (USD Million) Analysis By Customer Type, 2021 to 2025
- Current and Future Market Size Value (USD Million) Analysis and Forecast By Customer Type, 2026 to 2036
- Large OEMs
- Mid-Size OEMs
- Startups
- Large OEMs
- Y to o to Y Growth Trend Analysis By Customer Type, 2021 to 2025
- Absolute $ Opportunity Analysis By Customer Type, 2026 to 2036
- Global Market Analysis 2021 to 2025 and Forecast 2026 to 2036, By Region
- Introduction
- Historical Market Size Value (USD Million) Analysis By Region, 2021 to 2025
- Current Market Size Value (USD Million) Analysis and Forecast By Region, 2026 to 2036
- North America
- Latin America
- Western Europe
- Eastern Europe
- East Asia
- South Asia and Pacific
- Middle East & Africa
- Market Attractiveness Analysis By Region
- North America Market Analysis 2021 to 2025 and Forecast 2026 to 2036, By Country
- Historical Market Size Value (USD Million) Trend Analysis By Market Taxonomy, 2021 to 2025
- Market Size Value (USD Million) Forecast By Market Taxonomy, 2026 to 2036
- By Country
- USA
- Canada
- Mexico
- By Service Type
- By Device Class
- By Application
- By Manufacturing Process
- By Customer Type
- By Country
- Market Attractiveness Analysis
- By Country
- By Service Type
- By Device Class
- By Application
- By Manufacturing Process
- By Customer Type
- Key Takeaways
- Latin America Market Analysis 2021 to 2025 and Forecast 2026 to 2036, By Country
- Historical Market Size Value (USD Million) Trend Analysis By Market Taxonomy, 2021 to 2025
- Market Size Value (USD Million) Forecast By Market Taxonomy, 2026 to 2036
- By Country
- Brazil
- Chile
- Rest of Latin America
- By Service Type
- By Device Class
- By Application
- By Manufacturing Process
- By Customer Type
- By Country
- Market Attractiveness Analysis
- By Country
- By Service Type
- By Device Class
- By Application
- By Manufacturing Process
- By Customer Type
- Key Takeaways
- Western Europe Market Analysis 2021 to 2025 and Forecast 2026 to 2036, By Country
- Historical Market Size Value (USD Million) Trend Analysis By Market Taxonomy, 2021 to 2025
- Market Size Value (USD Million) Forecast By Market Taxonomy, 2026 to 2036
- By Country
- Germany
- UK
- Italy
- Spain
- France
- Nordic
- BENELUX
- Rest of Western Europe
- By Service Type
- By Device Class
- By Application
- By Manufacturing Process
- By Customer Type
- By Country
- Market Attractiveness Analysis
- By Country
- By Service Type
- By Device Class
- By Application
- By Manufacturing Process
- By Customer Type
- Key Takeaways
- Eastern Europe Market Analysis 2021 to 2025 and Forecast 2026 to 2036, By Country
- Historical Market Size Value (USD Million) Trend Analysis By Market Taxonomy, 2021 to 2025
- Market Size Value (USD Million) Forecast By Market Taxonomy, 2026 to 2036
- By Country
- Russia
- Poland
- Hungary
- Balkan & Baltic
- Rest of Eastern Europe
- By Service Type
- By Device Class
- By Application
- By Manufacturing Process
- By Customer Type
- By Country
- Market Attractiveness Analysis
- By Country
- By Service Type
- By Device Class
- By Application
- By Manufacturing Process
- By Customer Type
- Key Takeaways
- East Asia Market Analysis 2021 to 2025 and Forecast 2026 to 2036, By Country
- Historical Market Size Value (USD Million) Trend Analysis By Market Taxonomy, 2021 to 2025
- Market Size Value (USD Million) Forecast By Market Taxonomy, 2026 to 2036
- By Country
- China
- Japan
- South Korea
- By Service Type
- By Device Class
- By Application
- By Manufacturing Process
- By Customer Type
- By Country
- Market Attractiveness Analysis
- By Country
- By Service Type
- By Device Class
- By Application
- By Manufacturing Process
- By Customer Type
- Key Takeaways
- South Asia and Pacific Market Analysis 2021 to 2025 and Forecast 2026 to 2036, By Country
- Historical Market Size Value (USD Million) Trend Analysis By Market Taxonomy, 2021 to 2025
- Market Size Value (USD Million) Forecast By Market Taxonomy, 2026 to 2036
- By Country
- India
- ASEAN
- Australia & New Zealand
- Rest of South Asia and Pacific
- By Service Type
- By Device Class
- By Application
- By Manufacturing Process
- By Customer Type
- By Country
- Market Attractiveness Analysis
- By Country
- By Service Type
- By Device Class
- By Application
- By Manufacturing Process
- By Customer Type
- Key Takeaways
- Middle East & Africa Market Analysis 2021 to 2025 and Forecast 2026 to 2036, By Country
- Historical Market Size Value (USD Million) Trend Analysis By Market Taxonomy, 2021 to 2025
- Market Size Value (USD Million) Forecast By Market Taxonomy, 2026 to 2036
- By Country
- Kingdom of Saudi Arabia
- Other GCC Countries
- Turkiye
- South Africa
- Other African Union
- Rest of Middle East & Africa
- By Service Type
- By Device Class
- By Application
- By Manufacturing Process
- By Customer Type
- By Country
- Market Attractiveness Analysis
- By Country
- By Service Type
- By Device Class
- By Application
- By Manufacturing Process
- By Customer Type
- Key Takeaways
- Key Countries Market Analysis
- USA
- Pricing Analysis
- Market Share Analysis, 2025
- By Service Type
- By Device Class
- By Application
- By Manufacturing Process
- By Customer Type
- Canada
- Pricing Analysis
- Market Share Analysis, 2025
- By Service Type
- By Device Class
- By Application
- By Manufacturing Process
- By Customer Type
- Mexico
- Pricing Analysis
- Market Share Analysis, 2025
- By Service Type
- By Device Class
- By Application
- By Manufacturing Process
- By Customer Type
- Brazil
- Pricing Analysis
- Market Share Analysis, 2025
- By Service Type
- By Device Class
- By Application
- By Manufacturing Process
- By Customer Type
- Chile
- Pricing Analysis
- Market Share Analysis, 2025
- By Service Type
- By Device Class
- By Application
- By Manufacturing Process
- By Customer Type
- Germany
- Pricing Analysis
- Market Share Analysis, 2025
- By Service Type
- By Device Class
- By Application
- By Manufacturing Process
- By Customer Type
- UK
- Pricing Analysis
- Market Share Analysis, 2025
- By Service Type
- By Device Class
- By Application
- By Manufacturing Process
- By Customer Type
- Italy
- Pricing Analysis
- Market Share Analysis, 2025
- By Service Type
- By Device Class
- By Application
- By Manufacturing Process
- By Customer Type
- Spain
- Pricing Analysis
- Market Share Analysis, 2025
- By Service Type
- By Device Class
- By Application
- By Manufacturing Process
- By Customer Type
- France
- Pricing Analysis
- Market Share Analysis, 2025
- By Service Type
- By Device Class
- By Application
- By Manufacturing Process
- By Customer Type
- India
- Pricing Analysis
- Market Share Analysis, 2025
- By Service Type
- By Device Class
- By Application
- By Manufacturing Process
- By Customer Type
- ASEAN
- Pricing Analysis
- Market Share Analysis, 2025
- By Service Type
- By Device Class
- By Application
- By Manufacturing Process
- By Customer Type
- Australia & New Zealand
- Pricing Analysis
- Market Share Analysis, 2025
- By Service Type
- By Device Class
- By Application
- By Manufacturing Process
- By Customer Type
- China
- Pricing Analysis
- Market Share Analysis, 2025
- By Service Type
- By Device Class
- By Application
- By Manufacturing Process
- By Customer Type
- Japan
- Pricing Analysis
- Market Share Analysis, 2025
- By Service Type
- By Device Class
- By Application
- By Manufacturing Process
- By Customer Type
- South Korea
- Pricing Analysis
- Market Share Analysis, 2025
- By Service Type
- By Device Class
- By Application
- By Manufacturing Process
- By Customer Type
- Russia
- Pricing Analysis
- Market Share Analysis, 2025
- By Service Type
- By Device Class
- By Application
- By Manufacturing Process
- By Customer Type
- Poland
- Pricing Analysis
- Market Share Analysis, 2025
- By Service Type
- By Device Class
- By Application
- By Manufacturing Process
- By Customer Type
- Hungary
- Pricing Analysis
- Market Share Analysis, 2025
- By Service Type
- By Device Class
- By Application
- By Manufacturing Process
- By Customer Type
- Kingdom of Saudi Arabia
- Pricing Analysis
- Market Share Analysis, 2025
- By Service Type
- By Device Class
- By Application
- By Manufacturing Process
- By Customer Type
- Turkiye
- Pricing Analysis
- Market Share Analysis, 2025
- By Service Type
- By Device Class
- By Application
- By Manufacturing Process
- By Customer Type
- South Africa
- Pricing Analysis
- Market Share Analysis, 2025
- By Service Type
- By Device Class
- By Application
- By Manufacturing Process
- By Customer Type
- USA
- Market Structure Analysis
- Competition Dashboard
- Competition Benchmarking
- Market Share Analysis of Top Players
- By Regional
- By Service Type
- By Device Class
- By Application
- By Manufacturing Process
- By Customer Type
- Competition Analysis
- Competition Deep Dive
- Jabil
- Overview
- Product Portfolio
- Profitability by Market Segments (Product/Age /Sales Channel/Region)
- Sales Footprint
- Strategy Overview
- Marketing Strategy
- Product Strategy
- Channel Strategy
- Flex
- Integer Holdings
- Sanmina
- TE Connectivity
- Resonetics
- Jabil
- Competition Deep Dive
- Assumptions & Acronyms Used


