The micro-vent cap systems market will rise from USD 1.5 billion in 2025 to USD 2.9 billion by 2035, growing at a CAGR of 6.8%. Growth is powered by advancements in venting materials, regulatory focus on chemical safety, and packaging innovation for volatile and high-viscosity liquids. PTFE and hydrophobic film vents are increasingly integrated into caps for effective airflow and contamination control. Between 2025 and 2030, expanding chemical manufacturing and agrochemical exports will strengthen market demand. Asia-Pacific will lead production growth, supported by industrialization and the integration of smart vented packaging technology.
The micro vent cap systems market is being shaped by rapid expansion in chemical production hubs across Asia Pacific, North America, and Europe. Growth from 2025 to 2035 is supported by advanced venting structures that enable controlled airflow and pressure equalization in volatile-liquid packaging. PTFE and hydrophobic film vents are gaining strong acceptance, especially in countries where chemical output and agrochemical exports continue to rise. China and India are expected to record high installation rates due to their expanding industrial bases and steady movement toward safer material handling. South Korea is set to lead regional CAGR performance at 7.6% due to its strong speciality chemical ecosystem and advanced venting component manufacturing.
Through 2025 to 2030, vent integration in cap systems is projected to increase in Southeast Asia as Indonesia, Vietnam, and Thailand scale agrochemical production and container safety requirements become stricter. North America is likely to prioritize vent accuracy for high viscosity liquids, driven by the United States focus on hazardous material compliance. Europe will emphasize product consistency and performance validation, with Germany, France, and the United Kingdom forming the core engineering base. The market outlook is influenced strongly by cross-regional production shifts, export-driven chemical growth, and national regulations that require safer vented packaging structures.

| Metric | Value |
|---|---|
| Industry Size (2025E) | USD 1.5 billion |
| Industry Value (2035F) | USD 2.9 billion |
| CAGR (2025 to 2035) | 6.8% |
From 2020 to 2024, increasing chemical storage and transport safety requirements accelerated adoption of micro-venting caps. PTFE membranes and hydrophobic filters gained traction due to their ability to maintain pressure equilibrium and prevent contamination. By 2035, the market will reach USD 2.9 billion, supported by chemical, agrochemical, and healthcare packaging industries. Asia-Pacific will lead global demand due to rising exports of liquid chemicals, while Europe and North America emphasize sustainability and regulatory compliance in vented closures.
Market growth is fuelled by stricter packaging safety standards, expanding chemical and agricultural industries, and improved venting technologies for high-performance caps. Increased focus on leakage prevention and pressure equalization in volatile product packaging further accelerates adoption.
The market is segmented by vent technology, cap type, application, end-use industry, and region. Vent technologies include PTFE membrane vents, hydrophobic film vents, pressure-equalizing micro-vents, and self-sealing vents. Cap types cover screw caps, snap-on caps, dispensing caps, and flip-top caps. Applications span chemical containers, agrochemical bottles, food and beverage packaging, and pharmaceutical bottles. End-use industries include chemicals and industrial, agriculture, food and beverages, and pharmaceuticals and healthcare.

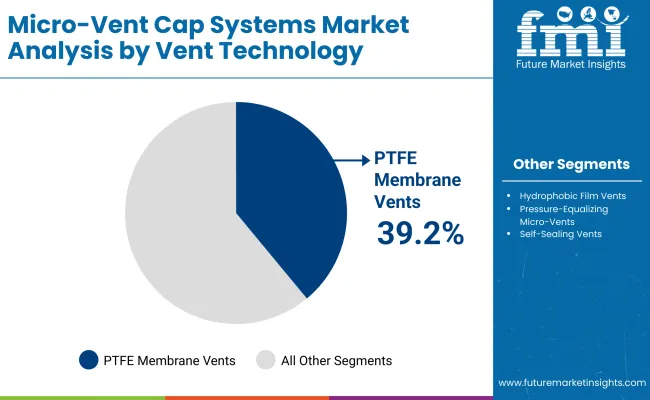
PTFE membrane vents are projected to hold 39.2% of the market in 2025, driven by their superior resistance to chemicals, temperature extremes, and humidity. These vents allow controlled airflow while preventing liquid ingress, ensuring product safety and stability in sensitive packaging applications.
Their use spans chemical, healthcare, and agrochemical containers where venting reliability is essential. The membranes’ micro-porous structure maintains pressure balance without compromising seal integrity. As safety and quality standards tighten, PTFE membranes remain the preferred venting technology for high-performance packaging.

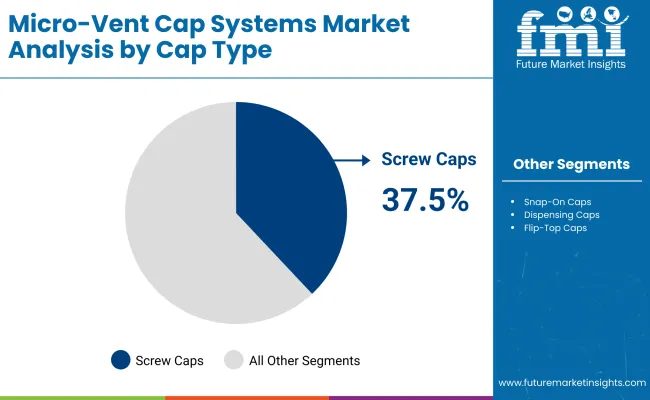
Screw caps are expected to capture 37.5% of the market in 2025, favored for their robust design, easy handling, and adaptability with vented systems. They provide secure sealing and reliable integration with PTFE membranes to maintain consistent venting performance.
These closures are widely adopted in chemical, industrial, and pharmaceutical packaging due to their long service life and compatibility with automation lines. Advances in thread design and liner materials enhance reusability and pressure resistance. As vented closures gain traction, screw caps continue to lead cap design innovation.

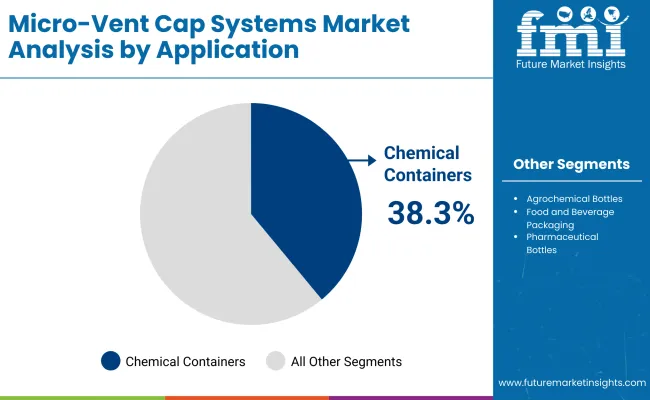
Chemical containers are forecast to account for 38.3% of the market in 2025, supported by regulatory standards emphasizing vented packaging to prevent leaks, swelling, or container rupture. Vented closures enable safe transport and storage of volatile substances, maintaining pressure equilibrium.
Their adoption spans industrial solvents, cleaning agents, and laboratory reagents where gas exchange control is critical. Integration with high-barrier liners improves performance under demanding conditions. As global chemical logistics expand, vented caps for chemical containers remain a cornerstone of compliant packaging design.

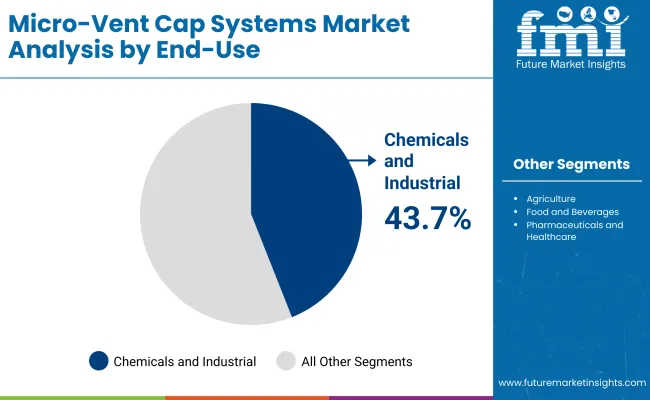
The chemicals and industrial sector is expected to dominate with 43.7% of the market in 2025, driven by growing volumes of reactive, high-pressure, and corrosive materials. Vented caps prevent deformation, leakage, and pressure buildup during transit or storage.
Manufacturers are investing in automated assembly lines for vented closure production to ensure consistency and traceability. The sector’s focus on worker safety and environmental protection continues to accelerate innovation in venting technologies. As industrial regulations strengthen, this end-use category remains the market’s primary growth driver.
The market is driven by the rapid expansion of the global chemical sector and the enforcement of stringent safety packaging mandates. Vented chemical packaging ensures safe storage and transport of volatile or pressure-sensitive materials by preventing leakage, bloating, or bursting. Rising demand from agrochemicals, industrial cleaners, and specialty chemicals sectors is further propelling adoption of advanced venting solutions designed for regulatory compliance and worker safety.
Market growth is hindered by the high cost of advanced venting materials such as PTFE membranes and multi-layer composites. Limited compatibility with recycling processes restricts sustainability performance, as many vented caps and liners use mixed-material structures. Additionally, the need for precise engineering to balance venting efficiency and chemical resistance increases manufacturing complexity and costs. These factors restrain large-scale adoption across cost-sensitive chemical packaging segments.
Integration of nanomaterial-based membranes and smart monitoring caps presents significant opportunities for innovation. Nanotechnology enhances vent permeability and durability while maintaining chemical resistance. Smart caps with embedded sensors can monitor internal pressure, temperature, and vapor emissions, improving safety in storage and logistics. Collaborations between packaging manufacturers and chemical producers are driving the development of next-generation vented systems optimized for hazardous and high-performance formulations.
Lightweight vent integration is becoming a key focus, reducing material use while maintaining functionality. The adoption of sustainable cap materials, including recyclable polymers and bio-based resins, is aligning with global environmental goals. Self-regulating micro-vent technologies are emerging, allowing automated pressure balancing without manual intervention. These advancements are positioning vented chemical packaging as a cornerstone of smart, safe, and sustainable chemical supply chain management.

The global micro-vent cap systems market is expanding steadily as packaging safety, chemical containment, and precision venting requirements intensify across industries. Asia-Pacific leads demand, supported by large-scale manufacturing, growing industrial automation, and expanding agrochemical production. Europe and North America remain leaders in high-spec venting technology and regulatory-driven design, emphasizing advanced filtration materials and compliance with safety standards. Increasing adoption in pharmaceuticals, chemicals, and laboratory packaging is further strengthening the market’s long-term trajectory.

The USA will grow at 6.9% CAGR, propelled by stringent industrial and chemical safety regulations. Rising demand for vented caps in agrochemical and hazardous material packaging is driving investment in advanced PTFE and membrane technologies. Domestic manufacturing expansion strengthens supply chain resilience.
Germany will expand at 6.7% CAGR, backed by strong compliance with EU packaging directives. Cleanroom-grade production of hydrophobic and oleophobic membranes supports widespread use in pharmaceutical and industrial applications. Advanced vent R&D reinforces the country’s leadership in high-performance sealing solutions.
The UK will grow at 6.8% CAGR, supported by pharmaceutical and chemical packaging modernization. PTFE-based and hybrid vent solutions are gaining traction for precision liquid control. Collaboration between packaging manufacturers and chemical exporters accelerates domestic innovation.
China will grow at 6.8% CAGR, driven by rapid industrialization and large-scale production in the chemical sector. Localization of micro-vent cap manufacturing reduces dependency on imports, while strong export demand for vented containers supports continuous capacity expansion.
India will grow at 6.7% CAGR, supported by the expansion of agrochemical, industrial, and pharmaceutical packaging sectors. Rising awareness of product safety and regulatory compliance fuels investment in domestic membrane R&D for vented closures.
Japan will grow at 7.5% CAGR, leading in micro-engineered venting technologies. Innovations in precision airflow design and self-regulating vent systems cater to high-value medical, biotech, and lab applications. Integration of smart monitoring systems enhances safety and efficiency.
South Korea will lead with 7.6% CAGR, combining strong R&D in nano-structured vent membranes with rapid industrial and chemical export expansion. Focus on recyclability and automated venting closures reinforces its role as a technology hub in the region.

Japan’s micro-vent cap systems market, valued at USD 200.0 million in 2025, is led by PTFE membrane vents with a 38.7% share, favoured for superior gas permeability and contamination control. Hydrophobic film vents support moisture resistance in chemical packaging, while pressure-equalizing micro-vents and self-sealing vents enhance durability across liquid applications.

South Korea’s micro-vent cap systems market, worth USD 100.0 million in 2025, is dominated by screw caps, holding 38.4% share due to their strong sealing and compatibility with industrial containers. Snap-on caps gain traction in fast-fill lines, while dispensing and flip-top caps are preferred for consumer and personal care packaging.

The market is moderately consolidated, featuring Microvent Tech Co., PorVent®, Porex Corporation, GORE®, IPRO Membrane Technologies, Oxyphen Ltd., Actovis Venting, Tri-Sure®, Seal & Design, and Donaldson Company. Companies are focusing on expanding PTFE vent capabilities, integrating IoT-based airflow monitoring, and developing recyclable composite caps.
| Item | Value |
|---|---|
| Quantitative Units | USD 1.5 Billion (2025) |
| By Vent Technology | PTFE Membrane, Hydrophobic Film, Pressure-Equalizing, Self-Sealing |
| By Cap Type | Screw, Snap-On, Dispensing, Flip-Top |
| By Application | Chemical Containers, Agrochemical, Food & Beverage, Pharmaceutical |
| By End-Use Industry | Chemicals & Industrial, Agriculture, Food & Beverage, Pharmaceuticals |
| Key Companies Profiled | Microvent Tech Co., PorVent ®, Porex Corporation, GORE®, IPRO Membrane Technologies, Oxyphen Ltd., Actovis Venting, Tri-Sure®, Seal & Design, and Donaldson Company |
| Additional Attributes | Market driven by safety mandates, chemical handling, and smart vent integration |
The market is valued at USD 1.5 billion in 2025, supported by growing chemical safety packaging demand.
It is expected to reach USD 2.9 billion by 2035, driven by industrial expansion and venting innovations.
The market will grow at a CAGR of 6.8% over the forecast period.
The Chemicals and Industrial sector dominate with a 43.7% share, reflecting stringent packaging safety needs.
Leading players include Microvent Tech, PorVent®, Porex, GORE®, IPRO Membrane Technologies, and Donaldson Company, specializing in advanced venting technologies.


Our Research Products

The "Full Research Suite" delivers actionable market intel, deep dives on markets or technologies, so clients act faster, cut risk, and unlock growth.

The Leaderboard benchmarks and ranks top vendors, classifying them as Established Leaders, Leading Challengers, or Disruptors & Challengers.

Locates where complements amplify value and substitutes erode it, forecasting net impact by horizon

We deliver granular, decision-grade intel: market sizing, 5-year forecasts, pricing, adoption, usage, revenue, and operational KPIs—plus competitor tracking, regulation, and value chains—across 60 countries broadly.

Spot the shifts before they hit your P&L. We track inflection points, adoption curves, pricing moves, and ecosystem plays to show where demand is heading, why it is changing, and what to do next across high-growth markets and disruptive tech

Real-time reads of user behavior. We track shifting priorities, perceptions of today’s and next-gen services, and provider experience, then pace how fast tech moves from trial to adoption, blending buyer, consumer, and channel inputs with social signals (#WhySwitch, #UX).

Partner with our analyst team to build a custom report designed around your business priorities. From analysing market trends to assessing competitors or crafting bespoke datasets, we tailor insights to your needs.
Supplier Intelligence
Discovery & Profiling
Capacity & Footprint
Performance & Risk
Compliance & Governance
Commercial Readiness
Who Supplies Whom
Scorecards & Shortlists
Playbooks & Docs
Category Intelligence
Definition & Scope
Demand & Use Cases
Cost Drivers
Market Structure
Supply Chain Map
Trade & Policy
Operating Norms
Deliverables
Buyer Intelligence
Account Basics
Spend & Scope
Procurement Model
Vendor Requirements
Terms & Policies
Entry Strategy
Pain Points & Triggers
Outputs
Pricing Analysis
Benchmarks
Trends
Should-Cost
Indexation
Landed Cost
Commercial Terms
Deliverables
Brand Analysis
Positioning & Value Prop
Share & Presence
Customer Evidence
Go-to-Market
Digital & Reputation
Compliance & Trust
KPIs & Gaps
Outputs
Full Research Suite comprises of:
Market outlook & trends analysis
Interviews & case studies
Strategic recommendations
Vendor profiles & capabilities analysis
5-year forecasts
8 regions and 60+ country-level data splits
Market segment data splits
12 months of continuous data updates
DELIVERED AS:
PDF EXCEL ONLINE
Capacitor Bushing Market Size and Share Forecast Outlook 2025 to 2035
Caprolactam Market Size and Share Forecast Outlook 2025 to 2035
Capacitor Film Slitter Market Size and Share Forecast Outlook 2025 to 2035
Cap Liner Market Size and Share Forecast Outlook 2025 to 2035
Capsule Vision Inspection Solution Market Size and Share Forecast Outlook 2025 to 2035
Capsule Filling Machines Market Size and Share Forecast Outlook 2025 to 2035
Capacitance Meter Market Size and Share Forecast Outlook 2025 to 2035
Capsule Hotels Market Size and Share Forecast Outlook 2025 to 2035
Capacitive Tactile Sensor Market Size and Share Forecast Outlook 2025 to 2035
Capryloyl Glycine Market Size and Share Forecast Outlook 2025 to 2035
Captive Chemical Hydrogen Generation Market Size and Share Forecast Outlook 2025 to 2035
Capacitive Position Sensors Market Size and Share Forecast Outlook 2025 to 2035
Capacitive Sensor Market Analysis - Size, Share, and Forecast 2025 to 2035
Caprylic Capric Triglyceride Market Size and Share Forecast Outlook 2025 to 2035
Captive Petroleum Refinery Hydrogen Generation Market Size and Share Forecast Outlook 2025 to 2035
Cap and Closure Market Trends - Growth & Demand 2025-2035
Capnography Equipment Market Size and Share Forecast Outlook 2025 to 2035
Capillary Electrophoresis Market Size, Growth, and Forecast 2025 to 2035
Capsule Endoscope and Workstations Market - Growth & Demand 2025 to 2035
Capacitive Proximity Sensor Market Trends - Growth & Forecast 2025 to 2035

Thank you!
You will receive an email from our Business Development Manager. Please be sure to check your SPAM/JUNK folder too.
Chat With
MaRIA