Methodology

Milk Froth Thermometer Market Forecast and Outlook (2025–2035)

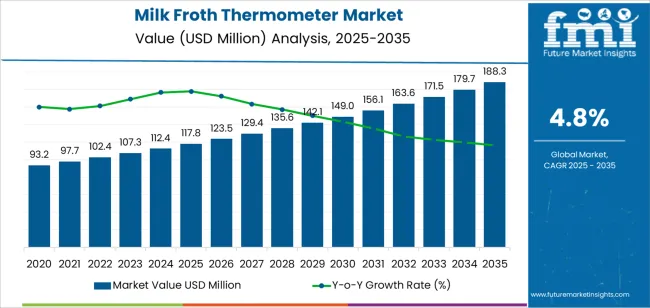
The global milk froth thermometer market is valued at USD 117.8 million in 2025 and is projected to reach USD 188.3 million by 2035, advancing at a CAGR of 4.8%. The market will generate an absolute dollar opportunity of USD 70.5 million during the forecast period. Based on decade-long performance consistency, the Growth Rate Volatility Index (GRVI) is assessed at 0.19, suggesting a low-volatility, steady-growth profile supported by expanding café culture, professional barista training programs, and rising consumer adoption of specialty coffee equipment.

Manufacturers are focusing on thermometers with enhanced precision, faster response times, and durable materials such as stainless steel and reinforced glass. Integration of clip-on and digital display features is becoming more common, improving usability in both commercial and household settings. Product development also emphasizes temperature accuracy within the optimal milk frothing range (55–65°C), which remains critical for consistent texture and taste in espresso-based beverages.

Europe and North America continue to lead in market consumption, driven by established coffee service industries and strong consumer preference for manual brewing accessories. Asia Pacific exhibits increasing adoption as café chains and artisanal beverage outlets expand regionally. Through 2035, innovation in sensor calibration, ergonomic design, and supply chain efficiency will sustain the market’s balanced, low-volatility growth trajectory.
Quick Stats for the Milk Froth Thermometer Market

  • Milk Froth Thermometer Market Value (2025): USD 117.8 million
  • Milk Froth Thermometer Market Forecast Value (2035): USD 188.3 million
  • Milk Froth Thermometer Market Forecast CAGR (2025-2035): 4.8%
  • Leading Type in Milk Froth Thermometer Market: Pointer Type
  • Leading Application in Milk Froth Thermometer Market: Personal Use
  • Key Growth Regions: Europe, North America, and Asia Pacific
  • Top Players: Beans, Taylor, CDN, Etekcity, Comark Instruments, BonJour, OXO, Brewista, Rattleware

Milk Froth Thermometer Market Market Value Analysis

What is the Growth Forecast for the Milk Froth Thermometer Market through 2035?

Between 2025 and 2030, the milk froth thermometer market is projected to grow from USD 117.8 million to USD 149.0 million, representing an acceleration phase with a 26.5% increase during the first five years. This growth will be driven by rising global coffee consumption, the expansion of café culture, and the increasing focus on beverage quality consistency across both commercial and household segments. The adoption of digital and smart thermometers with faster response times and higher precision will further propel demand. Manufacturers are emphasizing user-friendly, durable, and food-grade materials to meet stringent safety and accuracy standards in the hospitality and food service industries.

From 2030 to 2035, the market is forecast to rise from USD 149.0 million to USD 188.3 million, marking a deceleration phase with a 26.3% increase as market growth stabilizes. During this phase, product adoption will reach maturity across developed economies, while incremental growth will stem from emerging café markets and small-scale food service operators. Innovation will center on smart connectivity, temperature calibration technologies, and energy-efficient sensor systems. Competitive differentiation will increasingly rely on design aesthetics, integration with automated frothing systems, and sustainability-driven product materials such as stainless steel and recyclable components.

Milk Froth Thermometer Market Key Takeaways

Metric Value
Market Value (2025) USD 117.8 million
Market Forecast Value (2035) USD 188.3 million
Forecast CAGR (2025-2035) 4.8%

What Factors Are Supporting the Growth of the Milk Froth Thermometer Market in the Global Beverage Industry?

The milk froth thermometer market is growing as cafés, restaurants, and home baristas emphasize precise temperature control for consistent milk texturing in espresso-based beverages. These thermometers, typically analog or digital, ensure milk is heated within the optimal range between 55°C and 65°C to achieve stable foam density and prevent flavor degradation. Manufacturers design thermometers with fast-response probes, anti-fog dials, and clip-on attachments to enhance usability during high-volume service. The popularity of specialty coffee culture and professional brewing techniques drives steady adoption across both commercial and domestic environments, reinforcing product demand within the global beverage equipment ecosystem.

Growth is further supported by the expanding café franchise network and increasing consumer interest in at-home coffee preparation. Compact, stainless-steel models dominate due to their durability and ease of cleaning, while emerging digital variants incorporate auto-alerts and calibration features for improved accuracy. The integration of temperature-monitoring accessories within automated frothing systems represents an emerging trend among premium appliance manufacturers. Despite market maturity in developed regions, rising disposable income and café expansion in Asia-Pacific sustain sales momentum. Competitive differentiation relies on precision, build quality, and ergonomic design. Continuous innovation in sensor responsiveness and user-friendly calibration ensures long-term stability for the milk froth thermometer market.

How Do Product Technologies and Usage Patterns Shape Segmentation in the Milk Froth Thermometer Market?

The milk froth thermometer market is segmented by classification, application, and region. By classification, the market is divided into pointer type and digital type thermometers. Based on application, it is categorized into personal and commercial use. Regionally, the market is segmented into North America, Europe, East Asia, South Asia, Latin America, and the Middle East & Africa. These segments capture variations in measurement technology, usage context, and regional adoption trends within both domestic and professional beverage preparation settings.
What Explains the Leading Position of Pointer-Type Thermometers in the Market?

Milk Froth Thermometer Market Analysis By Classification

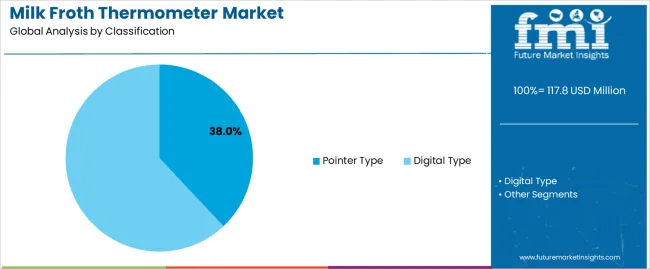
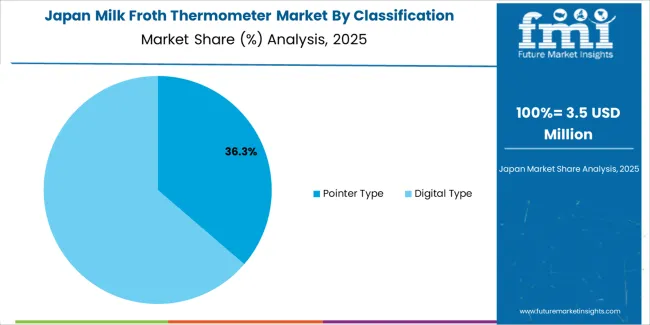
The pointer type segment accounts for approximately 38.0% of the global milk froth thermometer market in 2025, representing the leading classification category. Its position is supported by continued consumer preference for analog thermometers in household and small café applications, where simplicity and cost-effectiveness remain key purchasing factors. Pointer-type devices provide immediate temperature feedback and require no batteries or digital calibration, ensuring reliability and longevity in daily use.

The segment’s prominence is also attributed to its accuracy within the optimal frothing range of 55°C to 70°C, which is essential for maintaining milk texture and taste quality. Manufacturers focus on corrosion-resistant stainless-steel probes, improved dial visibility, and adjustable clips for ease of attachment to frothing pitchers. While digital thermometers offer enhanced precision and automatic alerts, the tactile and straightforward operation of analog models continues to appeal to home users and small-scale establishments. Demand is strongest in Europe and North America, where traditional barista techniques and manual espresso equipment maintain popularity. The pointer type segment remains the preferred choice for consumers seeking dependable, maintenance-free instruments aligned with everyday beverage preparation routines.
Which End-use Category Generates the Greatest Demand for Milk Froth Thermometers?

Milk Froth Thermometer Market Analysis By Application

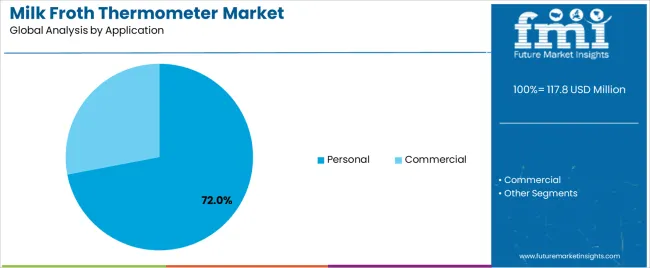
The personal use segment represents about 72.0% of the total milk froth thermometer market in 2025, making it the dominant application category. This leadership reflects increasing home consumption of specialty coffee and other milk-based beverages, which has encouraged consumers to adopt café-style tools for personal use. Milk froth thermometers enable precise control of frothing temperature, improving drink consistency and preventing overheating or texture loss.

The segment benefits from widespread adoption of home espresso machines and milk frothers, particularly in North America and East Asia, where premium coffee preparation at home continues to expand. Personal users favor thermometers that are compact, affordable, and easy to clean. Manufacturers have responded with ergonomic designs, integrated clips, and high-contrast dials suitable for domestic kitchens. Online retail platforms have also contributed to distribution growth by offering broad product accessibility and comparative pricing transparency. Although commercial applications are increasing in boutique cafés, household demand remains the core driver of overall market growth. The personal use segment’s strong market share demonstrates its alignment with lifestyle shifts toward home-based beverage customization and growing consumer familiarity with barista-style equipment in the global household appliance market.

What are the Key Trends, Drivers, and Restraints in the Milk Froth Thermometer Market?

The milk froth thermometer market is gaining momentum as specialty coffee culture spreads and both home baristas and commercial cafés seek precise tools for frothing milk and steam-texturing. Demand is driven by the rising popularity of craft drinks like lattes and cappuccinos, increasing installation of espresso machines and growing consumer willingness to invest in premium brewing accessories. Adoption is constrained by competition from integrated machine sensors, price sensitivity among casual users and the narrow application scope confined largely to coffee and milk-based beverages. Manufacturers are responding with digital models, smart connectivity and ergonomic designs to capture both home and professional segments.

What factors are driving demand for milk froth thermometers in coffee preparation?

The demand surge for milk frothing thermometers stems from the desire to match café-style texture and flavour at home or in commercial settings. As consumers adopt high-end espresso machines and coffee preparation becomes a visible part of the lifestyle, the need for accurate temperature control grows. For retail chain buyers or kitchen-equipment suppliers, a USP lies in "digital milk-frothing thermometers featuring rapid-response probes and preset temperature alerts with clip-on mounting for café jugs," which can enhance consistency, reduce over-scalding and support high-volume service. This positions thermometers as essential accessories rather than optional tools.

What restraints are limiting market expansion for milk froth thermometers?

While the market shows promise, key restraints persist. Many entry-level home users may rely on integrated machine sensors or traditional manual frothing methods, reducing demand for standalone thermometers. Price sensitivity particularly among casual users limits uptake of high-precision digital models. In commercial kitchens, integration and cleaning demands add operational complexity. For thermometer suppliers, a relevant USP to address this is "cost-effective analog models with durable stainless-steel probe and jug-clip, offering acceptable accuracy for small cafés and budget-sensitive users," which helps lower the barrier to adoption in cost-conscious segments.

What key trends are shaping the future development of milk froth thermometer products?

Major trends include the shift toward digital connectivity, multifunctionality and sustainable design. Manufacturers are introducing Bluetooth-enabled thermometers that sync with recipe apps, track frothing data and provide remote alerts. Compact, sleek probe designs and eco-friendly materials are becoming more common as home barista culture matures. For equipment specifiers, a strong USP is "smart milk-frothing thermometer platform with app integration, data logging and recipe library for training staff and maintaining consistency across café outlets." These innovations support both residential and professional market growth while aligning with digital kitchen trends.
What is the Analysis of the Milk Froth Thermometer Market by Key Country?

Milk Froth Thermometer Market Cagr Analysis By Country

Country CAGR (%)
China 6.5%
India 6.0%
Germany 5.5%
Brazil 5.0%
USA 4.6%
UK 4.1%
Japan 3.6%

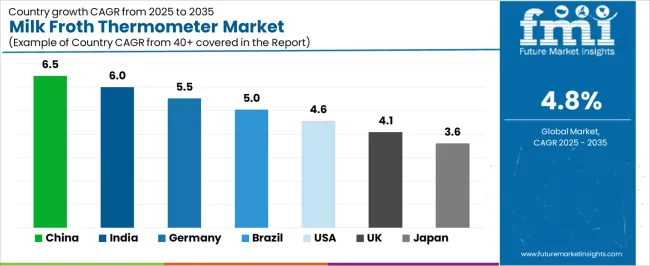
The milk froth thermometer market is expanding steadily across global regions, with China leading at a 6.5% CAGR through 2035, supported by the rapid growth of the café culture, commercial kitchen expansion, and increased production of coffee accessories. India follows at 6.0%, driven by rising café chains, home brewing adoption, and demand for affordable barista tools. Germany records 5.5%, leveraging precision manufacturing, material quality, and integration of digital thermometry in café equipment. Brazil grows at 5.0%, reflecting increasing coffee consumption and café franchise development. The USA, with a 4.6% CAGR, remains a mature market emphasizing innovation and professional-grade instruments, while the UK (4.1%) and Japan (3.6%) focus on premium kitchenware trends, ergonomic design, and expanding coffee culture in domestic markets.

How Is Café Culture Expansion Driving Market Growth in China?

China is observing strong expansion in the milk froth thermometer market, projected to grow at a CAGR of 6.5% through 2035. The rapid increase in café chains, specialty coffee shops, and domestic espresso machine usage is driving demand for precision thermometers. Local manufacturers are improving accuracy, temperature range, and build quality to serve both commercial and household markets. Rising consumer focus on beverage preparation standards supports steady product adoption. Export activity from Chinese suppliers is also expanding, enhancing global market reach.

  • Growth in coffee culture sustains consistent product demand.
  • Domestic innovation improves measurement precision and reliability.
  • Expanding café networks boost commercial equipment consumption.
  • Export expansion strengthens China’s global supply position.

Why Is Café Equipment Localization Strengthening Market Potential in India?

India is witnessing consistent growth in the milk froth thermometer market, increasing at a CAGR of 6.0%, driven by rising café culture and urban coffee consumption. Local production of café tools and barista equipment is expanding through small-scale manufacturing clusters. The increasing number of specialty beverage outlets and hotel coffee services supports product diversification. Digital thermometers and durable stainless-steel designs are gaining traction across urban retail networks, aligning with the country’s expanding hospitality sector.
  • Expanding café and hotel networks support domestic product demand.
  • Local production clusters strengthen equipment accessibility.
  • Consumer preference for accuracy promotes digital product use.
  • Growth in hospitality and retail sustains steady market expansion.

How Does Manufacturing Precision Sustain Market Competitiveness in Germany?

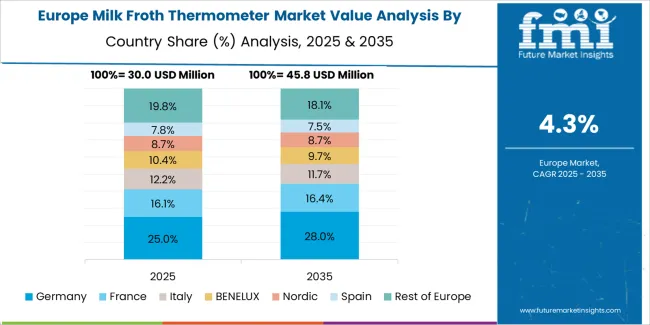
Milk Froth Thermometer Market Europe Country Market Share Analysis, 2025 & 2035

Across Germany, the milk froth thermometer market is advancing at a CAGR of 5.5%, supported by precision manufacturing and strong café industry standards. Producers emphasize stainless steel quality, fast temperature response, and calibration stability to meet barista-grade performance requirements. Integration of thermometers into espresso and frothing systems improves operational consistency across professional coffee machines. Rising popularity of artisanal coffee and home brewing continues to sustain steady demand for high-accuracy instruments.

  • Engineering precision ensures product longevity and accuracy.
  • Integration with espresso systems enhances user convenience.
  • Artisanal coffee culture supports professional-grade demand.
  • Quality manufacturing sustains export opportunities across Europe.

Why Is Beverage Industry Modernization Encouraging Market Growth in Brazil?

Brazil is recording steady development in the milk froth thermometer market, projected to grow at a CAGR of 5.0% through 2035. Expansion in coffee retail and dairy-based beverage production supports increasing demand for temperature-control tools. Local suppliers are improving product materials, including corrosion-resistant steel and high-visibility dial displays. Growth in coffee festivals and training programs for baristas is encouraging consistent product utilization across commercial establishments.
  • Coffee retail growth drives steady equipment consumption.
  • Material innovation enhances durability and usability.
  • Barista training initiatives increase product adoption.
  • Local supplier expansion improves market availability.

How Do Product Innovations Support Market Expansion in the United States?

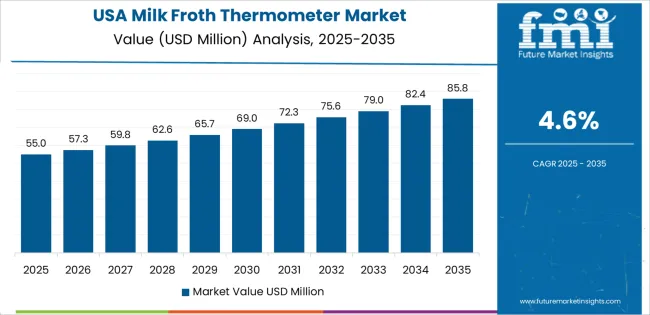
Milk Froth Thermometer Market Country Value Analysis

In the United States, the milk froth thermometer market is growing at a CAGR of 4.6%, supported by innovation in temperature sensing technologies and expanding specialty coffee markets. Manufacturers are introducing dual-scale thermometers with rapid response and anti-fog displays for professional and home users. Increasing penetration of coffee chains and craft cafés sustains equipment demand. Growth in smart home appliances integrating thermal monitoring functions is also contributing to evolving product applications.

  • Smart appliance integration promotes advanced thermometer usage.
  • Dual-scale and rapid-response features enhance functionality.
  • Specialty café expansion sustains consistent market utilization.
  • Professional-grade product design drives long-term consumer trust.

Why Is Specialty Coffee Adoption Sustaining Market Activity in the United Kingdom?

Across the United Kingdom, the milk froth thermometer market is advancing at a CAGR of 4.1%, supported by widespread adoption of specialty coffee and increased barista training programs. Professional coffee equipment distributors are expanding product lines with precision thermometers catering to independent cafés. Sustainability trends are driving the use of recyclable materials in manufacturing. The country’s strong café culture and competitive retail environment continue to support regular equipment upgrades.
  • Specialty café expansion promotes professional-grade equipment use.
  • Training programs enhance adoption of precision tools.
  • Sustainable materials align with eco-conscious consumer values.
  • Competitive retail sector supports steady replacement demand.

How Does Technological Refinement Maintain Market Stability in Japan?

Milk Froth Thermometer Market Japan Market Share Analysis By Classification

Japan is showing steady advancement in the milk froth thermometer market, forecast to grow at a CAGR of 3.6% through 2035. Domestic manufacturers emphasize compact design, thermal accuracy, and consistent calibration for high-performance applications in cafés and restaurants. Integration with automatic milk frothing systems is improving product compatibility. The country’s emphasis on craftsmanship and precision manufacturing ensures stable product demand across both professional and home users seeking quality assurance.
  • Compact and precise designs enhance product usability.
  • Integration with automated systems supports compatibility.
  • High craftsmanship standards sustain steady consumption.
  • Consistent calibration ensures reliability and performance stability.

How Competitive Is the Global Milk Froth Thermometer Market and What Defines Its Strategic Landscape?

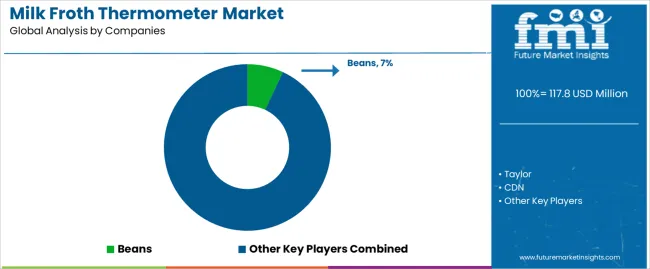
Milk Froth Thermometer Market Analysis By Company

The global milk froth thermometer market is moderately fragmented, featuring established kitchenware brands and niche coffee equipment specialists. Beans leads the market through barista-grade thermometers designed for consistent frothing accuracy and fast temperature response. Taylor and CDN follow with strong distribution networks and product portfolios emphasizing reliability, ease of calibration, and durable stainless-steel construction.

Etekcity and Comark Instruments extend competitiveness through digital and infrared thermometer variants suited for both home and professional applications. BonJour and OXO focus on ergonomically designed thermometers integrated into premium coffee tool sets targeting home brewing enthusiasts. Brewista and Rattleware contribute to the professional segment by supplying precision instruments compatible with commercial espresso equipment and café environments.

Competition across this market is influenced by measurement precision, build quality, and ease of maintenance. Manufacturers differentiate through digital display integration, waterproof construction, and food-safe materials ensuring long-term durability. Price segmentation reflects the growing divide between mass-market kitchen tools and barista-grade specialty instruments. Strategic differentiation depends on response speed, calibration consistency, and adaptability across frothing vessels. As specialty coffee consumption expands globally, demand for precision thermometers supporting consistent milk texturing continues to rise. Long-term competitiveness will hinge on material sustainability, digital connectivity innovations, and temperature accuracy optimization aligned with evolving café workflow and home brewing preferences.

Key Players in the Milk Froth Thermometer Market

  • Beans
  • Taylor
  • CDN
  • Etekcity
  • Comark Instruments
  • BonJour
  • OXO
  • Brewista
  • Rattleware

Report Scope in the Milk Froth Thermometer Market

Items Values
Quantitative Units (2025) USD million
Type (Classification) Pointer Type, Digital Type
Application Personal, Commercial
Regions Covered North America, Europe, East Asia, South Asia, Latin America, Middle East & Africa, Eastern Europe
Countries Covered China, India, USA, Germany, Brazil, UK, Japan, and 40+ countries
Key Companies Profiled Beans, Taylor, CDN, Etekcity, Comark Instruments, BonJour, OXO, Brewista, Rattleware
Additional Attributes Dollar sales by classification and application segments; regional adoption trends in home and café markets; competitive landscape featuring analog and digital thermometer manufacturers.

Milk Froth Thermometer Market Segmentations

Classification:

  • Pointer Type
  • Digital Type

Application:

  • Personal
  • Commercial

Region:

  • East Asia
    • China
    • Japan
    • South Korea
    • Taiwan
    • Rest of East Asia
  • Europe
    • Germany
    • UK
    • France
    • Italy
    • Spain
    • Switzerland
    • Nordic
    • BENELUX
    • Rest of Europe
  • North America
    • USA
    • Canada
    • Mexico
  • South Asia
    • India
    • Pakistan
    • Bangladesh
    • Rest of South Asia
  • Latin America
    • Brazil
    • Argentina
    • Chile
    • Rest of Latin America
  • Middle East & Africa
    • Kingdom of Saudi Arabia
    • Other GCC Countries
    • Turkey
    • South Africa
    • Other African Union
    • Rest of Middle East & Africa
  • Eastern Europe
    • Russia
    • Poland
    • Czech Republic

Rest of Eastern Europe

Frequently Asked Questions

How big is the milk froth thermometer market in 2025?

The global milk froth thermometer market is estimated to be valued at USD 117.8 million in 2025.

What will be the size of milk froth thermometer market in 2035?

The market size for the milk froth thermometer market is projected to reach USD 188.3 million by 2035.

How much will be the milk froth thermometer market growth between 2025 and 2035?

The milk froth thermometer market is expected to grow at a 4.8% CAGR between 2025 and 2035.

What are the key product types in the milk froth thermometer market?

The key product types in milk froth thermometer market are pointer type and digital type.

Which application segment to contribute significant share in the milk froth thermometer market in 2025?

In terms of application, personal segment to command 72.0% share in the milk froth thermometer market in 2025.

Table of Content

  1. Executive Summary
    • Global Market Outlook
    • Demand to side Trends
    • Supply to side Trends
    • Technology Roadmap Analysis
    • Analysis and Recommendations
  2. Market Overview
    • Market Coverage / Taxonomy
    • Market Definition / Scope / Limitations
  3. Market Background
    • Market Dynamics
      • Drivers
      • Restraints
      • Opportunity
      • Trends
    • Scenario Forecast
      • Demand in Optimistic Scenario
      • Demand in Likely Scenario
      • Demand in Conservative Scenario
    • Opportunity Map Analysis
    • Product Life Cycle Analysis
    • Supply Chain Analysis
    • Investment Feasibility Matrix
    • Value Chain Analysis
    • PESTLE and Porter’s Analysis
    • Regulatory Landscape
    • Regional Parent Market Outlook
    • Production and Consumption Statistics
    • Import and Export Statistics
  4. Global Market Analysis 2020 to 2024 and Forecast, 2025 to 2035
    • Historical Market Size Value (USD Million) Analysis, 2020 to 2024
    • Current and Future Market Size Value (USD Million) Projections, 2025 to 2035
      • Y to o to Y Growth Trend Analysis
      • Absolute $ Opportunity Analysis
  5. Global Market Pricing Analysis 2020 to 2024 and Forecast 2025 to 2035
  6. Global Market Analysis 2020 to 2024 and Forecast 2025 to 2035, By Classification
    • Introduction / Key Findings
    • Historical Market Size Value (USD Million) Analysis By Classification , 2020 to 2024
    • Current and Future Market Size Value (USD Million) Analysis and Forecast By Classification , 2025 to 2035
      • Pointer Type
      • Digital Type
    • Y to o to Y Growth Trend Analysis By Classification , 2020 to 2024
    • Absolute $ Opportunity Analysis By Classification , 2025 to 2035
  7. Global Market Analysis 2020 to 2024 and Forecast 2025 to 2035, By Application
    • Introduction / Key Findings
    • Historical Market Size Value (USD Million) Analysis By Application, 2020 to 2024
    • Current and Future Market Size Value (USD Million) Analysis and Forecast By Application, 2025 to 2035
      • Personal
      • Commercial
    • Y to o to Y Growth Trend Analysis By Application, 2020 to 2024
    • Absolute $ Opportunity Analysis By Application, 2025 to 2035
  8. Global Market Analysis 2020 to 2024 and Forecast 2025 to 2035, By Region
    • Introduction
    • Historical Market Size Value (USD Million) Analysis By Region, 2020 to 2024
    • Current Market Size Value (USD Million) Analysis and Forecast By Region, 2025 to 2035
      • North America
      • Latin America
      • Western Europe
      • Eastern Europe
      • East Asia
      • South Asia and Pacific
      • Middle East & Africa
    • Market Attractiveness Analysis By Region
  9. North America Market Analysis 2020 to 2024 and Forecast 2025 to 2035, By Country
    • Historical Market Size Value (USD Million) Trend Analysis By Market Taxonomy, 2020 to 2024
    • Market Size Value (USD Million) Forecast By Market Taxonomy, 2025 to 2035
      • By Country
        • USA
        • Canada
        • Mexico
      • By Classification
      • By Application
    • Market Attractiveness Analysis
      • By Country
      • By Classification
      • By Application
    • Key Takeaways
  10. Latin America Market Analysis 2020 to 2024 and Forecast 2025 to 2035, By Country
    • Historical Market Size Value (USD Million) Trend Analysis By Market Taxonomy, 2020 to 2024
    • Market Size Value (USD Million) Forecast By Market Taxonomy, 2025 to 2035
      • By Country
        • Brazil
        • Chile
        • Rest of Latin America
      • By Classification
      • By Application
    • Market Attractiveness Analysis
      • By Country
      • By Classification
      • By Application
    • Key Takeaways
  11. Western Europe Market Analysis 2020 to 2024 and Forecast 2025 to 2035, By Country
    • Historical Market Size Value (USD Million) Trend Analysis By Market Taxonomy, 2020 to 2024
    • Market Size Value (USD Million) Forecast By Market Taxonomy, 2025 to 2035
      • By Country
        • Germany
        • UK
        • Italy
        • Spain
        • France
        • Nordic
        • BENELUX
        • Rest of Western Europe
      • By Classification
      • By Application
    • Market Attractiveness Analysis
      • By Country
      • By Classification
      • By Application
    • Key Takeaways
  12. Eastern Europe Market Analysis 2020 to 2024 and Forecast 2025 to 2035, By Country
    • Historical Market Size Value (USD Million) Trend Analysis By Market Taxonomy, 2020 to 2024
    • Market Size Value (USD Million) Forecast By Market Taxonomy, 2025 to 2035
      • By Country
        • Russia
        • Poland
        • Hungary
        • Balkan & Baltic
        • Rest of Eastern Europe
      • By Classification
      • By Application
    • Market Attractiveness Analysis
      • By Country
      • By Classification
      • By Application
    • Key Takeaways
  13. East Asia Market Analysis 2020 to 2024 and Forecast 2025 to 2035, By Country
    • Historical Market Size Value (USD Million) Trend Analysis By Market Taxonomy, 2020 to 2024
    • Market Size Value (USD Million) Forecast By Market Taxonomy, 2025 to 2035
      • By Country
        • China
        • Japan
        • South Korea
      • By Classification
      • By Application
    • Market Attractiveness Analysis
      • By Country
      • By Classification
      • By Application
    • Key Takeaways
  14. South Asia and Pacific Market Analysis 2020 to 2024 and Forecast 2025 to 2035, By Country
    • Historical Market Size Value (USD Million) Trend Analysis By Market Taxonomy, 2020 to 2024
    • Market Size Value (USD Million) Forecast By Market Taxonomy, 2025 to 2035
      • By Country
        • India
        • ASEAN
        • Australia & New Zealand
        • Rest of South Asia and Pacific
      • By Classification
      • By Application
    • Market Attractiveness Analysis
      • By Country
      • By Classification
      • By Application
    • Key Takeaways
  15. Middle East & Africa Market Analysis 2020 to 2024 and Forecast 2025 to 2035, By Country
    • Historical Market Size Value (USD Million) Trend Analysis By Market Taxonomy, 2020 to 2024
    • Market Size Value (USD Million) Forecast By Market Taxonomy, 2025 to 2035
      • By Country
        • Kingdom of Saudi Arabia
        • Other GCC Countries
        • Turkiye
        • South Africa
        • Other African Union
        • Rest of Middle East & Africa
      • By Classification
      • By Application
    • Market Attractiveness Analysis
      • By Country
      • By Classification
      • By Application
    • Key Takeaways
  16. Key Countries Market Analysis
    • USA
      • Pricing Analysis
      • Market Share Analysis, 2024
        • By Classification
        • By Application
    • Canada
      • Pricing Analysis
      • Market Share Analysis, 2024
        • By Classification
        • By Application
    • Mexico
      • Pricing Analysis
      • Market Share Analysis, 2024
        • By Classification
        • By Application
    • Brazil
      • Pricing Analysis
      • Market Share Analysis, 2024
        • By Classification
        • By Application
    • Chile
      • Pricing Analysis
      • Market Share Analysis, 2024
        • By Classification
        • By Application
    • Germany
      • Pricing Analysis
      • Market Share Analysis, 2024
        • By Classification
        • By Application
    • UK
      • Pricing Analysis
      • Market Share Analysis, 2024
        • By Classification
        • By Application
    • Italy
      • Pricing Analysis
      • Market Share Analysis, 2024
        • By Classification
        • By Application
    • Spain
      • Pricing Analysis
      • Market Share Analysis, 2024
        • By Classification
        • By Application
    • France
      • Pricing Analysis
      • Market Share Analysis, 2024
        • By Classification
        • By Application
    • India
      • Pricing Analysis
      • Market Share Analysis, 2024
        • By Classification
        • By Application
    • ASEAN
      • Pricing Analysis
      • Market Share Analysis, 2024
        • By Classification
        • By Application
    • Australia & New Zealand
      • Pricing Analysis
      • Market Share Analysis, 2024
        • By Classification
        • By Application
    • China
      • Pricing Analysis
      • Market Share Analysis, 2024
        • By Classification
        • By Application
    • Japan
      • Pricing Analysis
      • Market Share Analysis, 2024
        • By Classification
        • By Application
    • South Korea
      • Pricing Analysis
      • Market Share Analysis, 2024
        • By Classification
        • By Application
    • Russia
      • Pricing Analysis
      • Market Share Analysis, 2024
        • By Classification
        • By Application
    • Poland
      • Pricing Analysis
      • Market Share Analysis, 2024
        • By Classification
        • By Application
    • Hungary
      • Pricing Analysis
      • Market Share Analysis, 2024
        • By Classification
        • By Application
    • Kingdom of Saudi Arabia
      • Pricing Analysis
      • Market Share Analysis, 2024
        • By Classification
        • By Application
    • Turkiye
      • Pricing Analysis
      • Market Share Analysis, 2024
        • By Classification
        • By Application
    • South Africa
      • Pricing Analysis
      • Market Share Analysis, 2024
        • By Classification
        • By Application
  17. Market Structure Analysis
    • Competition Dashboard
    • Competition Benchmarking
    • Market Share Analysis of Top Players
      • By Regional
      • By Classification
      • By Application
  18. Competition Analysis
    • Competition Deep Dive
      • Beans
        • Overview
        • Product Portfolio
        • Profitability by Market Segments (Product/Age /Sales Channel/Region)
        • Sales Footprint
        • Strategy Overview
          • Marketing Strategy
          • Product Strategy
          • Channel Strategy
      • Taylor
      • CDN
      • Etekcity
      • Comark Instruments
      • BonJour
      • OXO
      • Brewista
      • Rattleware
  19. Assumptions & Acronyms Used
  20. Research Methodology

List of Tables

  • Table 1: Global Market Value (USD Million) Forecast by Region, 2020 to 2035
  • Table 2: Global Market Value (USD Million) Forecast by Classification , 2020 to 2035
  • Table 3: Global Market Value (USD Million) Forecast by Application, 2020 to 2035
  • Table 4: North America Market Value (USD Million) Forecast by Country, 2020 to 2035
  • Table 5: North America Market Value (USD Million) Forecast by Classification , 2020 to 2035
  • Table 6: North America Market Value (USD Million) Forecast by Application, 2020 to 2035
  • Table 7: Latin America Market Value (USD Million) Forecast by Country, 2020 to 2035
  • Table 8: Latin America Market Value (USD Million) Forecast by Classification , 2020 to 2035
  • Table 9: Latin America Market Value (USD Million) Forecast by Application, 2020 to 2035
  • Table 10: Western Europe Market Value (USD Million) Forecast by Country, 2020 to 2035
  • Table 11: Western Europe Market Value (USD Million) Forecast by Classification , 2020 to 2035
  • Table 12: Western Europe Market Value (USD Million) Forecast by Application, 2020 to 2035
  • Table 13: Eastern Europe Market Value (USD Million) Forecast by Country, 2020 to 2035
  • Table 14: Eastern Europe Market Value (USD Million) Forecast by Classification , 2020 to 2035
  • Table 15: Eastern Europe Market Value (USD Million) Forecast by Application, 2020 to 2035
  • Table 16: East Asia Market Value (USD Million) Forecast by Country, 2020 to 2035
  • Table 17: East Asia Market Value (USD Million) Forecast by Classification , 2020 to 2035
  • Table 18: East Asia Market Value (USD Million) Forecast by Application, 2020 to 2035
  • Table 19: South Asia and Pacific Market Value (USD Million) Forecast by Country, 2020 to 2035
  • Table 20: South Asia and Pacific Market Value (USD Million) Forecast by Classification , 2020 to 2035
  • Table 21: South Asia and Pacific Market Value (USD Million) Forecast by Application, 2020 to 2035
  • Table 22: Middle East & Africa Market Value (USD Million) Forecast by Country, 2020 to 2035
  • Table 23: Middle East & Africa Market Value (USD Million) Forecast by Classification , 2020 to 2035
  • Table 24: Middle East & Africa Market Value (USD Million) Forecast by Application, 2020 to 2035

List of Figures

  • Figure 1: Global Market Pricing Analysis
  • Figure 2: Global Market Value (USD Million) Forecast 2020-2035
  • Figure 3: Global Market Value Share and BPS Analysis by Classification , 2025 and 2035
  • Figure 4: Global Market Y-o-Y Growth Comparison by Classification , 2025-2035
  • Figure 5: Global Market Attractiveness Analysis by Classification
  • Figure 6: Global Market Value Share and BPS Analysis by Application, 2025 and 2035
  • Figure 7: Global Market Y-o-Y Growth Comparison by Application, 2025-2035
  • Figure 8: Global Market Attractiveness Analysis by Application
  • Figure 9: Global Market Value (USD Million) Share and BPS Analysis by Region, 2025 and 2035
  • Figure 10: Global Market Y-o-Y Growth Comparison by Region, 2025-2035
  • Figure 11: Global Market Attractiveness Analysis by Region
  • Figure 12: North America Market Incremental Dollar Opportunity, 2025-2035
  • Figure 13: Latin America Market Incremental Dollar Opportunity, 2025-2035
  • Figure 14: Western Europe Market Incremental Dollar Opportunity, 2025-2035
  • Figure 15: Eastern Europe Market Incremental Dollar Opportunity, 2025-2035
  • Figure 16: East Asia Market Incremental Dollar Opportunity, 2025-2035
  • Figure 17: South Asia and Pacific Market Incremental Dollar Opportunity, 2025-2035
  • Figure 18: Middle East & Africa Market Incremental Dollar Opportunity, 2025-2035
  • Figure 19: North America Market Value Share and BPS Analysis by Country, 2025 and 2035
  • Figure 20: North America Market Value Share and BPS Analysis by Classification , 2025 and 2035
  • Figure 21: North America Market Y-o-Y Growth Comparison by Classification , 2025-2035
  • Figure 22: North America Market Attractiveness Analysis by Classification
  • Figure 23: North America Market Value Share and BPS Analysis by Application, 2025 and 2035
  • Figure 24: North America Market Y-o-Y Growth Comparison by Application, 2025-2035
  • Figure 25: North America Market Attractiveness Analysis by Application
  • Figure 26: Latin America Market Value Share and BPS Analysis by Country, 2025 and 2035
  • Figure 27: Latin America Market Value Share and BPS Analysis by Classification , 2025 and 2035
  • Figure 28: Latin America Market Y-o-Y Growth Comparison by Classification , 2025-2035
  • Figure 29: Latin America Market Attractiveness Analysis by Classification
  • Figure 30: Latin America Market Value Share and BPS Analysis by Application, 2025 and 2035
  • Figure 31: Latin America Market Y-o-Y Growth Comparison by Application, 2025-2035
  • Figure 32: Latin America Market Attractiveness Analysis by Application
  • Figure 33: Western Europe Market Value Share and BPS Analysis by Country, 2025 and 2035
  • Figure 34: Western Europe Market Value Share and BPS Analysis by Classification , 2025 and 2035
  • Figure 35: Western Europe Market Y-o-Y Growth Comparison by Classification , 2025-2035
  • Figure 36: Western Europe Market Attractiveness Analysis by Classification
  • Figure 37: Western Europe Market Value Share and BPS Analysis by Application, 2025 and 2035
  • Figure 38: Western Europe Market Y-o-Y Growth Comparison by Application, 2025-2035
  • Figure 39: Western Europe Market Attractiveness Analysis by Application
  • Figure 40: Eastern Europe Market Value Share and BPS Analysis by Country, 2025 and 2035
  • Figure 41: Eastern Europe Market Value Share and BPS Analysis by Classification , 2025 and 2035
  • Figure 42: Eastern Europe Market Y-o-Y Growth Comparison by Classification , 2025-2035
  • Figure 43: Eastern Europe Market Attractiveness Analysis by Classification
  • Figure 44: Eastern Europe Market Value Share and BPS Analysis by Application, 2025 and 2035
  • Figure 45: Eastern Europe Market Y-o-Y Growth Comparison by Application, 2025-2035
  • Figure 46: Eastern Europe Market Attractiveness Analysis by Application
  • Figure 47: East Asia Market Value Share and BPS Analysis by Country, 2025 and 2035
  • Figure 48: East Asia Market Value Share and BPS Analysis by Classification , 2025 and 2035
  • Figure 49: East Asia Market Y-o-Y Growth Comparison by Classification , 2025-2035
  • Figure 50: East Asia Market Attractiveness Analysis by Classification
  • Figure 51: East Asia Market Value Share and BPS Analysis by Application, 2025 and 2035
  • Figure 52: East Asia Market Y-o-Y Growth Comparison by Application, 2025-2035
  • Figure 53: East Asia Market Attractiveness Analysis by Application
  • Figure 54: South Asia and Pacific Market Value Share and BPS Analysis by Country, 2025 and 2035
  • Figure 55: South Asia and Pacific Market Value Share and BPS Analysis by Classification , 2025 and 2035
  • Figure 56: South Asia and Pacific Market Y-o-Y Growth Comparison by Classification , 2025-2035
  • Figure 57: South Asia and Pacific Market Attractiveness Analysis by Classification
  • Figure 58: South Asia and Pacific Market Value Share and BPS Analysis by Application, 2025 and 2035
  • Figure 59: South Asia and Pacific Market Y-o-Y Growth Comparison by Application, 2025-2035
  • Figure 60: South Asia and Pacific Market Attractiveness Analysis by Application
  • Figure 61: Middle East & Africa Market Value Share and BPS Analysis by Country, 2025 and 2035
  • Figure 62: Middle East & Africa Market Value Share and BPS Analysis by Classification , 2025 and 2035
  • Figure 63: Middle East & Africa Market Y-o-Y Growth Comparison by Classification , 2025-2035
  • Figure 64: Middle East & Africa Market Attractiveness Analysis by Classification
  • Figure 65: Middle East & Africa Market Value Share and BPS Analysis by Application, 2025 and 2035
  • Figure 66: Middle East & Africa Market Y-o-Y Growth Comparison by Application, 2025-2035
  • Figure 67: Middle East & Africa Market Attractiveness Analysis by Application
  • Figure 68: Global Market - Tier Structure Analysis
  • Figure 69: Global Market - Company Share Analysis
Dashboard
Dashboard
Dashboard
Dashboard
Dashboard
Dashboard

Our Research Products

Full Research Suite

The "Full Research Suite" delivers actionable market intel, deep dives on markets or technologies, so clients act faster, cut risk, and unlock growth.

Competitor Leaderboard Report

The Leaderboard benchmarks and ranks top vendors, classifying them as Established Leaders, Leading Challengers, or Disruptors & Challengers.

Future Leaders Index

Locates where complements amplify value and substitutes erode it, forecasting net impact by horizon

Market Data & Forecasts

We deliver granular, decision-grade intel: market sizing, 5-year forecasts, pricing, adoption, usage, revenue, and operational KPIs—plus competitor tracking, regulation, and value chains—across 60 countries broadly.

Market Focus Report

Spot the shifts before they hit your P&L. We track inflection points, adoption curves, pricing moves, and ecosystem plays to show where demand is heading, why it is changing, and what to do next across high-growth markets and disruptive tech

Survey Report

Real-time reads of user behavior. We track shifting priorities, perceptions of today’s and next-gen services, and provider experience, then pace how fast tech moves from trial to adoption, blending buyer, consumer, and channel inputs with social signals (#WhySwitch, #UX).

Bespoke Reports

Partner with our analyst team to build a custom report designed around your business priorities. From analysing market trends to assessing competitors or crafting bespoke datasets, we tailor insights to your needs.

Supplier Intelligence

Discovery & Profiling

Capacity & Footprint

Performance & Risk

Compliance & Governance

Commercial Readiness

Who Supplies Whom

Scorecards & Shortlists

Playbooks & Docs

Category Intelligence

Definition & Scope

Demand & Use Cases

Cost Drivers

Market Structure

Supply Chain Map

Trade & Policy

Operating Norms

Deliverables

Buyer Intelligence

Account Basics

Spend & Scope

Procurement Model

Vendor Requirements

Terms & Policies

Entry Strategy

Pain Points & Triggers

Outputs

Pricing Analysis

Benchmarks

Trends

Should-Cost

Indexation

Landed Cost

Commercial Terms

Deliverables

Brand Analysis

Positioning & Value Prop

Share & Presence

Customer Evidence

Go-to-Market

Digital & Reputation

Compliance & Trust

KPIs & Gaps

Outputs

Full Research Suite comprises of:

Market outlook & trends analysis

Market outlook & trends analysis

Interviews & case studies

Interviews & case studies

Strategic recommendations

Strategic recommendations

Vendor profiles & capabilities analysis

Vendor profiles & capabilities analysis

5-year forecasts

5-year forecasts

8 regions and 60+ country-level data splits

8 regions and 60+ country-level data splits

Market segment data splits

Market segment data splits

12 months of continuous data updates

12 months of continuous data updates

DELIVERED AS:

PDF EXCEL ONLINE

Full Research Suite


$2000

$3500

$5000

Buy Report Now
Similar Industry Reports

Similar Industry Reports

Milk Carton Market
Milk Carton Market

Milk Carton Market Size and Share Forecast Outlook 2025 to 2035

Milking Automation Market

Milking Automation Market Size and Share Forecast Outlook 2025 to 2035

Milking Robots Market

Milking Robots Market Size and Share Forecast Outlook 2025 to 2035

Milk Packaging Market

Milk Packaging Market Size and Share Forecast Outlook 2025 to 2035

Milk Clarifier Market

Milk Clarifier Market Size and Share Forecast Outlook 2025 to 2035

Milk Homogenizer Machine Market

Milk Homogenizer Machine Market Size and Share Forecast Outlook 2025 to 2035

Milk Pasteurization Machines Market

Milk Pasteurization Machines Market Size and Share Forecast Outlook 2025 to 2035

Milk Sterilizer Machine Market

Milk Sterilizer Machine Market Size and Share Forecast Outlook 2025 to 2035

Milk Powder Packaging Market

Milk Powder Packaging Market Size and Share Forecast Outlook 2025 to 2035

Milk Powder Packaging Machines Market

Milk Powder Packaging Machines Market Size and Share Forecast Outlook 2025 to 2035

Milk Protein Market
Milk Protein Market

Milk Protein Market - Size, Share, and Forecast 2025 to 2035

Milk Ingredients Market

Milk Ingredients Market Analysis - Size, Share, and Forecast Outlook 2025 to 2035

Milk Mineral Concentrate Market

Milk Mineral Concentrate Market Trends-Demand, Innovations & Forecast 2025 to 2035

Milk Thistle Market
Milk Thistle Market

Milk Thistle Market Analysis by Form, Distribution Channel and Region through 2035

Milk Powder Market
Milk Powder Market

Milk Powder Market Analysis by Type, Distribution Channel, Region and Other Applications Through 2035

Milk Tank Cooling System Market

Milk Tank Cooling System Market Growth – Trends & Forecast 2025 to 2035

Milk Alternatives Market

Milk Alternatives Market – Growth, Demand & Dairy-Free Trends

Milk Protein Hydrolysate Market

Milk Protein Hydrolysate Market Growth - Infant Nutrition & Functional Use 2024 to 2034

Milking Equipment Market

Milking Equipment Market

Milk Bottle Market
Milk Bottle Market

Milk Bottle Market Trends & Industry Growth Forecast 2024-2034

Future Market Insights

Milk Froth Thermometer Market

Chat With MaRIA

Chat With

MaRIA

Hi There, I am MaRIA, Your Market Research Intelligence Assistant. How may I help you?