

- Market Size (2026)
- USD 860.6 Mn
- Forecast (2036)
- USD 1388.5 Mn
- CAGR (2026 to 2036)
- 4.9%
How big is Mud Thinner Additives Market in 2026?
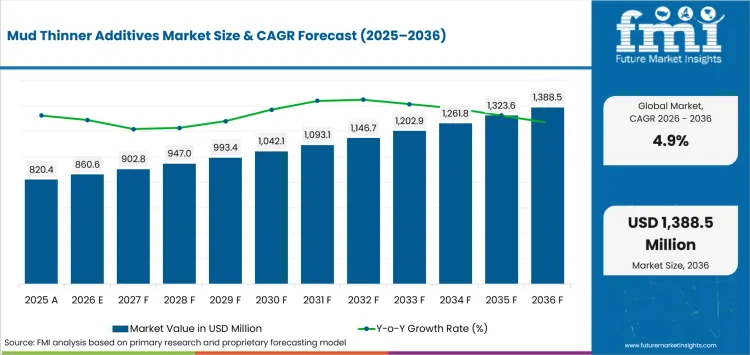
USD 860.6 million in 2026 and USD 1,388.5 million by 2036 at a 4.9% CAGR.
Demand for mud thinner additives is projected to expand at a 4.9% CAGR between 2026 and 2036, increasing valuation from USD 860.6 million to USD 1,388.5 million. Longer intervals in drilling and completion fluids raise the cost of uncontrolled viscosity because treatment delays consume circulation time and complicate pressure management. EIA documented record USA crude production of 13.6 million barrels per day in 2025 despite 5% fewer Lower 48 rigs and 1% fewer wells. That productivity pattern favors additives that restore target rheology with limited dilution.
Country demand diverges because drilling intensity and service geography shape treatment frequency. Canada Energy Regulator data published in June 2026 show Alberta supplied 83.8% of Canadian crude oil and equivalent output in 2025, concentrating stocking and field support in western basins. The USA needs wider shale-basin coverage because service points are more dispersed. Japan has a smaller specialized base where high-temperature geothermal and oilfield work places more weight on qualification depth than total order volume.
Key Takeaways
- Demand rises as longer and more productive wells increase the cost of viscosity excursions and time-consuming dilution during drilling.
- By additive type, lignosulfonates are estimated to hold 28.0% in 2026 owing to familiar dispersing performance in water-based systems.
- In 2026, water-based mud is expected to lead the mud system category with 44.0% share because drilled solids and clay hydration repeatedly alter rheology.
- Viscosity reduction is projected to hold 31.0% of application demand in 2026 as excessive yield point and gel strength trigger treatment.
- Fluid-system compatibility and offshore environmental screening slow switching because a cheaper thinner can introduce unacceptable rheology or discharge risk.
- Key players in the mud thinner additives market include Nouryon, Halliburton, SLB, Baker Hughes, Clariant, Innospec, and Borregaard.
Analyst Perspective
"Mud thinner selection starts with the fluid condition, not the price per drum. Repeat use depends on dose response under the expected solids load and salinity. Temperature and contamination then determine whether the chemistry stays usable deeper in the well. The stronger offer pairs a short qualification route with nearby inventory and field support that explains the rheology change."
- Nikhil Kaitwade, Principal Consultant, Future Market Insights
How is the mud thinner additives market segmented?
The mud thinner additives market is segmented by additive type, mud system, application, well environment, and sales channel.
Additive types include lignosulfonates, tannins, polyphosphates, synthetic dispersants, acrylic thinners, and low-chrome alternatives. Mud systems cover water-based, high-density, lime, saltwater, and HPHT formulations, while well environments include onshore, offshore, directional, and HPHT wells. Applications include viscosity reduction, gel-strength control, deflocculation, density-management support, and solids dispersion. Sales channels include mud service companies, oilfield distributors, direct specialty-chemical supply, and regional blending plants.
What makes lignosulfonates central to the additive type category?
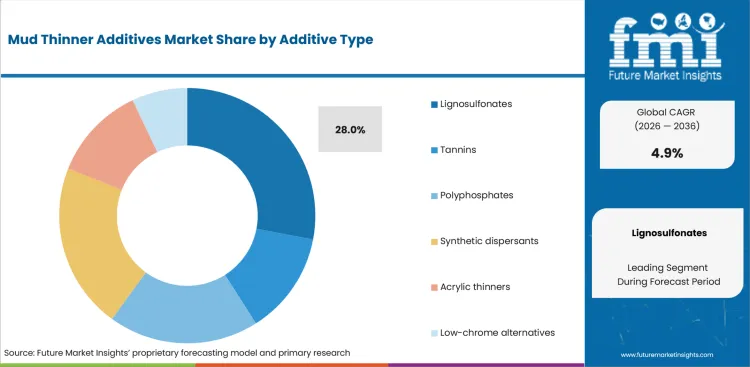
Lignosulfonates retain a practical role in water-based mud because their anionic chemistry disperses clay particles without requiring a different treatment route. Modern selection tests whether the formulation preserves that response while reducing the environmental burden associated with older chrome-containing chemistry.
- By additive type, lignosulfonates are estimated to hold 28.0% in 2026 owing to familiar deflocculation behavior in common water-based formulations.
- EPA’s January 2026 Gulf discharge evaluation identifies chrome or ferrochrome lignosulfonate among the water-based drilling-fluid ingredients considered moderately toxic to marine organisms. That screening pressure gives chrome-free alternatives a clearer qualification route where offshore environmental acceptability is part of product selection.
Why does water-based mud lead the mud system category?
Water-based mud changes repeatedly as drilled solids, reactive clays, salts, calcium, or cement enter the circulating fluid. Thinner doses must reduce flocculation without weakening suspension and hole cleaning, so predictable response matters more than a simple drop in viscosity.
- In 2026, water-based mud is expected to lead the mud system category with 44.0% share because active circulation repeatedly introduces solids and ionic contamination that require rheology correction.
- In September 2025, IMS and Newpark Fluids Systems announced real-time drilling-fluid measurement collaboration. Faster rheology feedback shortens the gap between a fluid change and treatment, favoring additives with repeatable dose response.
How does viscosity reduction shape demand within the application category?
Viscosity reduction becomes urgent once solids loading or flocculation pushes the fluid beyond its hydraulic target. Mud engineers must restore pumpability without sacrificing low-shear suspension, making dosage response and measurement quality central to treatment selection.
- Viscosity reduction is projected to hold 31.0% of application demand in 2026 owing to the direct cost of excess pump pressure, poor hole cleaning, and avoidable dilution.
- SLB's May 2025 AutoProfiler announcement described automated inline density and rheology measurements linked to treatment recommendations. Faster measurement turns viscosity correction into a controlled decision instead of a broad dilution response at surface.
What supports onshore leadership in the well environment category?
Onshore drilling fluids generate frequent treatment points because pad programs repeat similar well designs and allow regular access to mixing, testing, and replenishment. Land economics also put close attention on dilution volume and non-productive time, which gives low-dose rheology correction a practical cost case.
- Onshore wells are estimated at 42.0% of the well environment category in 2026 because repeat land drilling supports frequent testing and replenishment.
- The Railroad Commission of Texas issued 464 new-well permits and processed 1,117 oil completions in December 2025. That activity gives local mud teams repeat opportunities to standardize thinner treatment by basin.
Why do mud service companies lead the sales channel category?
Mud service companies within oil and gas field services influence additive choice because their engineers see the full treatment sequence and can test compatibility before a dosage change. That operating position is difficult to reproduce through commodity supply alone, especially in wells where salinity, contamination, and temperature change by section.
- Mud service companies are forecast to represent 43.0% of sales channel demand in 2026 because fluid diagnosis and treatment control accompany product supply.
- Clariant appointed Gapuma Group in July 2026 to distribute Well Service Additives in Nigeria, Côte d'Ivoire, and Ghana. The agreement gives service companies and formulators a shorter route to drilling chemistry.
What are the drivers, restraints and opportunities in the Mud Thinner Additives Market?
Longer laterals raise rheology-control demand, offshore discharge rules slow chemistry changes, and newer drilling-mud additives favor formulators that document performance under difficult fluid conditions.
- Driver: Longer horizontal intervals expose drilling fluids to more cuttings and contact time, increasing the penalty for viscosity and gel-strength excursions.
- Restraint: Offshore discharge controls and complete-fluid compatibility testing lengthen qualification before a thinner can replace an established treatment.
- Opportunity: Formulators that document low-dose performance under salinity, temperature, and contamination can win higher-value treatment work without expanding dilution volume.
Longer laterals keep drilling fluid in contact with cuttings for more time, raising the cost of rheology drift during circulation. EIA reported in August 2026 that wells longer than 15,000 feet represented 15% of new Permian completions in 2025. Longer geometry raises the value of thinner treatments that restore flow properties without extra fluid volume or avoidable circulation time.
Offshore chemistry changes must pass environmental review as well as rheology testing because discharge permits control what enters marine waters. EPA's February 2026 Gulf permit notice sets effluent limits, monitoring requirements, and supporting environmental review for offshore discharges. A replacement thinner therefore needs compatible mud performance and acceptable discharge characteristics before field adoption.
Specialty formulators in drilling mud chemicals can capture higher-value work by proving thinner performance under temperature, brine, and contamination conditions that weaken basic dispersants. Innospec's February 2026 Form 10-K states that its Oilfield Services business sells additives used to improve drilling muds. Decision-ready field data lets mud engineers compare treatment response directly instead of qualifying chemistry on broad product claims.
Which country CAGRs are profiled in the Mud Thinner Additives Market?
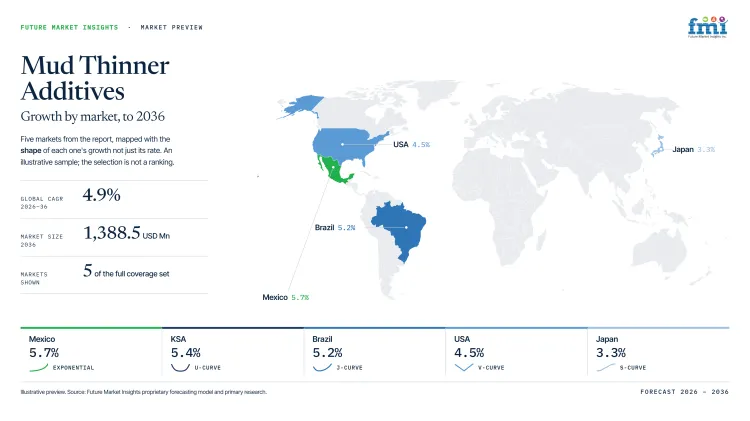
| Country | CAGR |
|---|---|
| Mexico | 5.7% |
| KSA | 5.4% |
| UAE | 5.3% |
| Brazil | 5.2% |
| USA | 4.5% |
| Canada | 4.4% |
| Japan | 3.3% |
How do country-level CAGRs compare in the Mud Thinner Additives Market?
The 2.4-point spread separates a four-country upper band from a steadier North American middle and a lower Japanese pace. Mexico, KSA, UAE, and Brazil exceed 5.0%, but different operating models sit behind those rates. USA and Canada are almost level, while Japan's smaller well base converts technical need into repeat additive demand more slowly.
- Mexico mixes deepwater complexity with steady land-well activity.
- KSA rewards local inventory for large gas programs.
- UAE favors rapid replenishment through domestic service hubs.
- Brazil's pre-salt work raises the cost of fluid instability.
- USA competition turns on dosage economics in shale programs.
- Canada rewards low-dose chemistry in mature western basins.
- Japan's smaller well base lengthens repeat-order cycles.
Similar CAGRs produce qualification costs, service loads, and inventory priorities. The full report provides country-level CAGR analysis across North America, Latin America, Western Europe, Eastern Europe, East Asia, South Asia and Pacific, and the Middle East and Africa.
Country-wise Analysis
- PEMEX's offshore and onshore programs expose mud systems to different pressure, temperature, and contamination profiles under one national drilling plan and two service models. Its April 2026 Form 20-F records 78 wells drilled in 2025 and notes completion delays on high-complexity wells linked to depth, pressure, and temperature. Mud thinner additive demand in Mexico is forecast to rise at 5.7% CAGR over the assessment period, tied to programs that reward low-dose rheology correction. Tighter capital deployment keeps treatment economics inside qualification, so high-temperature data and inventory near active service bases carry more weight than a broad catalogue for repeat use.
- Jafurah has shifted Saudi drilling toward repeat unconventional gas work, making consistent treatment response more valuable over multiwell development programs in the Eastern Province. By 2036, KSA is projected to grow at 5.4% CAGR, propelled by drilling intensity that raises demand for rheology correction under hot and saline conditions. Aramco said in February 2026 that Jafurah began production in December 2025 and that sales-gas capacity is targeted to grow about 80% by 2030 versus 2021. Local project scale favors standardized treatment, but distant stock and laboratory support can slow qualification if field conditions change faster than the local supply plan.
- ADNOC Drilling places many unconventional wells inside integrated service packages, so additive selection must fit a broader well-construction workflow and local inventory planning. Its July 2025 results stated that Turnwell had drilled more than 40% of a 144-well unconventional program, giving fluid teams a repeat sequence for testing and treatment. The UAE outlook is anticipated to advance at 5.3% CAGR over the assessment period, aided by program cadence and strong local oilfield-service capacity near active unconventional wells. Regional stocking reduces supply risk, while compatibility evidence decides whether a formulation moves from trial inventory into repeat use inside an integrated package.
- Deepwater execution shapes Brazilian mud-treatment economics because fluid instability consumes expensive rig time and replacement stock must reach offshore programs reliably in remote locations. Mud thinner additive sales in Brazil are forecast to expand at 5.2% CAGR by 2036, supported by continuing pre-salt exploration, appraisal, and development. EPE's December 2025 sector report records six exploratory wells in the Aram area and hydrocarbon confirmation in two, while the Equatorial Margin remained in pre-operational licensing. Discharge documentation and liquid-mud-plant logistics slow switching, giving formulations with nearby technical service teams an advantage over comparable chemistry sold without offshore support during long offshore campaigns.
- Large mud-service networks and basin supply bases let USA operators adjust treatment quickly during repeat shale programs and long lateral drilling in major shale basins. EIA reported in June 2026 that Permian marketed natural-gas production reached 27.6 Bcf/d in 2025 while crude output reached 6.6 million barrels per day. In the USA, mud thinner additive demand is predicted to advance at 4.5% CAGR through 2036, given sustained well productivity and longer well designs. Cost per foot stays the principal friction, so predictable low-dose response wins repeat orders only if it reduces dilution or other fluid-management work at the rig site.
- Western Canadian drilling concentrates demand in horizontal programs where winter logistics and regional service coverage control how quickly additive inventory reaches a rig during winter campaigns. Canada is estimated to post 4.4% CAGR over the forecast period, helped by a producing base that supports repeat field treatment. The Canada Energy Regulator reported in June 2026 that crude oil and equivalent production averaged 5.35 million barrels per day in 2025, with Alberta contributing 83.8%. That concentration gives distributors a clear stocking focus, but cost discipline limits products requiring high dosage and favors chemistry matched to local brines and repeat basin programs.
- Japan reaches thinner demand through a small set of technically demanding wells, with geothermal drilling providing a distinct high-temperature route in several volcanic regions. JOGMEC selected Kamikawa in Hokkaido as a Geothermal Frontier Project candidate in July 2026 and cited underground uncertainty, long development time, cost, and regulatory requirements. Adoption of mud thinner additives in Japan is estimated to expand at 3.3% CAGR through 2036, attributable to specialized drilling instead of broad well counts. Government-led investigation reduces early exploration risk, but long project cycles delay repeat chemical orders and place more weight on high-temperature water-based fluid knowledge than broad distributor coverage.
Who are the notable companies in the Mud Thinner Additives Market?
Nouryon, Halliburton, SLB, Baker Hughes, Clariant, Innospec, and Borregaard are the notable companies serving this market.
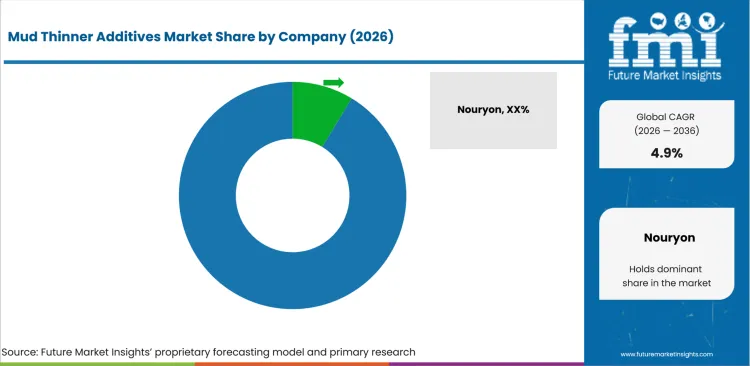
Competition splits between integrated drilling-fluid groups and oilfield chemical companies using different qualification routes. Halliburton, SLB, and Baker Hughes place chemistry inside wellsite service during active drilling. Nouryon, Clariant, Innospec, and Borregaard rely more on formulation evidence or focused chemistry.
- Nouryon, Clariant, and Innospec compete through specialty oilfield formulation, application testing, and regional commercial support without full drilling-service integration.
- Halliburton, SLB, and Baker Hughes embed fluid treatment in drilling execution, measurement, and engineering support at the wellsite.
- Borregaard takes a narrower route through lignin-based biopolymers sold into oilfield chemical applications.
Competitive Benchmarking: Mud Thinner Additives Market
| Company | Mud-Chemistry Relevance | Wellsite Service Integration | Condition Qualification Evidence | Geographic Reach |
|---|---|---|---|---|
| Nouryon | Medium | Medium | Medium | North America, Europe, Middle East and Asia |
| Halliburton | High | High | High | Global |
| SLB | High | High | High | Global |
| Baker Hughes | High | High | High | Global |
| Clariant | Medium | Medium | Medium | Global |
| Innospec | High | Medium | Medium | Americas, Europe, Middle East, Africa and Asia-Pacific |
| Borregaard | High | Low | High | Global oilfield customer base |
Scoring basis: High chemistry relevance requires direct drilling-mud additive evidence, Medium covers broader oilfield chemistry, and Low marks a narrow route. High service integration means wellsite fluid execution, with Medium for technical support and Low for chemistry supply. Qualification evidence is High for multiple difficult-condition records, Medium for narrower current proof, and Low for one operating route.
Key Developments in the Mud Thinner Additives Market
- In September 2025, Baker Hughes documented the first North Sea deployment of its DELTAFLOW organophilic clay-free drill-in fluid after laboratory and liquid-mud-plant validation. The field case links contamination tolerance and controlled rheology to a narrow offshore operating window, which raises the qualification value of chemistry that limits gelation before reservoir drilling.
- In March 2025, SLB won a Woodside Energy contract covering 18 ultra-deepwater Trion wells offshore Mexico, including drilling and completions fluids. The three-year scope places fluid formulation inside a repeat well-construction program where local supply, real-time service, and consistent execution influence chemical qualification.
- In January 2025, Halliburton secured a three-year Petrobras contract for integrated offshore drilling services in Brazil that includes BaraLogix real-time drilling-fluid services. Hydraulic analysis, surface measurements, and predictive fluid advice now sit inside the treatment workflow, making response quality part of chemical selection for those wells.
Key Players in the Mud Thinner Additives Market
Specialty Oilfield Chemistry
- Nouryon
Integrated Drilling-Fluid and Wellsite Providers
- Halliburton
- SLB
- Baker Hughes
Specialty Formulators and Lignin Chemistry
- Clariant
- Innospec
- Borregaard
Mud Thinner Additives Market - Report Scope
| Coverage field | Report scope |
|---|---|
| Market breakdown | By additive type, mud system, application, well environment, sales channel and region. |
| Quantitative Units | USD million. |
| Market Definition | Commercial revenue from standalone or formulated mud thinner, deflocculant, and dispersant additives sold primarily for drilling-mud rheology control. Complete mud-system services and adjacent drilling chemicals are excluded. |
| Regions Covered | North America, Latin America, Western Europe, Eastern Europe, East Asia, South Asia and Pacific and Middle East and Africa. |
| Countries Covered | Mexico, KSA, UAE, Brazil, USA, Canada, Japan, and 20+ countries included in the full report. |
| Key Companies Profiled | Nouryon, Halliburton, SLB, Baker Hughes, Clariant, Innospec, Borregaard. |
| Forecast Period | 2026 to 2036. |
| Approach | Primary and secondary research with market triangulation. |
Mud Thinner Additives Market - Research Methodology
| Method | Approach |
|---|---|
| Primary Research | FMI analysts gathered input from manufacturers, service providers, technology developers, distributors, end users, procurement teams, and subject-matter experts. Interviews examined purchasing decisions, product or service evaluation, adoption barriers, approval requirements, pricing considerations, and expectations for technical or commercial support. Respondents were also asked what evidence is required before a trial, pilot, or initial order develops into regular purchasing. |
| Desk Research | Desk research covered government statistics, regulatory publications, trade data, industry associations, technical literature, standards, company filings, product information, and official corporate announcements. Sources were reviewed for relevance, publication date, geographic coverage, and consistency with the defined market scope. Claims relating to performance, applications, approvals, capacity, investment, and commercial activity were retained only when supported by credible public evidence. |
| Market Sizing and Forecasting | The market model combined the baseline value with historical performance, segment structure, pricing and volume indicators, adoption levels, company participation, and country-level demand conditions. Forecast assumptions considered economic activity, investment trends, regulatory developments, technology adoption, purchasing cycles, supply availability, and barriers to wider market use. Segment and regional estimates were reconciled before the final market total was calculated. |
| Data Validation | Estimates were checked against multiple independent indicators, including public data, company activity, trade patterns, industry developments, and findings from primary interviews. Validation also tested whether products, services, applications, and company revenues fell within the defined market boundaries. Adjacent categories, unsupported claims, overlapping revenues, and activities without direct market relevance were excluded to reduce double counting and maintain consistency across segments and countries. |
Mud Thinner Additives Market by Segments
Mud Thinner Additives Market segmented by Additive Type:
- Lignosulfonates
- Tannins
- Polyphosphates
- Synthetic dispersants
- Acrylic thinners
- Low-chrome alternatives
Mud Thinner Additives Market segmented by Mud System:
- Water-based mud
- High-density mud
- Lime mud
- Saltwater mud
- HPHT mud
Mud Thinner Additives Market segmented by Application:
- Viscosity reduction
- Gel strength control
- Deflocculation
- Density management support
- Solids dispersion
Mud Thinner Additives Market segmented by Well Environment:
- Onshore
- Offshore
- Directional wells
- HPHT wells
Mud Thinner Additives Market segmented by Sales Channel:
- Mud service companies
- Oilfield distributors
- Direct specialty chemical supply
- Regional blending plants
Mud Thinner Additives Market by Region:
- North America
- United States
- Canada
- Latin America
- Brazil
- Mexico
- Argentina
- Chile
- Western Europe
- Germany
- France
- United Kingdom
- Italy
- Spain
- Benelux
- Nordics
- Eastern Europe
- Poland
- Czech Republic
- Romania
- Hungary
- East Asia
- China
- Japan
- South Korea
- South Asia and Pacific
- India
- ASEAN
- Australia and New Zealand
- Middle East and Africa
- GCC Countries
- South Africa
- Türkiye
- Israel
Research Sources and Bibliography
- January). Ocean Discharge Criteria Evaluation for GMG290000.
- IMS Intelligent Mud Solutions & Newpark Fluids Systems. (2025, September 4). IMS and Newpark Fluids Systems announce strategic collaboration agreement for real-time fluids measurement.
- SLB. (2025, May 1). SLB innovative technologies recognized with 2025 Spotlight on New Technology Awards at OTC.
- Railroad Commission of Texas. (2026, January 30). Texas drilling permit and completion statistics for December 2025.
- Clariant. (2026, July 29). Clariant appoints Gapuma Group as Well Service Additives distributor across West Africa.
- USA Energy Information Administration. (2026, August 19). Longer wells boost Permian crude oil and natural gas production.
- USA Environmental Protection Agency. (2026, February 26). Public notice: NPDES General Permit GMG290000 for offshore oil and gas extraction.
- Innospec Inc. (2026, February 18). Annual Report on Form 10-K for the fiscal year ended December 31, 2025.
- Petróleos Mexicanos. (2026, April 30). Form 20-F for the fiscal year ended December 31, 2025.
- Aramco. (2026, February 26). Aramco’s gas strategy builds momentum with major progress towards growth target.
- ADNOC Drilling. (2025, July 30). ADNOC Drilling delivers record 1H 2025 results, revenue grows 30% and upgrades guidance.
- Energy Research Office - EPE. (2025, December 29). Brazilian Oil & Gas Report 2024/2025.
- USA Energy Information Administration. (2026, June 18). Permian natural gas production increased faster than crude oil.
- Canada Energy Regulator. (2026, June 17). Market Snapshot: Canada sets new record in crude oil production in 2025.
- Japan Organization for Metals and Energy Security. (2026, July 10). Geothermal Frontier Project: Kamikawa, Hokkaido selected as a candidate site.
- Baker Hughes. (2025, September 30). First North Sea deployment of DELTAFLOW OCF delivers well 100 hours early.
- SLB. (2025, March 31). SLB awarded major drilling contract by Woodside Energy for ultra-deepwater Trion development.
- Halliburton. (2025, January 30). Halliburton secures major offshore drilling contract with Petrobras.
- Nouryon. (2025, June 18). Nouryon launches Innovation Center for oilfield solutions in Texas, US.
- Clariant. (2025, September 8). Clariant Oil Services launches customer portal for seamless digital access.
- Halliburton. (2026, July 9). Eni and Halliburton achieve industry first with closed-loop rig automation in deepwater Indonesia.
- SLB. (2025, June 23). SLB announces digital collaboration with Cactus Drilling.
- Nouryon. (2025, February 10). Nouryon opens new office in Al Dhahran to strengthen presence in Saudi Arabia and the Middle East.
- Halliburton. (2025, February 26). Halliburton and Sekal deliver world’s first automated on-bottom drilling system for Equinor in the North Sea.
- SLB. (2025, January 8). SLB awarded multi-region deepwater contracts by Shell to support capital-efficient energy development.
- Baker Hughes. (2026, March 23). DELTAFLOW drill-in fluid optimizes liner placement in extended lateral.
- Borregaard ASA. (2026, March 26). Annual Report 2025.
- Clariant. (2025, September 2). Clariant Oil Services and Swire Energy Services open new supply base in Norway supporting European energy production.
- Clariant. (2026, June 24). Clariant achieves North Sea breakthrough with OSPAR-compliant low-dosage hydrate inhibitor technology.
- Innospec Oilfield Services. (2025, April 9). Innospec Oilfield Services' OKC manufacturing center has earned ISO 9001 certification!
This bibliography is provided for reader reference and is not exhaustive. The full report contains the complete reference list and detailed citations
This Report Answers
- How large is the mud thinner additives market in 2026 and what value is forecast for 2036?
- Which drilling conditions increase the commercial need for rheology-control additives?
- Why do lignosulfonates hold the leading position within additive type?
- How does water-based mud sustain repeat demand for deflocculants and dispersants?
- Why does viscosity reduction remain the largest application route for thinner treatment?
- How do country growth rates differ among Mexico, KSA, UAE, Brazil, USA, Canada, and Japan?
- Which companies serve the market through integrated drilling-fluid services or specialty chemistry?
- How do offshore discharge requirements and complete-fluid compatibility slow product switching?
Frequently Asked Questions
How big is the mud thinner additives market in 2026?
The mud thinner additives market is valued at USD 860.6 million in 2026 and is projected to reach USD 1,388.5 million by 2036. Growth follows longer well intervals and tighter control of viscosity without unnecessary dilution.
What is the CAGR of the mud thinner additives market from 2026 to 2036?
The mud thinner additives market is projected to grow at a CAGR of 4.9% between 2026 and 2036. Expansion follows continued drilling activity and repeated rheology correction as solids and contaminants change fluid behavior.
Which additive type leads the mud thinner additives market?
The lignosulfonates segment is expected to hold 28.0% of the mud thinner additives market in 2026, attributable to familiar deflocculation behavior in water-based systems. Low-chrome alternatives also shorten environmental screening where discharge requirements affect chemistry selection.
Which mud system leads the mud thinner additives market?
The water-based mud segment is expected to hold 44.0% of the mud thinner additives market in 2026, driven by repeated exposure to drilled solids and reactive clays. Frequent testing gives thinner chemistry a repeat treatment role during active drilling.
Which companies are active in the mud thinner additives market?
Key companies operating in the mud thinner additives market include Nouryon, Halliburton, SLB, Baker Hughes, Clariant, Innospec, and Borregaard. Their positions differ between integrated drilling-fluid service, specialty oilfield formulation, and focused lignin-based chemistry.
Preview the report firsthand - request a free sample
Get SampleGet the brochure for pricing and purchase details.
Get PDFTable of Content
- Key Takeaways
- Market Size and CAGR
- Top Growth Driver
- Fastest Growing Segment
- Leading Region
- Key Companies
- Emerging Opportunities
- Executive Summary
- Global Market Outlook
- Demand-side Trends
- Supply-side Trends
- Technology Roadmap Analysis
- Analysis and Recommendations
- Analyst Perspective (What is happening? Why now? What should investors know?)
- Key Questions Answered
- How large is the market?
- What is the CAGR?
- What are key trends?
- Which region dominates?
- Who are the leaders?
- Market Overview
- Market Coverage / Taxonomy
- Market Definition / Scope / Limitations
- Research Methodology
- Chapter Orientation
- Analytical Lens and Working Hypotheses
- Market Structure, Signals, and Trend Drivers
- Benchmarking and Cross-market Comparability
- Market Sizing, Forecasting, and Opportunity Mapping
- Research Design and Evidence Framework
- Desk Research Programme (Secondary Evidence)
- Expert Input and Fieldwork (Primary Evidence)
- Tooling, Models, and Reference Databases
- Data Engineering and Model Build
- Quality Assurance and Audit Trail
- Market Background
- Market Dynamics (Drivers, Restraints, Opportunity, Trends)
- Scenario Forecast (Optimistic, Likely, Conservative)
- Impact Analysis
- AI Impact
- Sustainability Impact
- Regulatory Impact
- Technology Impact
- Consumer / Buyer Analysis
- Purchase Drivers
- Adoption Barriers
- Buyer Journey
- Opportunity Map Analysis
- Product Life Cycle Analysis
- Supply Chain Analysis
- Investment Feasibility Matrix
- Value Chain Analysis
- PESTLE and Porter's Analysis
- Regulatory Landscape
- Regional Parent Market Outlook
- Production and Consumption Statistics
- Import and Export Statistics
- Global Market Analysis and Forecast, 2021 to 2036
- Historical Market Size Value (USD Million) Analysis, 2021 to 2025
- Current and Future Market Size Value (USD Million) Projections, 2026 to 2036
- Y-o-Y Growth Trend Analysis
- Absolute $ Opportunity Analysis
- Global Market Pricing Analysis, 2021 to 2036
- Global Market Analysis and Forecast, By Additive Type, 2021 to 2036
- Introduction / Key Findings
- Historical Market Size Value (USD Million) Analysis By Additive Type, 2021 to 2025
- Current and Future Market Size Value (USD Million) Analysis and Forecast By Additive Type, 2026 to 2036
- Lignosulfonates
- Tannins
- Polyphosphates
- Synthetic dispersants
- Acrylic thinners
- Low-chrome alternatives
- Lignosulfonates
- Y-o-Y Growth Trend Analysis By Additive Type, 2021 to 2025
- Absolute $ Opportunity Analysis By Additive Type, 2026 to 2036
- Global Market Analysis and Forecast, By Mud System, 2021 to 2036
- Introduction / Key Findings
- Historical Market Size Value (USD Million) Analysis By Mud System, 2021 to 2025
- Current and Future Market Size Value (USD Million) Analysis and Forecast By Mud System, 2026 to 2036
- Water-based mud
- High-density mud
- Lime mud
- Saltwater mud
- HPHT mud
- Water-based mud
- Y-o-Y Growth Trend Analysis By Mud System, 2021 to 2025
- Absolute $ Opportunity Analysis By Mud System, 2026 to 2036
- Global Market Analysis and Forecast, By Application, 2021 to 2036
- Introduction / Key Findings
- Historical Market Size Value (USD Million) Analysis By Application, 2021 to 2025
- Current and Future Market Size Value (USD Million) Analysis and Forecast By Application, 2026 to 2036
- Viscosity reduction
- Gel strength control
- Deflocculation
- Density management support
- Solids dispersion
- Viscosity reduction
- Y-o-Y Growth Trend Analysis By Application, 2021 to 2025
- Absolute $ Opportunity Analysis By Application, 2026 to 2036
- Global Market Analysis and Forecast, By Well Environment, 2021 to 2036
- Introduction / Key Findings
- Historical Market Size Value (USD Million) Analysis By Well Environment, 2021 to 2025
- Current and Future Market Size Value (USD Million) Analysis and Forecast By Well Environment, 2026 to 2036
- Onshore
- Offshore
- Directional wells
- HPHT wells
- Onshore
- Y-o-Y Growth Trend Analysis By Well Environment, 2021 to 2025
- Absolute $ Opportunity Analysis By Well Environment, 2026 to 2036
- Global Market Analysis and Forecast, By Sales Channel, 2021 to 2036
- Introduction / Key Findings
- Historical Market Size Value (USD Million) Analysis By Sales Channel, 2021 to 2025
- Current and Future Market Size Value (USD Million) Analysis and Forecast By Sales Channel, 2026 to 2036
- Mud service companies
- Oilfield distributors
- Direct specialty chemical supply
- Regional blending plants
- Mud service companies
- Y-o-Y Growth Trend Analysis By Sales Channel, 2021 to 2025
- Absolute $ Opportunity Analysis By Sales Channel, 2026 to 2036
- Global Market Analysis and Forecast, By Region, 2021 to 2036
- Introduction
- Historical Market Size Value (USD Million) Analysis By Region, 2021 to 2025
- Current Market Size Value (USD Million) Analysis and Forecast By Region, 2026 to 2036
- North America
- Latin America
- Western Europe
- Eastern Europe
- East Asia
- South Asia and Pacific
- Middle East & Africa
- Market Attractiveness Analysis By Region
- North America Market Analysis and Forecast, By Country, 2021 to 2036
- Historical Market Size Value (USD Million) Trend Analysis By Market Taxonomy, 2021 to 2025
- Market Size Value (USD Million) Forecast By Market Taxonomy, 2026 to 2036
- By Country
- USA
- Canada
- By Additive Type
- By Mud System
- By Application
- By Well Environment
- By Sales Channel
- By Country
- Market Attractiveness Analysis
- By Country
- By Additive Type
- By Mud System
- By Application
- By Well Environment
- By Sales Channel
- Key Takeaways
- Latin America Market Analysis and Forecast, By Country
- Historical Market Size Value (USD Million) Trend Analysis By Market Taxonomy, 2021 to 2025
- Market Size Value (USD Million) Forecast By Market Taxonomy, 2026 to 2036
- By Country
- Brazil
- Mexico
- Chile
- Rest of Latin America
- By Additive Type
- By Mud System
- By Application
- By Well Environment
- By Sales Channel
- By Country
- Market Attractiveness Analysis
- By Country
- By Additive Type
- By Mud System
- By Application
- By Well Environment
- By Sales Channel
- Key Takeaways
- Western Europe Market Analysis and Forecast, By Country
- Historical Market Size Value (USD Million) Trend Analysis By Market Taxonomy, 2021 to 2025
- Market Size Value (USD Million) Forecast By Market Taxonomy, 2026 to 2036
- By Country
- Germany
- UK
- Italy
- Spain
- France
- Nordic
- BENELUX
- Rest of Western Europe
- By Additive Type
- By Mud System
- By Application
- By Well Environment
- By Sales Channel
- By Country
- Market Attractiveness Analysis
- By Country
- By Additive Type
- By Mud System
- By Application
- By Well Environment
- By Sales Channel
- Key Takeaways
- Eastern Europe Market Analysis and Forecast, By Country
- Historical Market Size Value (USD Million) Trend Analysis By Market Taxonomy, 2021 to 2025
- Market Size Value (USD Million) Forecast By Market Taxonomy, 2026 to 2036
- By Country
- Russia
- Poland
- Hungary
- Balkan & Baltic
- Rest of Eastern Europe
- By Additive Type
- By Mud System
- By Application
- By Well Environment
- By Sales Channel
- By Country
- Market Attractiveness Analysis
- By Country
- By Additive Type
- By Mud System
- By Application
- By Well Environment
- By Sales Channel
- Key Takeaways
- East Asia Market Analysis and Forecast, By Country
- Historical Market Size Value (USD Million) Trend Analysis By Market Taxonomy, 2021 to 2025
- Market Size Value (USD Million) Forecast By Market Taxonomy, 2026 to 2036
- By Country
- China
- Japan
- South Korea
- By Additive Type
- By Mud System
- By Application
- By Well Environment
- By Sales Channel
- By Country
- Market Attractiveness Analysis
- By Country
- By Additive Type
- By Mud System
- By Application
- By Well Environment
- By Sales Channel
- Key Takeaways
- South Asia and Pacific Market Analysis and Forecast, By Country
- Historical Market Size Value (USD Million) Trend Analysis By Market Taxonomy, 2021 to 2025
- Market Size Value (USD Million) Forecast By Market Taxonomy, 2026 to 2036
- By Country
- India
- ASEAN
- Australia & New Zealand
- Rest of South Asia and Pacific
- By Additive Type
- By Mud System
- By Application
- By Well Environment
- By Sales Channel
- By Country
- Market Attractiveness Analysis
- By Country
- By Additive Type
- By Mud System
- By Application
- By Well Environment
- By Sales Channel
- Key Takeaways
- Middle East & Africa Market Analysis and Forecast, By Country
- Historical Market Size Value (USD Million) Trend Analysis By Market Taxonomy, 2021 to 2025
- Market Size Value (USD Million) Forecast By Market Taxonomy, 2026 to 2036
- By Country
- Kingdom of Saudi Arabia
- Other GCC Countries
- Türkiye
- South Africa
- Other African Union
- Rest of Middle East & Africa
- By Additive Type
- By Mud System
- By Application
- By Well Environment
- By Sales Channel
- By Country
- Market Attractiveness Analysis
- By Country
- By Additive Type
- By Mud System
- By Application
- By Well Environment
- By Sales Channel
- Key Takeaways
- Key Countries Market Analysis
- USA
- Pricing Analysis
- Market Share Analysis, 2025
- By Additive Type
- By Mud System
- By Application
- By Well Environment
- By Sales Channel
- Canada
- Pricing Analysis
- Market Share Analysis, 2025
- By Additive Type
- By Mud System
- By Application
- By Well Environment
- By Sales Channel
- Mexico
- Pricing Analysis
- Market Share Analysis, 2025
- By Additive Type
- By Mud System
- By Application
- By Well Environment
- By Sales Channel
- Brazil
- Pricing Analysis
- Market Share Analysis, 2025
- By Additive Type
- By Mud System
- By Application
- By Well Environment
- By Sales Channel
- Chile
- Pricing Analysis
- Market Share Analysis, 2025
- By Additive Type
- By Mud System
- By Application
- By Well Environment
- By Sales Channel
- Germany
- Pricing Analysis
- Market Share Analysis, 2025
- By Additive Type
- By Mud System
- By Application
- By Well Environment
- By Sales Channel
- UK
- Pricing Analysis
- Market Share Analysis, 2025
- By Additive Type
- By Mud System
- By Application
- By Well Environment
- By Sales Channel
- Italy
- Pricing Analysis
- Market Share Analysis, 2025
- By Additive Type
- By Mud System
- By Application
- By Well Environment
- By Sales Channel
- Spain
- Pricing Analysis
- Market Share Analysis, 2025
- By Additive Type
- By Mud System
- By Application
- By Well Environment
- By Sales Channel
- France
- Pricing Analysis
- Market Share Analysis, 2025
- By Additive Type
- By Mud System
- By Application
- By Well Environment
- By Sales Channel
- India
- Pricing Analysis
- Market Share Analysis, 2025
- By Additive Type
- By Mud System
- By Application
- By Well Environment
- By Sales Channel
- ASEAN
- Pricing Analysis
- Market Share Analysis, 2025
- By Additive Type
- By Mud System
- By Application
- By Well Environment
- By Sales Channel
- Australia & New Zealand
- Pricing Analysis
- Market Share Analysis, 2025
- By Additive Type
- By Mud System
- By Application
- By Well Environment
- By Sales Channel
- China
- Pricing Analysis
- Market Share Analysis, 2025
- By Additive Type
- By Mud System
- By Application
- By Well Environment
- By Sales Channel
- Japan
- Pricing Analysis
- Market Share Analysis, 2025
- By Additive Type
- By Mud System
- By Application
- By Well Environment
- By Sales Channel
- South Korea
- Pricing Analysis
- Market Share Analysis, 2025
- By Additive Type
- By Mud System
- By Application
- By Well Environment
- By Sales Channel
- Russia
- Pricing Analysis
- Market Share Analysis, 2025
- By Additive Type
- By Mud System
- By Application
- By Well Environment
- By Sales Channel
- Poland
- Pricing Analysis
- Market Share Analysis, 2025
- By Additive Type
- By Mud System
- By Application
- By Well Environment
- By Sales Channel
- Hungary
- Pricing Analysis
- Market Share Analysis, 2025
- By Additive Type
- By Mud System
- By Application
- By Well Environment
- By Sales Channel
- Kingdom of Saudi Arabia
- Pricing Analysis
- Market Share Analysis, 2025
- By Additive Type
- By Mud System
- By Application
- By Well Environment
- By Sales Channel
- Türkiye
- Pricing Analysis
- Market Share Analysis, 2025
- By Additive Type
- By Mud System
- By Application
- By Well Environment
- By Sales Channel
- South Africa
- Pricing Analysis
- Market Share Analysis, 2025
- By Additive Type
- By Mud System
- By Application
- By Well Environment
- By Sales Channel
- USA
- Market Structure Analysis
- Competition Dashboard
- Competition Benchmarking
- Market Share Analysis of Top Players
- By Regional
- By Additive Type
- By Mud System
- By Application
- By Well Environment
- By Sales Channel
- Emerging Startups
- Innovation Benchmarking
- Competition Analysis
- Competition Deep Dive
- Nouryon
- Overview
- Product Portfolio
- Profitability by Market Segments
- Sales Footprint
- Strategy Overview
- Marketing Strategy
- Product Strategy
- Channel Strategy
- Halliburton
- SLB
- Baker Hughes
- TETRA Technologies
- Clariant
- Innospec
- Kemira
- Ashland
- Borregaard
- Nouryon
- Case Studies
- Success Stories
- Recent Developments
- Competition Deep Dive
- Assumptions & Acronyms Used


