
- Market Size (2026)
- USD 6.5 Bn
- Forecast (2036)
- USD 14.0 Bn
- CAGR (2026 to 2036)
- 8.0%
How Big Is the Neodymium Market in 2026?
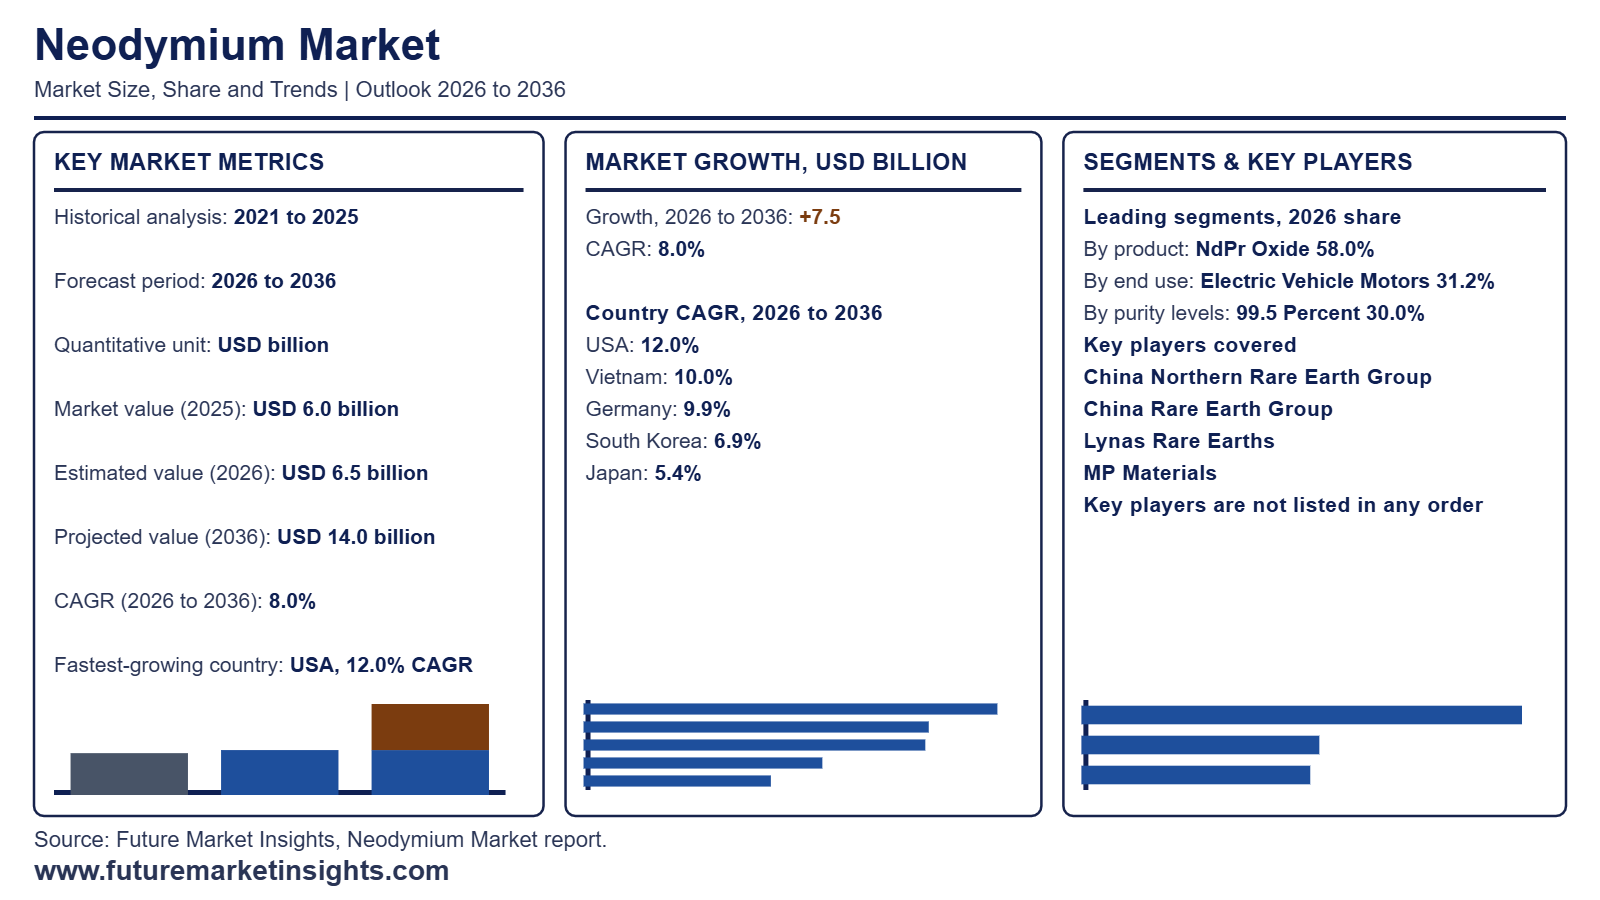
The global neodymium market is valued at USD 6.5 billion in 2026, up from USD 6.0 billion in 2025, and is projected by Future Market Insights (FMI) to reach USD 14.0 billion by 2036, expanding at an 8.0% CAGR to generate USD 7.5 billion in incremental revenue over the forecast decade.
| Market Metric | Valuation / Share / Forecast Benchmark |
|---|---|
| 2025 Market Size (Historical) | USD 6.0 billion |
| 2026 Market Size (Estimated) | USD 6.5 billion |
| 2036 Market Size (Projected) | USD 14.0 billion |
| Compound Annual Growth Rate (2026 to 2036) | 8.0% CAGR |
| Incremental Dollar Opportunity (2026 to 2036) | USD 7.5 billion |
| Dominant Product (2026 to 2036 Share) | NdPr Oxide (58.0% in 2026, easing to 55.8% by 2036) |
| Leading & Fastest-Growing End Use | Electric Vehicle Motors (31.2% share in 2026; 11.2% CAGR) |
| Leading & Fastest-Growing Purity Levels | 99.5 Percent (30.0% share in 2026; 6.5% CAGR) | 99.99 Percent and Above (10.4% CAGR) |
| Largest Country Markets (2026 Global Share) | Japan (13.0%), USA (12.0%), Germany (9.0%) |
| Fastest-Growing Country Markets (2026 to 2036) | USA (12.0% CAGR), Vietnam (10.0% CAGR), Germany (9.9% CAGR) |
| Leading Tier-1 Companies | China Northern Rare Earth Group, China Rare Earth Group, Lynas Rare Earths, MP Materials |
Source: Future Market Insights analysis of the neodymium market, 2026.
Executive Market Overview
Nearly one dollar in three of neodymium revenue is pulled by electric vehicle traction motors, where magnet chemistry decides torque, heat tolerance and yield, so carmakers buy by program and qualification, not spot price. Industrial motors, appliances and HVAC add volume under tighter cost limits. Demand is anchored in East Asia, where magnet makers sit beside separation plants, and is spreading to North America and Europe as governments back local supply chains for high performance permanent magnets. Japan is the largest profiled country at 13.0%, the USA holds 12.0% and Germany 9.0%. The USA also leads growth at a 12.0% CAGR, with Vietnam at 10.0% and Germany at 9.9% as motor and magnet assembly lands in each.
Supply concentration is the structural weak spot: separation capacity for NdPr sits in few hands, and any feedstock or export disruption shows up at once in oxide prices and magnet delivery schedules. Buyers are hedging by qualifying non-Chinese separated oxide, funding recycled streams through magnet recycling chemicals routes, and locking price floors into offtakes. Heavy rare earth tightness, visible in dysprosium, squeezes high-temperature magnet grades further. FMI sees 99.99 Percent and Above purity growing at 10.4% and Electric Vehicle Motors at 11.2%, versus 8.0% for the total. The sizing is built on neodymium inputs: NdPr oxide, NdPr metal and alloys, and neodymium oxide and metal. Finished magnets, motors and the products containing them are not counted.
Analyst Perspective
“Neodymium value will concentrate in magnet-grade oxide and metal, as EV traction motors and wind turbines lock in long-term offtake for supply that is traceable and consistent. The watch-point is China’s grip on mining, separation and magnet production, where an export licensing change can reprice the whole chain overnight and leave non-Chinese buyers paying a security premium.”
- Nikhil Kaitwade, Principal Consultant, Future Market Insights (FMI)
Major Market Trends and Insights
- Rear-Side Copper Adoption Is Redefining What Back-Contact Paste Is Worth: Silver has climbed 187% above where it began 2025 and paste now makes up as much as 30% of a finished cell’s cost. Back-contact architecture offers an escape route, since the report notes that copper works well there, although the format remains a small slice of production. That tension shows in FMI’s numbers: back contact expands at 5.4% annually, three times the pace of TOPCon at 1.8%, even though TOPCon still commands 52.0% of 2026 demand. Suppliers that cannot offer copper-capable pastes risk losing share in the segment growing fastest. Heraeus, one of FMI’s tier-1 names, must rebalance its portfolio toward lower-silver chemistries as a result.
- Duties on Asian Solar Imports Strengthen the Case for US-Built Cells and Local Paste: Washington keeps tightening its grip on imported cells. On September 11, 2026, the U.S. Department of Commerce confirmed antidumping and countervailing duties on crystalline silicon cells from India, Indonesia and Laos, setting India’s dumping margin at 123.04% after Indian shipments reached 2.30 billion watts in 2024. The petitioning alliance counts Hanwha Q CELLS USA, First Solar and Mission Solar Energy among its members, and orders on Cambodia, Malaysia, Thailand and Vietnam came earlier. For paste makers the consequence is geographic: FMI gives the USA the quickest growth among countries, 3.0% a year, with Vietnam trailing at 2.7%, so suppliers able to serve domestic lines stand to benefit. Onshore cell lines will want nearby, qualified paste supply.
- Copper-Hybrid Pastes Hold Down Revenue per Watt on Front-Side Metallization: Fire-through front paste supplies 62.0% of 2026 revenue yet advances only 1.6% a year in FMI’s forecast, and recent technical news explains why. DK Electronic Materials told investors a strategic customer now runs its high-copper paste at gigawatt scale alongside a silver seed-layer paste suited to TOPCon 3.0. Research points the same direction: Fraunhofer ISE lowered silver demand to 1.1 mg/Wp, from 10 to 12 mg/Wp, while M10 cells reached 24% efficiency, matching conventional screen printing. Both developments lower silver content per watt without sacrificing output. Suppliers will have to earn growth through hybrid and low-temperature formulations rather than silver tonnage.
What Are the Main Drivers, Restraints, and Opportunities?
Traction-motor design choices keep neodymium oxide moving in steady volumes, yet refining that sits overwhelmingly in one country and slow customer approvals blunt any rush toward new sources, so recycled feed and non-Chinese oxide-to-metal conversion are where qualified alternatives can take hold.
Driver: Permanent-Magnet Traction Motors Locking In NdPr Purchasing
Once a carmaker freezes a motor around sintered NdFeB magnets, neodymium becomes a standing line item rather than a spot buy, and that commitment runs through the whole permanent magnet motor supply chain. IEA (May 2025) reported that electric car sales topped 17 million worldwide in 2024, rising by more than 25%. Each platform carries its own magnet grade and oxide specification, and approval windows run long. Sales volume alone overstates near-term buying, because an announced model is not yet a purchase order. Producers that prove oxide composition and conversion behavior on the customer's own line turn program visibility into scheduled deliveries.
Restraint: One-Country Refining, Price Swings and Slow Customer Approval
Neodymium sits downstream of rare earth metals separation, the stage where supply is least diversified. IEA (April 2026) found that China produced 91% of global refined magnet rare earths in 2024 and 94% of sintered permanent magnets. A buyer hunting for a second origin therefore still has to clear traceability, yield and magnet performance checks. Price adds friction: USGS (February 2026) lists neodymium oxide at $56 per kilogram for 2024 and an estimated $73 for 2025. Offtake contracts soften the swing, but they cannot create conversion capacity outside the incumbent route.
Opportunity: Recycled Feed and Non-Chinese Oxide-to-Metal Conversion Capacity
Spent magnets and fabrication scrap offer a second feed route when collection yields a steady stream, which matters to high performance permanent magnet producers that must hold tight property specifications. MP Materials (July 2025) agreed to supply Apple with US-made magnets from 100% recycled material, with shipments expected to begin in 2027. Asian Metal (January 2026) reported that Jinmeng Rare Earth, a China Northern Rare Earth unit, began trial production at an automated NdFeB waste recycling facility. FMI projects 99.99% and above purity at a 10.4% CAGR and EV motors at 11.2% through 2036. Recycled oxide earns a seat in qualified supply only when it matches mined feed on composition and process behavior.
How Is the Neodymium Market Segmented?
The neodymium market is segmented by product and end use and purity and source with region as the geographic frame. Each axis views the same neodymium revenue from its own angle.
| Segmentation Axis | Sub-Segments Covered | 2026 Leading Segment & Share | Main Growth Benchmark (2026 to 2036) |
|---|---|---|---|
| Product |
|
NdPr Oxide (58.0%) | Reaches 55.8% by 2036 while NdPr Metal and Alloys advances at 9.2% CAGR |
| End Use |
|
Electric Vehicle Motors (31.2%) | Leads and grows fastest at 11.2% CAGR |
| Purity |
|
99.5 Percent (30.0%) | 99.99 Percent and Above rises at 10.4% CAGR |
| Source |
|
Bastnaesite-Based Supply (52.0%) | Recycled Material rises fastest at 12.5% CAGR |
| Region |
|
Japan (13.0%) | USA grows fastest at 12.0% CAGR with Vietnam next at 10.0% |
Future Market Insights analysis of the neodymium market 2026.
What Makes Mixed NdPr Oxide the Preferred Product Form?
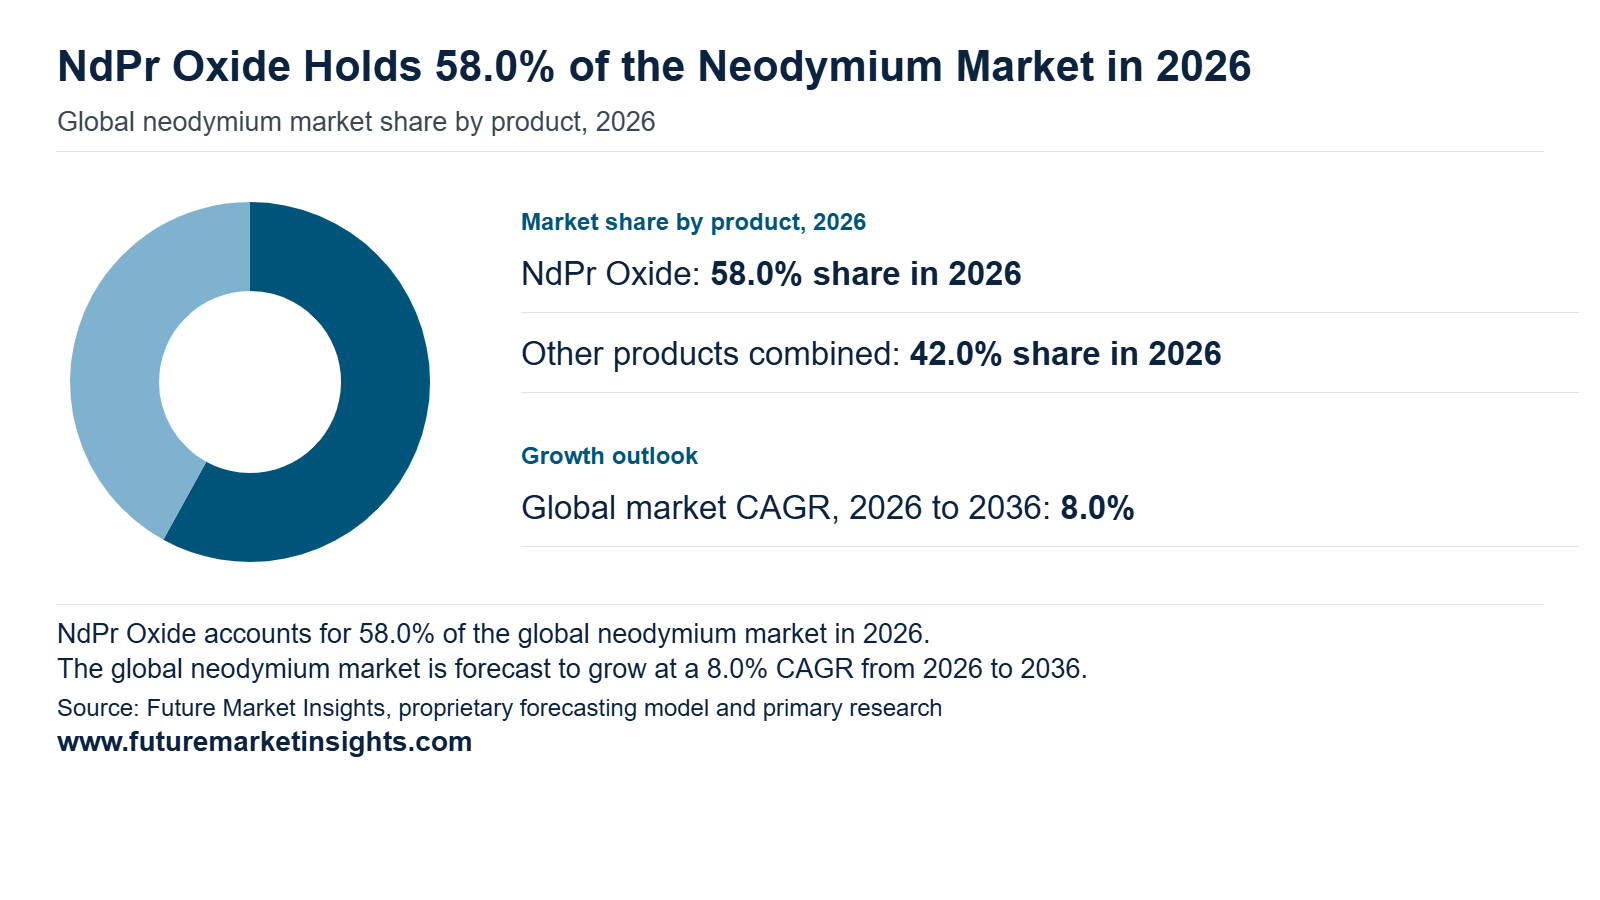
Magnet metal makers value mixed NdPr oxide because it moves straight into conversion once the Nd to Pr ratio and purity are set. That convenience gives the form 58.0% of 2026 product revenue. Energy Fuels (June 2024) started commercial production of separated NdPr at its White Mesa facility in Utah to metal maker specifications and showed how much oxide quality shapes the high-performance magnet supply chain. The segment advances at a derived 7.6% CAGR and remains a core 55.8% in 2036. NdPr Metal and Alloys sets the pace at 9.2% CAGR as buyers move closer to the finished magnet.
Why Does Electric Vehicle Motor Demand Lead the End-Use Field?
Electric Vehicle Motors reaches 41.8% of end-use revenue by 2036 from 31.2% in 2026 on an 11.2% CAGR that tops the 8.0% market pace. Automakers qualify magnets program by program so chemistry gains in torque and heat endurance turn into long supply agreements. Neo Performance Materials (September 2026) shipped its first commercial volumes of sintered magnets to an EV traction-motor customer which marks a key qualification step for every permanent magnet motor program. Industrial motors and appliances add steady volume around this leader and make Electric Vehicle Motors both the largest and the quickest end use.
Where Does the 99.5 Percent Grade Get Its Authority?
Pricing desks gained a clear reference point when S&P Global (June 2026) launched an FOB China NdPr oxide assessment built on a 99.5% minimum total rare-earth oxide content and a 75 to 25 Nd to Pr ratio. That assessment describes pricing rather than segment size yet it echoes why 99.5 Percent captures 30.0% of 2026 purity revenue. Standard industrial feeds accept it readily and refining effort stays efficient. Share settles at 26.1% in 2036 on a 6.5% CAGR while 99.99 Percent and Above grows fastest at 10.4% as impurity limits for elements such as dysprosium gain attention.
Which Feedstock Carries the Most Weight in Neodymium Supply?
USGS (February 2026) identifies bastnaesite mined at Mountain Pass California and monazite from heavy-mineral sands in the southeastern United States as the main domestic feedstocks. Bastnaesite-Based Supply leads with 52.0% of 2026 source revenue because established hard-rock mines deliver light rare-earth concentrates ready for separation. A 7.5% CAGR gives it 49.6% in 2036. Monazite and ionic clays widen the choice of routes while stockpile releases round out supply. Recycled Material grows fastest at 12.5% CAGR as scrap collection programs mature and magnet recycling chemicals open new recovery routes.
Neodymium Market by Region and Country (2026 to 2036)
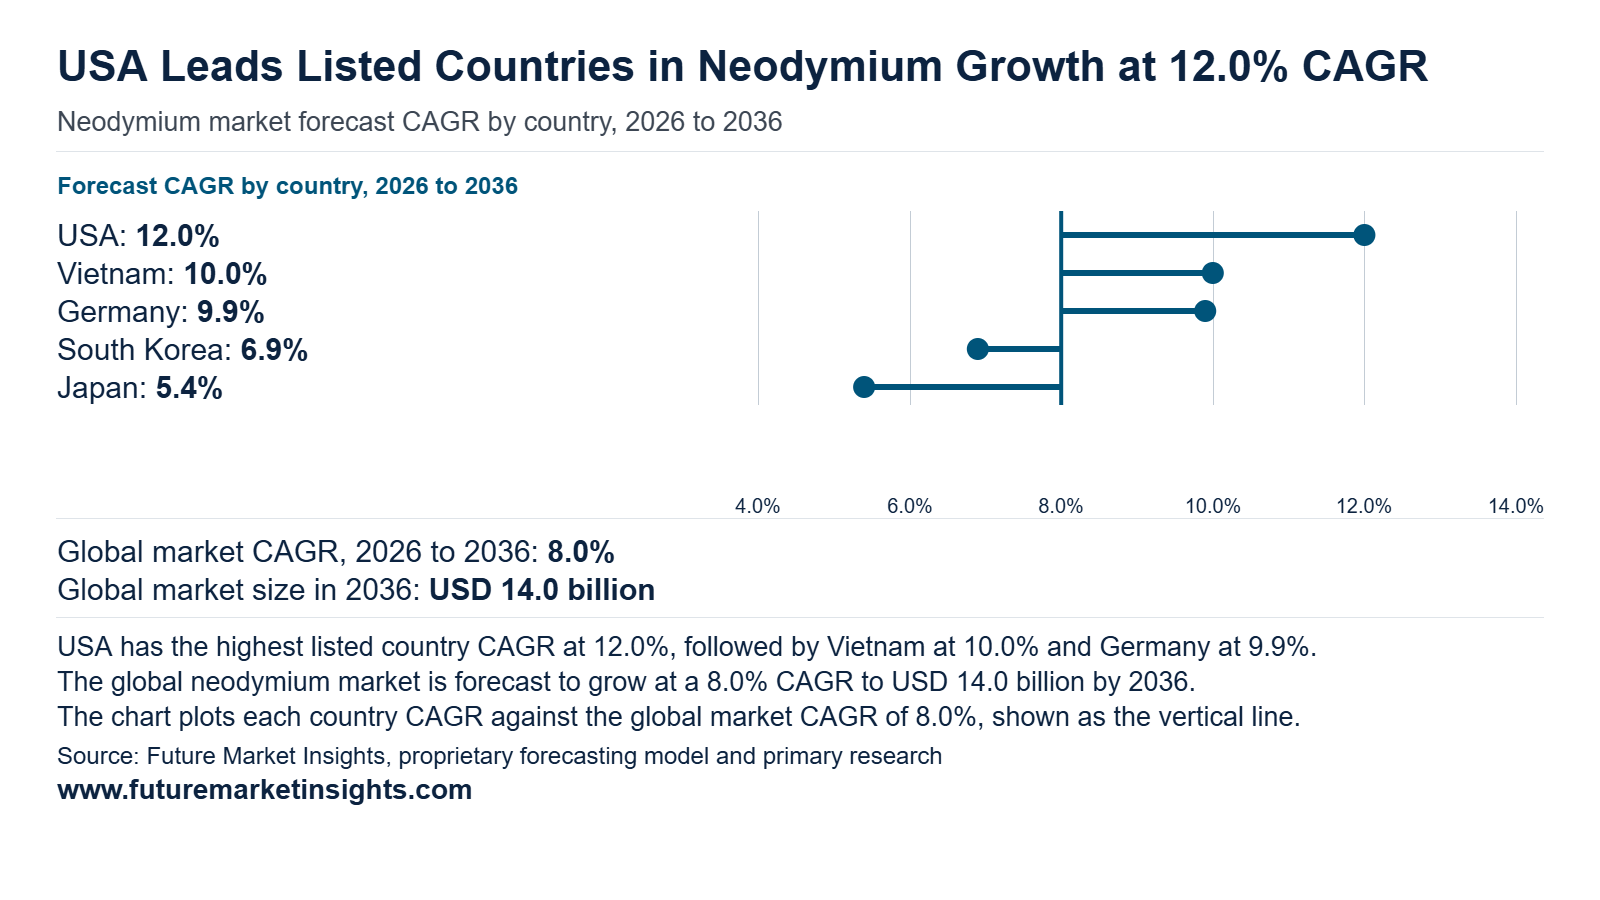
The five tracked countries hold 42.0% of global neodymium revenue in 2026, and that grip tightens to 46.1% by 2036, so concentration widens instead of narrowing. Leadership changes hands along the way. The United States, second at 12.0% today, climbs to 17.3% on an added USD 1,643 million, while Japan falls from first place at 13.0% to 10.2%. Below them, a smaller Asian pair scales quickly: South Korea and Vietnam move from USD 520 million to USD 1,097 million, a gain of USD 577 million, as both governments build rare earth supply arrangements with partners, a route that also reshapes sourcing.
| Country | 2026 Revenue | 2036 Revenue | 10-Year Addition | 2026 to 2036 CAGR | Global Share (2026 → 2036) |
|---|---|---|---|---|---|
| USA | USD 780 million | USD 2,423 million | USD 1,643 million | 12.0% | 12.0% → 17.3% |
| Vietnam | USD 130 million | USD 337 million | USD 207 million | 10.0% | 2.0% → 2.4% |
| Germany | USD 585 million | USD 1,504 million | USD 919 million | 9.9% | 9.0% → 10.7% |
| South Korea | USD 390 million | USD 760 million | USD 370 million | 6.9% | 6.0% → 5.4% |
| Japan | USD 845 million | USD 1,430 million | USD 585 million | 5.4% | 13.0% → 10.2% |
Source: Future Market Insights analysis of the neodymium market, 2026.
Japan
Japan starts the decade as the largest tracked market at USD 845 million but grows only 5.4% a year, reaching USD 1,430 million by 2036 for an addition of USD 585 million. That is the slowest pace among the five, so its global share slides from 13.0% to 10.2% and the top rank passes to the United States. The constraint is supply rather than demand. METI’s 2026 white paper states that Japan’s imports of heavy rare earth elements are fully dependent on China, and that JOGMEC equity support for Lynas and Caremag has secured alternative heavy rare earth sources (Ministry of Economy, Trade and Industry, May 2026). Buyers pay for security, so premium contracts with non-Chinese producers matter more than volume growth.
United States
The Department of Defense agreed to a ten-year NdPr price floor of USD 110 per kilogram for MP Materials (MP Materials, July 2025), and the company then chose Northlake, Texas for a magnet campus involving more than USD 1.25 billion of investment (MP Materials, February 2026). Guaranteed pricing de-risks domestic refining, so automakers and defense buyers can sign local magnet supply contracts instead of importing finished magnets. Early offtake deals should therefore favor firms with US-based capacity. A 3.11-fold expansion, from USD 780 million to USD 2,423 million, makes the United States the pace-setter at a 12.0% CAGR. The USD 1,643 million addition lifts share from 12.0% to 17.3% and moves the country from second place to first. Policy and capital explain the surge.
Germany
European supply-security policy frames Germany’s outlook, with revenue rising from USD 585 million to USD 1,504 million, an addition of USD 919 million at a 9.9% CAGR. Share improves from 9.0% to 10.7%, enough to pass Japan for second place by 2036. The European Commission’s RESourceEU plan, adopted in December 2025, puts rare earth permanent magnet value chains at the center of its immediate focus (European Commission, December 2025), and VACUUMSCHMELZE operates a magnet plant in Hanau (VACUUMSCHMELZE, July 2026). October 2026 strategic project picks add rare earth work for this chain (European Commission, October 2026). Local magnet capacity beside automotive and industrial motor builders shortens qualification loops, which gives domestic producers an edge over importers whenever buyers look for alternatives to Chinese magnets.
South Korea
Growth still trails the global 8.0%, so share eases from 6.0% to 5.4%. South Korea begins from a smaller base of USD 390 million and nearly doubles it to USD 760 million, a 1.95-fold rise worth USD 370 million at a 6.9% CAGR. Procurement is turning toward government channels. The trade ministry agreed with Canada in June 2026 to prepare a joint critical minerals stockpiling plan by the end of 2026 (Ministry of Trade, Industry and Resources, June 2026), and Korean companies operating in Vietnam told the ministry in April 2026 that securing rare earth supplies was a main concern (Ministry of Trade, Industry and Resources, April 2026). Shared stockpiles steady input costs for magnet users and favor suppliers that can commit to long contracts.
Vietnam
A 2025 amendment to the Law on Geology and Minerals bans raw ore exports and limits exploration, mining and processing to state-designated enterprises (Ministry of Agriculture and Environment of Vietnam, April 2026). Vietnam’s rare earth rules shape its path. Revenue rises from USD 130 million to USD 337 million, adding USD 207 million at a 10.0% CAGR, and share edges from 2.0% to 2.4%, making it the smallest market and the second fastest. The Politburo has since called for closed-loop chains running from extraction to final applied products, covering magnets and magnetic materials (VGP News, August 2026). Domestic processing mandates favor investors who bring separation and magnet technology, so joint ventures are the likely entry route. Local partners gain negotiating weight.
Competitive Environment and Notable Companies
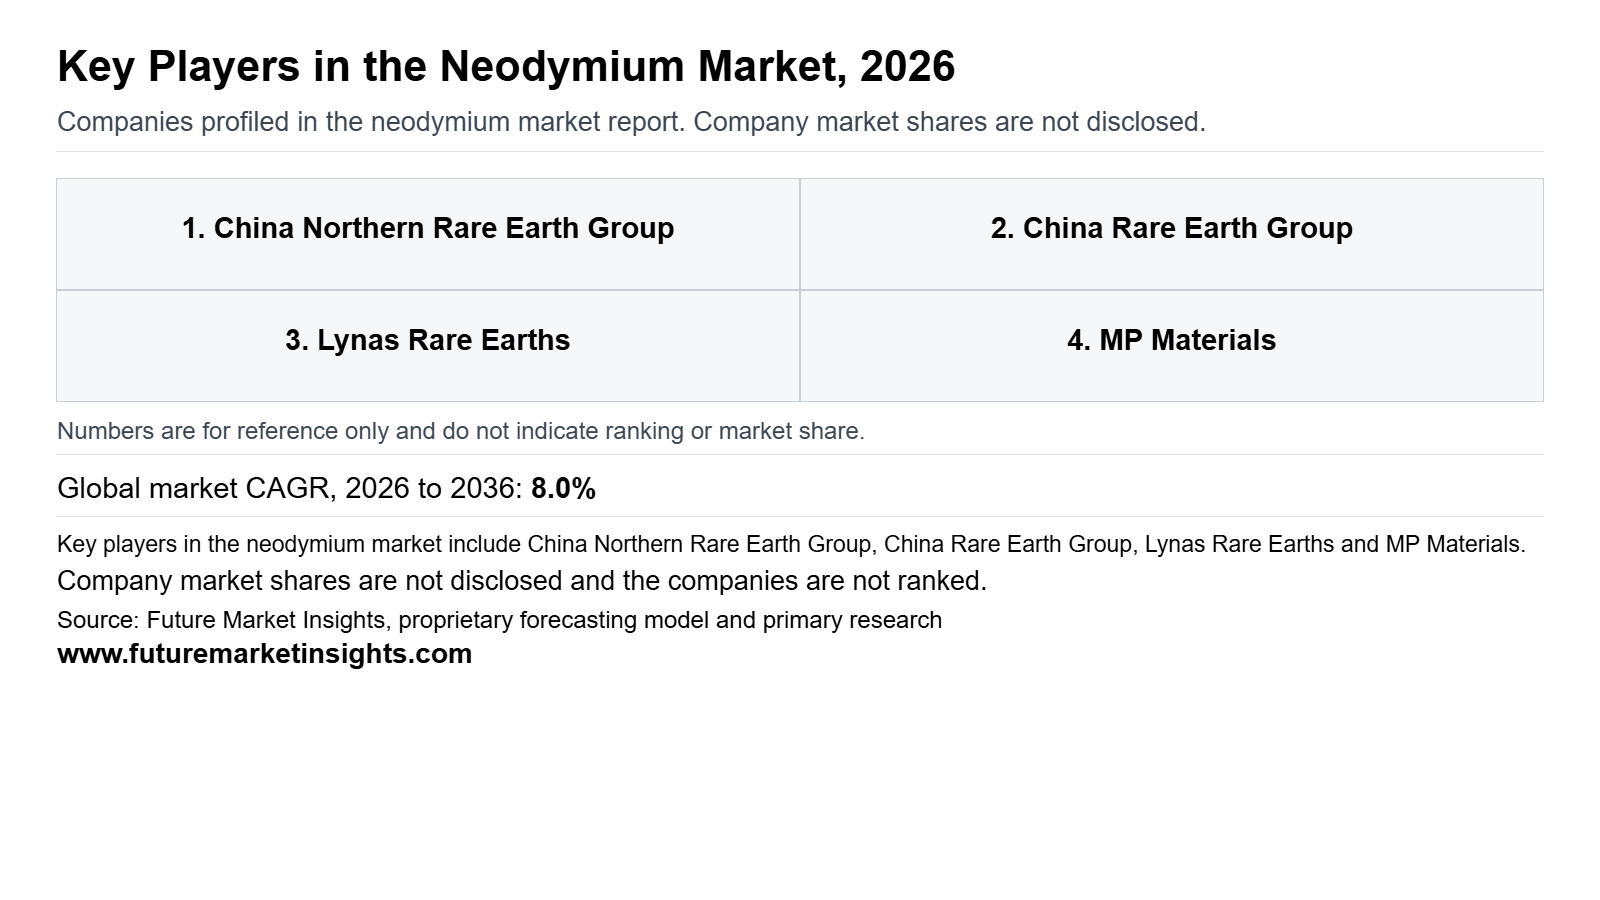
Notable companies operating in the global neodymium market include China Northern Rare Earth Group, China Rare Earth Group, Shenghe Resources, Lynas Rare Earths, MP Materials, Neo Performance Materials, Solvay and Energy Fuels. Neodymium rarely trades alone: it travels with praseodymium as NdPr oxide, then moves into metal, alloy and finally magnets. Each company therefore occupies a different stretch of that chain, from Chinese ore-to-oxide platforms to Western plants built to reduce dependence on them. Chinese state-linked groups still anchor volumes, while Western producers compete on traceability and heavy rare earth capability. The profiled roles describe operations, not rankings by sales or market share.
How Are Companies Positioned in the Neodymium Market?
Roles divide by where in the chain value is captured. The Chinese platforms, China Northern Rare Earth Group, China Rare Earth Group and Shenghe Resources, control ore, quotas and separation at home. Lynas Rare Earths, MP Materials and Energy Fuels pair their own feedstock with separation and, increasingly, metal or magnet steps. Neo Performance Materials and Solvay take a narrower line in Europe, combining specialist separation with magnet-linked or recycled supply. Their strength lies in being credible non-Chinese alternatives, and no profile here implies leadership by volume.
What Matters When a Buyer Selects a Neodymium Supplier?
A magnet maker or motor supplier first asks whether the oxide arrives on spec and on schedule. Purity, consistency between lots and a record of delivered tonnes come ahead of price. Origin has moved up the list too, since some automotive and defense programs now want supply that avoids Chinese processing. Government price support for NdPr, such as the $110 per kilogram floor in the MP Materials arrangement, adds a financing angle that buyers weigh when choosing a long-term partner.
Which Capabilities Distinguish Product Offers?
Capability depends on how far past oxide a company can go. China Northern Rare Earth Group and MP Materials show conversion into metal or alloy, and MP now runs NdFeB permanent magnet production at its Independence facility in Fort Worth since December 2025. Lynas and Energy Fuels concentrate on oxide, with heavy rare earth steps such as dysprosium and terbium added alongside. Solvay and Neo bring separation know-how tied to European magnet makers, and recycled feed is part of Solvay's plan. Evidence of recovery from end-of-life magnets remains thin outside China Northern and Solvay's stated plans.
How Does Geographic Reach Affect Competition?
Footprints follow the ore and the policy. China Northern is built around Baotou, and China Rare Earth Group spreads across several provinces. Shenghe reaches abroad through project interests, including Tanzania's Ngualla deposit. Lynas mines in Australia and separates in Malaysia, MP Materials works across California and Texas, and Energy Fuels processes at its Utah mill. Neo operates in Estonia and Solvay in France. Because governments increasingly steer where critical materials are refined, location now shapes contract eligibility as much as logistics.
| Verified Company Evidence (2026) | Commercial Effect | Buyer Action |
|---|---|---|
| 29 October 2026: Lynas reported a record 2,082 tonnes of NdPr for the September 2026 quarter, with gross sales revenue of A$310.1m. It also signed a partnership for a 3,000 tonne per year NdFeB magnet factory in Kuantan, Malaysia (7 July 2026), and entered a binding deed to acquire Meteoric Resources (1 October 2026). [Lynas Rare Earths quarterly report (October 2026)] | Lynas is extending from oxide into magnet supply and Brazilian ionic clay feedstock, which widens its role beyond a separator. | Plan for a roughly one-month Malaysia shutdown in the December 2026 quarter when setting delivery schedules. |
| 25 March 2026: Energy Fuels produced its first kilogram of 99.9% pure terbium oxide at White Mesa Mill in Utah. Existing circuits are expected to yield 850 to 1,000 tonnes of NdPr from about 10,000 tonnes of monazite, and Phase 2 is expected to lift NdPr oxide capacity above 6,000 tonnes per year. [Energy Fuels via PR Newswire (March 2026)] | A US oxide source with heavy rare earth ambitions gives Western magnet makers another qualification candidate. | Request pilot-lot samples now, and treat Phase 2 volumes as subject to approvals and feedstock. |
| 26 February 2026: MP Materials selected Northlake, Texas for its 10X magnet campus, with over $1.25 billion in capital and more than 1,500 jobs. Commissioning is targeted for 2028, supporting about 10,000 metric tons of annual NdFeB magnet output company-wide. [Expansion Solutions Magazine (February 2026)] | Government-backed demand certainty (a 10-year offtake) lets MP scale magnets ahead of competitors. | Buyers outside the DoD program should confirm what share of output stays open for commercial contracts. |
Source: Verified corporate disclosures and Future Market Insights analysis, 2026.
| Company | Core Positioning | Verified Activity & Source Attribution |
|---|---|---|
| China Northern Rare Earth Group | Large-scale light rare earth processing in Baotou with internal recycling | Expected first-half 2026 net profit of 1.98 to 2.06 billion yuan, up 112.74% to 121.33% (SMM, July 2026) |
| China Rare Earth Group | State-owned exploration, separation and processing across several provinces | Agreed to take 51% stakes in four Shenghe smelting and separation subsidiaries through a subsidiary (Engineering News, October 2026) |
| Shenghe Resources | Separation assets plus overseas project ownership | Released a 2026 to 2028 development plan; Ngualla in Tanzania holds 4.62 million tonnes of REO resources (SMM, August 2026) |
| Lynas Rare Earths | Mt Weld mining, Malaysian separation, contracted industrial customers | Record 2,082 tonnes NdPr in the September 2026 quarter (Lynas quarterly report, October 2026) |
| MP Materials | Mountain Pass feedstock, US NdPr metal and magnets | NdFeB magnet production began at Independence in December 2025 (S&P Global, September 2026) |
| Neo Performance Materials | European separation with specialized magnet businesses | Solvent extraction line at Silmet commissioned, producing first terbium and dysprosium oxide (SMM, April 2026) |
| Solvay | High-purity separation at La Rochelle | Letter of intent with Viridis for Brazilian feedstock; industrial-scale Dy and Tb separation targeted for September 2026 (Solvay via Investegate, June 2026) |
| Energy Fuels | Oxide from US monazite at White Mesa | First kilogram of terbium oxide at 99.9% purity (Energy Fuels via PR Newswire, March 2026) |
Source: Verified corporate disclosures and Future Market Insights analysis, 2026.
Neodymium Market Report Scope and Research Methodology
FMI builds the global neodymium market from the revenue generated when neodymium-bearing oxides, metals, and alloys change hands commercially, then tests the total against national rare earth processing and permanent magnet supply chain data. NdPr oxide and NdPr metal and alloy sales carry the largest share of value, since magnet makers buy neodymium mostly in these forms for electric vehicle motors, industrial automation, and consumer electronics. Neodymium is counted once, at the material transaction. Finished magnets, motors, devices, mining services, and substitute materials are left out, so embedded content is never added again at the system level. Interviews with separators, metal and alloy producers, magnet manufacturers, and buyers sit alongside a review of trade statistics, regulatory filings, standards, and company reports. Supply from bastnaesite, ionic clay, monazite, recycled material, and stockpiles is reconciled by purity grade and by country, so regional values add up to the global total for each year. Company information confirms product ranges and capacity announcements but is not used to derive company revenues.
| Coverage Field | Report Scope |
|---|---|
| Market definition | Revenue from commercial sales of neodymium-bearing oxides, metals, and alloys in the stated product, end use, purity, and source categories. |
| Products | NdPr oxide, NdPr metal and alloys, neodymium oxide, and neodymium metal. |
| End uses | Electric vehicle motors, glass, ceramics, catalysts and other, industrial motors and automation, consumer electronics, and appliances and HVAC. |
| Purity levels | 99 percent, 99.5 percent, 99.9 percent, and 99.99 percent and above. |
| Sources | Bastnaesite-based supply, ionic clay supply, monazite-based supply, recycled material, and stockpile and other sources. |
| Exclusions | Finished magnets, electric motors, electronic devices, mining services, and adjacent or substitute materials. |
| Quantitative units | USD billion for value. |
| Value basis | Revenue at the relevant material transaction, with embedded neodymium not counted again in finished-system revenue. |
| Regions covered | North America, Latin America, Western Europe, Eastern Europe, East Asia, South Asia and Pacific, and Middle East and Africa. |
| National coverage | USA, China, Japan, Germany, South Korea, Vietnam, and India. |
| Companies covered | China Northern Rare Earth Group, China Rare Earth Group, Shenghe Resources, Lynas Rare Earths, MP Materials, Neo Performance Materials, Solvay, and Energy Fuels. |
| Forecast period | 2026 to 2036. |
| Approach | Primary and secondary research with market triangulation, followed by validation against independent indicators to avoid double counting. |
Source: Future Market Insights analysis of the neodymium market, 2026.
Research Sources and Bibliography
- Asia Economy (August 2026). Which Korean Company Is Emerging as the Supplier of Space Solar Materials for SpaceX? https://view.asiae.co.kr/en/article/2026080408503788170
- Energy Fuels (June 2024). Energy Fuels Achieves Commercial Production of Separated Rare Earths at White Mesa. Engineering News. https://engineeringnews.co.za/print-version/energy-fuels-achieves-commercial-production-of-separated-rare-earths-at-white-mesa-2024-06-11
- EnergyTrend (n.d.). Total Contracted Capacity Reaches 760MW, BC Modules Gain High Recognition from Taiwanese Customers (LONGi and GIGA SOLAR agreements). https://www.energytrend.com/print/50123
- European Commission (n.d.). Critical raw materials. https://commission.europa.eu/topics/competitiveness/green-deal-industrial-plan/european-critical-raw-materials-act_en
- European Commission (December 2025). RESourceEU Action Plan, COM(2025) 945 final. https://eur-lex.europa.eu/legal-content/EN/TXT/?uri=CELEX%3A52025DC0945
- International Energy Agency (May 2025). Global EV Outlook 2025: Trends in electric car markets. https://www.iea.org/reports/global-ev-outlook-2025/trends-in-electric-car-markets-2
- International Energy Agency (April 2026). Rare Earth Elements: Executive summary. https://www.iea.org/reports/rare-earth-elements/executive-summary
- Ministry of Agriculture and Environment, Vietnam (April 2026). Khoáng sản chiến lược: Quản lý chặt đất hiếm. https://mae.gov.vn/khoang-san-chien-luoc-quan-ly-chat-dat-hiem-21324.htm
- Ministry of Economy, Trade and Industry, Japan (May 2026). White Paper on Manufacturing Industries 2026 (FY2025 Measures to Promote Core Manufacturing Technologies). https://www.meti.go.jp/english/press/2026/pdf/0529_003a.pdf
- MP Materials (July 2025). MP Materials and Apple Announce $500 Million Partnership to Produce Recycled Rare Earth Magnets in the United States. https://mpmaterials.com/news/mp-materials-and-apple-announce-500-million-partnership-to-produce-recycled-rare-earth-magnets-in-the-united-states
- MP Materials (July 2025). MP Materials Announces Transformational Public-Private Partnership with the Department of Defense to Accelerate U.S. Rare Earth Magnet Independence. https://mpmaterials.com/news/mp-materials-announces-transformational-public-private-partnership-with-the-department-of-defense-to-accelerate-u-s-rare-earth-magnet-independence/
- MP Materials (February 2026). MP Materials Selects Northlake, Texas, as the Site of “10X,” a New U.S. Rare Earth Magnet Manufacturing Campus. https://mpmaterials.com/news/mp-materials-selects-northlake-texas-as-the-site-of-10X-a-new-us-rare-earth-magnet-manufacturing-campus/
- Noritake (December 2025). Development of Silver Paste for TGV Supporting the AI Era. https://www.noritake.co.jp/eng/news/detail/692/
- Shanghai Metals Market (January 2026). Jinmeng Rare Earth’s 4,000 mt/year NdFeB Scrap Recycling Line Starts Trial Run. https://news.metal.com/en/newscontent/103722821-Jinmeng-Rare-Earths-4000-mtyear-NdFeB-Scrap-Recycling-Line-Starts-Trial-Run
- S&P Global (June 2026). Platts Launches Four New FOB China Rare Earth Elements Assessments. https://www.spglobal.com/energy/en/pricing-benchmarks/our-methodology/subscriber-notes/063026-platts-launches-four-new-fob-china-rare-earth-elements-assessments
- Sun Chemical (February 2026). Sun Chemical to showcase extensive electronic materials solutions at LOPEC 2026 in Munich. https://www.sunchemical.com/sun-chemical-to-showcase-extensive-electronic-materials-solutions-at-lopec2026-in-munich/
- TaiyangNews (September 2026). China Solar PV News Snippets, September 9, 2026. https://taiyangnews.info/markets/china-solar-pv-news-snippets-september-9-2026
- TaiyangNews (July 2026). DKEM’s Metallization Solutions For Advanced Cell Technologies & Silver-Lean Requirements. https://taiyangnews.info/technology/dkem-metallization-topcon-hjt-bc-silver-nickel-copper-paste
- U.S. Department of Commerce, International Trade Administration (September 2026). Final Affirmative Determinations in the Antidumping Duty and Countervailing Duty Investigations of Crystalline Silicon Photovoltaic Cells from India, Indonesia, and the Lao People’s Democratic Republic. https://www.trade.gov/final-affirmative-determinations-antidumping-duty-and-countervailing-duty-investigations-0
- U.S. Geological Survey (February 2026). Mineral Commodity Summaries 2026: Rare Earths. https://pubs.usgs.gov/periodicals/mcs2026/mcs2026-rare-earths.pdf
- VACUUMSCHMELZE (July 2026). eVAC Magnetics Holds Opening Ceremony for Sumter, South Carolina Rare-Earth Magnet Manufacturing Facility (Press Release 04/2026). https://vacuumschmelze.com/02_Pressreleases/2026/2026-07-16_Opening%20Ceremony%20Sumter.pdf
- Vietnam Government Portal, VGP News (August 2026). Viet Nam targets to establish 3-5 national materials research centers by 2028. https://en.baochinhphu.vn/viet-nam-targets-to-establish-35-national-materials-research-centers-by-2028-111260814152414476.htm
Table of Content
- Key Takeaways
- Market Size and CAGR
- Top Growth Driver
- Fastest Growing Segment
- Leading Region
- Key Companies
- Emerging Opportunities
- Executive Summary
- Global Market Outlook
- Demand-side Trends
- Supply-side Trends
- Technology Roadmap Analysis
- Analysis and Recommendations
- Analyst Perspective (What is happening? Why now? What should investors know?)
- Key Questions Answered
- How large is the market?
- What is the CAGR?
- What are key trends?
- Which region dominates?
- Who are the leaders?
Read More...
- Market Overview
- Market Coverage / Taxonomy
- Market Definition / Scope / Limitations
- Research Methodology
- Chapter Orientation
- Analytical Lens and Working Hypotheses
- Market Structure, Signals, and Trend Drivers
- Benchmarking and Cross-market Comparability
- Market Sizing, Forecasting, and Opportunity Mapping
- Research Design and Evidence Framework
- Desk Research Programme (Secondary Evidence)
- Expert Input and Fieldwork (Primary Evidence)
- Tooling, Models, and Reference Databases
- Data Engineering and Model Build
- Quality Assurance and Audit Trail
- Market Background
- Market Dynamics (Drivers, Restraints, Opportunity, Trends)
- Scenario Forecast (Optimistic, Likely, Conservative)
- Impact Analysis
- AI Impact
- Sustainability Impact
- Regulatory Impact
- Technology Impact
- Consumer / Buyer Analysis
- Purchase Drivers
- Adoption Barriers
- Buyer Journey
- Opportunity Map Analysis
- Product Life Cycle Analysis
- Supply Chain Analysis
- Investment Feasibility Matrix
- Value Chain Analysis
- PESTLE and Porter's Analysis
- Regulatory Landscape
- Regional Parent Market Outlook
- Production and Consumption Statistics
- Import and Export Statistics
- Global Market Analysis and Forecast, 2021 to 2036
- Historical Market Size Value (USD Million) Analysis, 2021 to 2025
- Current and Future Market Size Value (USD Million) Projections, 2026 to 2036
- Y-o-Y Growth Trend Analysis
- Absolute $ Opportunity Analysis
- Global Market Pricing Analysis, 2021 to 2036
- Global Market Analysis and Forecast, By Product, 2021 to 2036
- Introduction / Key Findings
- Historical Market Size Value (USD Million) Analysis By Product, 2021 to 2025
- Current and Future Market Size Value (USD Million) Analysis and Forecast By Product, 2026 to 2036
- NdPr Oxide
- NdPr Metal and Alloys
- Neodymium Oxide
- Neodymium Metal
- Y-o-Y Growth Trend Analysis By Product, 2021 to 2025
- Absolute $ Opportunity Analysis By Product, 2026 to 2036
- Global Market Analysis and Forecast, By End Use, 2021 to 2036
- Introduction / Key Findings
- Historical Market Size Value (USD Million) Analysis By End Use, 2021 to 2025
- Current and Future Market Size Value (USD Million) Analysis and Forecast By End Use, 2026 to 2036
- Electric Vehicle Motors
- Glass, Ceramics, Catalysts and Other
- Industrial Motors and Automation
- Consumer Electronics
- Appliances and HVAC
- Y-o-Y Growth Trend Analysis By End Use, 2021 to 2025
- Absolute $ Opportunity Analysis By End Use, 2026 to 2036
- Global Market Analysis and Forecast, By Purity, 2021 to 2036
- Introduction / Key Findings
- Historical Market Size Value (USD Million) Analysis By Purity, 2021 to 2025
- Current and Future Market Size Value (USD Million) Analysis and Forecast By Purity, 2026 to 2036
- 99.5 Percent
- 99.9 Percent
- 99 Percent
- 99.99 Percent and Above
- Y-o-Y Growth Trend Analysis By Purity, 2021 to 2025
- Absolute $ Opportunity Analysis By Purity, 2026 to 2036
- Global Market Analysis and Forecast, By Source, 2021 to 2036
- Introduction / Key Findings
- Historical Market Size Value (USD Million) Analysis By Source, 2021 to 2025
- Current and Future Market Size Value (USD Million) Analysis and Forecast By Source, 2026 to 2036
- Bastnaesite-Based Supply
- Ionic Clay Supply
- Monazite-Based Supply
- Recycled Material
- Stockpile and Other Sources
- Y-o-Y Growth Trend Analysis By Source, 2021 to 2025
- Absolute $ Opportunity Analysis By Source, 2026 to 2036
- Global Market Analysis and Forecast, By Region, 2021 to 2036
- Introduction
- Historical Market Size Value (USD Million) Analysis By Region, 2021 to 2025
- Current Market Size Value (USD Million) Analysis and Forecast By Region, 2026 to 2036
- North America
- Latin America
- Western Europe
- Eastern Europe
- East Asia
- South Asia and Pacific
- Middle East and Africa
- Market Attractiveness Analysis By Region
- North America Market Analysis and Forecast, By Country, 2021 to 2036
- Historical Market Size Value (USD Million) Trend Analysis By Market Taxonomy, 2021 to 2025
- Market Size Value (USD Million) Forecast By Market Taxonomy, 2026 to 2036
- By Country
- United States
- Canada
- By Product
- By End Use
- By Purity
- By Source
- By Country
- Market Attractiveness Analysis
- By Country
- By Product
- By End Use
- By Purity
- By Source
- Key Takeaways
- Latin America Market Analysis and Forecast, By Country, 2021 to 2036
- Historical Market Size Value (USD Million) Trend Analysis By Market Taxonomy, 2021 to 2025
- Market Size Value (USD Million) Forecast By Market Taxonomy, 2026 to 2036
- By Country
- Brazil
- Mexico
- Argentina
- Chile
- By Product
- By End Use
- By Purity
- By Source
- By Country
- Market Attractiveness Analysis
- By Country
- By Product
- By End Use
- By Purity
- By Source
- Key Takeaways
- Western Europe Market Analysis and Forecast, By Country, 2021 to 2036
- Historical Market Size Value (USD Million) Trend Analysis By Market Taxonomy, 2021 to 2025
- Market Size Value (USD Million) Forecast By Market Taxonomy, 2026 to 2036
- By Country
- Germany
- France
- United Kingdom
- Italy
- Spain
- Benelux
- Nordics
- By Product
- By End Use
- By Purity
- By Source
- By Country
- Market Attractiveness Analysis
- By Country
- By Product
- By End Use
- By Purity
- By Source
- Key Takeaways
- Eastern Europe Market Analysis and Forecast, By Country, 2021 to 2036
- Historical Market Size Value (USD Million) Trend Analysis By Market Taxonomy, 2021 to 2025
- Market Size Value (USD Million) Forecast By Market Taxonomy, 2026 to 2036
- By Country
- Poland
- Czech Republic
- Romania
- Hungary
- By Product
- By End Use
- By Purity
- By Source
- By Country
- Market Attractiveness Analysis
- By Country
- By Product
- By End Use
- By Purity
- By Source
- Key Takeaways
- East Asia Market Analysis and Forecast, By Country, 2021 to 2036
- Historical Market Size Value (USD Million) Trend Analysis By Market Taxonomy, 2021 to 2025
- Market Size Value (USD Million) Forecast By Market Taxonomy, 2026 to 2036
- By Country
- China
- Japan
- South Korea
- By Product
- By End Use
- By Purity
- By Source
- By Country
- Market Attractiveness Analysis
- By Country
- By Product
- By End Use
- By Purity
- By Source
- Key Takeaways
- South Asia and Pacific Market Analysis and Forecast, By Country, 2021 to 2036
- Historical Market Size Value (USD Million) Trend Analysis By Market Taxonomy, 2021 to 2025
- Market Size Value (USD Million) Forecast By Market Taxonomy, 2026 to 2036
- By Country
- India
- ASEAN
- Australia and New Zealand
- By Product
- By End Use
- By Purity
- By Source
- By Country
- Market Attractiveness Analysis
- By Country
- By Product
- By End Use
- By Purity
- By Source
- Key Takeaways
- Middle East and Africa Market Analysis and Forecast, By Country, 2021 to 2036
- Historical Market Size Value (USD Million) Trend Analysis By Market Taxonomy, 2021 to 2025
- Market Size Value (USD Million) Forecast By Market Taxonomy, 2026 to 2036
- By Country
- GCC Countries
- South Africa
- Türkiye
- Israel
- By Product
- By End Use
- By Purity
- By Source
- By Country
- Market Attractiveness Analysis
- By Country
- By Product
- By End Use
- By Purity
- By Source
- Key Takeaways
- Key Countries Market Analysis
- United States
- Pricing Analysis
- Market Share Analysis, 2025
- By Product
- By End Use
- By Purity
- By Source
- Canada
- Pricing Analysis
- Market Share Analysis, 2025
- By Product
- By End Use
- By Purity
- By Source
- Brazil
- Pricing Analysis
- Market Share Analysis, 2025
- By Product
- By End Use
- By Purity
- By Source
- Mexico
- Pricing Analysis
- Market Share Analysis, 2025
- By Product
- By End Use
- By Purity
- By Source
- Argentina
- Pricing Analysis
- Market Share Analysis, 2025
- By Product
- By End Use
- By Purity
- By Source
- Chile
- Pricing Analysis
- Market Share Analysis, 2025
- By Product
- By End Use
- By Purity
- By Source
- Germany
- Pricing Analysis
- Market Share Analysis, 2025
- By Product
- By End Use
- By Purity
- By Source
- France
- Pricing Analysis
- Market Share Analysis, 2025
- By Product
- By End Use
- By Purity
- By Source
- United Kingdom
- Pricing Analysis
- Market Share Analysis, 2025
- By Product
- By End Use
- By Purity
- By Source
- Italy
- Pricing Analysis
- Market Share Analysis, 2025
- By Product
- By End Use
- By Purity
- By Source
- Spain
- Pricing Analysis
- Market Share Analysis, 2025
- By Product
- By End Use
- By Purity
- By Source
- Benelux
- Pricing Analysis
- Market Share Analysis, 2025
- By Product
- By End Use
- By Purity
- By Source
- Nordics
- Pricing Analysis
- Market Share Analysis, 2025
- By Product
- By End Use
- By Purity
- By Source
- Poland
- Pricing Analysis
- Market Share Analysis, 2025
- By Product
- By End Use
- By Purity
- By Source
- Czech Republic
- Pricing Analysis
- Market Share Analysis, 2025
- By Product
- By End Use
- By Purity
- By Source
- Romania
- Pricing Analysis
- Market Share Analysis, 2025
- By Product
- By End Use
- By Purity
- By Source
- Hungary
- Pricing Analysis
- Market Share Analysis, 2025
- By Product
- By End Use
- By Purity
- By Source
- China
- Pricing Analysis
- Market Share Analysis, 2025
- By Product
- By End Use
- By Purity
- By Source
- Japan
- Pricing Analysis
- Market Share Analysis, 2025
- By Product
- By End Use
- By Purity
- By Source
- South Korea
- Pricing Analysis
- Market Share Analysis, 2025
- By Product
- By End Use
- By Purity
- By Source
- India
- Pricing Analysis
- Market Share Analysis, 2025
- By Product
- By End Use
- By Purity
- By Source
- ASEAN
- Pricing Analysis
- Market Share Analysis, 2025
- By Product
- By End Use
- By Purity
- By Source
- Australia and New Zealand
- Pricing Analysis
- Market Share Analysis, 2025
- By Product
- By End Use
- By Purity
- By Source
- GCC Countries
- Pricing Analysis
- Market Share Analysis, 2025
- By Product
- By End Use
- By Purity
- By Source
- South Africa
- Pricing Analysis
- Market Share Analysis, 2025
- By Product
- By End Use
- By Purity
- By Source
- Türkiye
- Pricing Analysis
- Market Share Analysis, 2025
- By Product
- By End Use
- By Purity
- By Source
- Israel
- Pricing Analysis
- Market Share Analysis, 2025
- By Product
- By End Use
- By Purity
- By Source
- United States
- Market Structure Analysis
- Competition Dashboard
- Competition Benchmarking
- Market Share Analysis of Top Players
- By Region
- By Product
- By End Use
- By Purity
- By Source
- Emerging Startups
- Innovation Benchmarking
- Competition Analysis
- Competition Deep Dive
- China Northern Rare Earth Group
- Overview
- Product Portfolio
- Profitability by Market Segments
- Sales Footprint
- Strategy Overview
- Marketing Strategy
- Product Strategy
- Channel Strategy
- China Rare Earth Group
- Shenghe Resources
- Lynas Rare Earths
- MP Materials
- Energy Fuels
- Neo Performance Materials
- Solvay
- China Northern Rare Earth Group
- Case Studies
- Success Stories
- Recent Developments
- Competition Deep Dive
- Assumptions & Acronyms Used
List of Tables
- Table 1: Global Market Value (USD Million) Forecast by Region, 2021 to 2036
- Table 2: Global Market Value (USD Million) Forecast by Product, 2021 to 2036
- Table 3: Global Market Value (USD Million) Forecast by End Use, 2021 to 2036
- Table 4: Global Market Value (USD Million) Forecast by Purity, 2021 to 2036
- Table 5: Global Market Value (USD Million) Forecast by Source, 2021 to 2036
- Table 6: North America Market Value (USD Million) Forecast by Country, 2021 to 2036
- Table 7: North America Market Value (USD Million) Forecast by Product, 2021 to 2036
- Table 8: North America Market Value (USD Million) Forecast by End Use, 2021 to 2036
- Table 9: North America Market Value (USD Million) Forecast by Purity, 2021 to 2036
- Table 10: North America Market Value (USD Million) Forecast by Source, 2021 to 2036
- Table 11: Latin America Market Value (USD Million) Forecast by Country, 2021 to 2036
- Table 12: Latin America Market Value (USD Million) Forecast by Product, 2021 to 2036
- Table 13: Latin America Market Value (USD Million) Forecast by End Use, 2021 to 2036
- Table 14: Latin America Market Value (USD Million) Forecast by Purity, 2021 to 2036
- Table 15: Latin America Market Value (USD Million) Forecast by Source, 2021 to 2036
- Table 16: Western Europe Market Value (USD Million) Forecast by Country, 2021 to 2036
- Table 17: Western Europe Market Value (USD Million) Forecast by Product, 2021 to 2036
- Table 18: Western Europe Market Value (USD Million) Forecast by End Use, 2021 to 2036
- Table 19: Western Europe Market Value (USD Million) Forecast by Purity, 2021 to 2036
- Table 20: Western Europe Market Value (USD Million) Forecast by Source, 2021 to 2036
- Table 21: Eastern Europe Market Value (USD Million) Forecast by Country, 2021 to 2036
- Table 22: Eastern Europe Market Value (USD Million) Forecast by Product, 2021 to 2036
- Table 23: Eastern Europe Market Value (USD Million) Forecast by End Use, 2021 to 2036
- Table 24: Eastern Europe Market Value (USD Million) Forecast by Purity, 2021 to 2036
- Table 25: Eastern Europe Market Value (USD Million) Forecast by Source, 2021 to 2036
- Table 26: East Asia Market Value (USD Million) Forecast by Country, 2021 to 2036
- Table 27: East Asia Market Value (USD Million) Forecast by Product, 2021 to 2036
- Table 28: East Asia Market Value (USD Million) Forecast by End Use, 2021 to 2036
- Table 29: East Asia Market Value (USD Million) Forecast by Purity, 2021 to 2036
- Table 30: East Asia Market Value (USD Million) Forecast by Source, 2021 to 2036
- Table 31: South Asia and Pacific Market Value (USD Million) Forecast by Country, 2021 to 2036
- Table 32: South Asia and Pacific Market Value (USD Million) Forecast by Product, 2021 to 2036
- Table 33: South Asia and Pacific Market Value (USD Million) Forecast by End Use, 2021 to 2036
- Table 34: South Asia and Pacific Market Value (USD Million) Forecast by Purity, 2021 to 2036
- Table 35: South Asia and Pacific Market Value (USD Million) Forecast by Source, 2021 to 2036
- Table 36: Middle East and Africa Market Value (USD Million) Forecast by Country, 2021 to 2036
- Table 37: Middle East and Africa Market Value (USD Million) Forecast by Product, 2021 to 2036
- Table 38: Middle East and Africa Market Value (USD Million) Forecast by End Use, 2021 to 2036
- Table 39: Middle East and Africa Market Value (USD Million) Forecast by Purity, 2021 to 2036
- Table 40: Middle East and Africa Market Value (USD Million) Forecast by Source, 2021 to 2036
List of Figures
- Figure 1: Global Market Pricing Analysis
- Figure 2: Global Market Value (USD Million) Forecast 2021-2036
- Figure 3: Global Market Value Share and BPS Analysis by Product, 2026 and 2036
- Figure 4: Global Market Y-o-Y Growth Comparison by Product, 2026-2036
- Figure 5: Global Market Attractiveness Analysis by Product
- Figure 6: Global Market Value Share and BPS Analysis by End Use, 2026 and 2036
- Figure 7: Global Market Y-o-Y Growth Comparison by End Use, 2026-2036
- Figure 8: Global Market Attractiveness Analysis by End Use
- Figure 9: Global Market Value Share and BPS Analysis by Purity, 2026 and 2036
- Figure 10: Global Market Y-o-Y Growth Comparison by Purity, 2026-2036
- Figure 11: Global Market Attractiveness Analysis by Purity
- Figure 12: Global Market Value Share and BPS Analysis by Source, 2026 and 2036
- Figure 13: Global Market Y-o-Y Growth Comparison by Source, 2026-2036
- Figure 14: Global Market Attractiveness Analysis by Source
- Figure 15: Global Market Value (USD Million) Share and BPS Analysis by Region, 2026 and 2036
- Figure 16: Global Market Y-o-Y Growth Comparison by Region, 2026-2036
- Figure 17: Global Market Attractiveness Analysis by Region
- Figure 18: North America Market Incremental Dollar Opportunity, 2026-2036
- Figure 19: Latin America Market Incremental Dollar Opportunity, 2026-2036
- Figure 20: Western Europe Market Incremental Dollar Opportunity, 2026-2036
- Figure 21: Eastern Europe Market Incremental Dollar Opportunity, 2026-2036
- Figure 22: East Asia Market Incremental Dollar Opportunity, 2026-2036
- Figure 23: South Asia and Pacific Market Incremental Dollar Opportunity, 2026-2036
- Figure 24: Middle East and Africa Market Incremental Dollar Opportunity, 2026-2036
- Figure 25: North America Market Value Share and BPS Analysis by Country, 2026 and 2036
- Figure 26: North America Market Value Share and BPS Analysis by Product, 2026 and 2036
- Figure 27: North America Market Y-o-Y Growth Comparison by Product, 2026-2036
- Figure 28: North America Market Attractiveness Analysis by Product
- Figure 29: North America Market Value Share and BPS Analysis by End Use, 2026 and 2036
- Figure 30: North America Market Y-o-Y Growth Comparison by End Use, 2026-2036
- Figure 31: North America Market Attractiveness Analysis by End Use
- Figure 32: North America Market Value Share and BPS Analysis by Purity, 2026 and 2036
- Figure 33: North America Market Y-o-Y Growth Comparison by Purity, 2026-2036
- Figure 34: North America Market Attractiveness Analysis by Purity
- Figure 35: North America Market Value Share and BPS Analysis by Source, 2026 and 2036
- Figure 36: North America Market Y-o-Y Growth Comparison by Source, 2026-2036
- Figure 37: North America Market Attractiveness Analysis by Source
- Figure 38: Latin America Market Value Share and BPS Analysis by Country, 2026 and 2036
- Figure 39: Latin America Market Value Share and BPS Analysis by Product, 2026 and 2036
- Figure 40: Latin America Market Y-o-Y Growth Comparison by Product, 2026-2036
- Figure 41: Latin America Market Attractiveness Analysis by Product
- Figure 42: Latin America Market Value Share and BPS Analysis by End Use, 2026 and 2036
- Figure 43: Latin America Market Y-o-Y Growth Comparison by End Use, 2026-2036
- Figure 44: Latin America Market Attractiveness Analysis by End Use
- Figure 45: Latin America Market Value Share and BPS Analysis by Purity, 2026 and 2036
- Figure 46: Latin America Market Y-o-Y Growth Comparison by Purity, 2026-2036
- Figure 47: Latin America Market Attractiveness Analysis by Purity
- Figure 48: Latin America Market Value Share and BPS Analysis by Source, 2026 and 2036
- Figure 49: Latin America Market Y-o-Y Growth Comparison by Source, 2026-2036
- Figure 50: Latin America Market Attractiveness Analysis by Source
- Figure 51: Western Europe Market Value Share and BPS Analysis by Country, 2026 and 2036
- Figure 52: Western Europe Market Value Share and BPS Analysis by Product, 2026 and 2036
- Figure 53: Western Europe Market Y-o-Y Growth Comparison by Product, 2026-2036
- Figure 54: Western Europe Market Attractiveness Analysis by Product
- Figure 55: Western Europe Market Value Share and BPS Analysis by End Use, 2026 and 2036
- Figure 56: Western Europe Market Y-o-Y Growth Comparison by End Use, 2026-2036
- Figure 57: Western Europe Market Attractiveness Analysis by End Use
- Figure 58: Western Europe Market Value Share and BPS Analysis by Purity, 2026 and 2036
- Figure 59: Western Europe Market Y-o-Y Growth Comparison by Purity, 2026-2036
- Figure 60: Western Europe Market Attractiveness Analysis by Purity
- Figure 61: Western Europe Market Value Share and BPS Analysis by Source, 2026 and 2036
- Figure 62: Western Europe Market Y-o-Y Growth Comparison by Source, 2026-2036
- Figure 63: Western Europe Market Attractiveness Analysis by Source
- Figure 64: Eastern Europe Market Value Share and BPS Analysis by Country, 2026 and 2036
- Figure 65: Eastern Europe Market Value Share and BPS Analysis by Product, 2026 and 2036
- Figure 66: Eastern Europe Market Y-o-Y Growth Comparison by Product, 2026-2036
- Figure 67: Eastern Europe Market Attractiveness Analysis by Product
- Figure 68: Eastern Europe Market Value Share and BPS Analysis by End Use, 2026 and 2036
- Figure 69: Eastern Europe Market Y-o-Y Growth Comparison by End Use, 2026-2036
- Figure 70: Eastern Europe Market Attractiveness Analysis by End Use
- Figure 71: Eastern Europe Market Value Share and BPS Analysis by Purity, 2026 and 2036
- Figure 72: Eastern Europe Market Y-o-Y Growth Comparison by Purity, 2026-2036
- Figure 73: Eastern Europe Market Attractiveness Analysis by Purity
- Figure 74: Eastern Europe Market Value Share and BPS Analysis by Source, 2026 and 2036
- Figure 75: Eastern Europe Market Y-o-Y Growth Comparison by Source, 2026-2036
- Figure 76: Eastern Europe Market Attractiveness Analysis by Source
- Figure 77: East Asia Market Value Share and BPS Analysis by Country, 2026 and 2036
- Figure 78: East Asia Market Value Share and BPS Analysis by Product, 2026 and 2036
- Figure 79: East Asia Market Y-o-Y Growth Comparison by Product, 2026-2036
- Figure 80: East Asia Market Attractiveness Analysis by Product
- Figure 81: East Asia Market Value Share and BPS Analysis by End Use, 2026 and 2036
- Figure 82: East Asia Market Y-o-Y Growth Comparison by End Use, 2026-2036
- Figure 83: East Asia Market Attractiveness Analysis by End Use
- Figure 84: East Asia Market Value Share and BPS Analysis by Purity, 2026 and 2036
- Figure 85: East Asia Market Y-o-Y Growth Comparison by Purity, 2026-2036
- Figure 86: East Asia Market Attractiveness Analysis by Purity
- Figure 87: East Asia Market Value Share and BPS Analysis by Source, 2026 and 2036
- Figure 88: East Asia Market Y-o-Y Growth Comparison by Source, 2026-2036
- Figure 89: East Asia Market Attractiveness Analysis by Source
- Figure 90: South Asia and Pacific Market Value Share and BPS Analysis by Country, 2026 and 2036
- Figure 91: South Asia and Pacific Market Value Share and BPS Analysis by Product, 2026 and 2036
- Figure 92: South Asia and Pacific Market Y-o-Y Growth Comparison by Product, 2026-2036
- Figure 93: South Asia and Pacific Market Attractiveness Analysis by Product
- Figure 94: South Asia and Pacific Market Value Share and BPS Analysis by End Use, 2026 and 2036
- Figure 95: South Asia and Pacific Market Y-o-Y Growth Comparison by End Use, 2026-2036
- Figure 96: South Asia and Pacific Market Attractiveness Analysis by End Use
- Figure 97: South Asia and Pacific Market Value Share and BPS Analysis by Purity, 2026 and 2036
- Figure 98: South Asia and Pacific Market Y-o-Y Growth Comparison by Purity, 2026-2036
- Figure 99: South Asia and Pacific Market Attractiveness Analysis by Purity
- Figure 100: South Asia and Pacific Market Value Share and BPS Analysis by Source, 2026 and 2036
- Figure 101: South Asia and Pacific Market Y-o-Y Growth Comparison by Source, 2026-2036
- Figure 102: South Asia and Pacific Market Attractiveness Analysis by Source
- Figure 103: Middle East and Africa Market Value Share and BPS Analysis by Country, 2026 and 2036
- Figure 104: Middle East and Africa Market Value Share and BPS Analysis by Product, 2026 and 2036
- Figure 105: Middle East and Africa Market Y-o-Y Growth Comparison by Product, 2026-2036
- Figure 106: Middle East and Africa Market Attractiveness Analysis by Product
- Figure 107: Middle East and Africa Market Value Share and BPS Analysis by End Use, 2026 and 2036
- Figure 108: Middle East and Africa Market Y-o-Y Growth Comparison by End Use, 2026-2036
- Figure 109: Middle East and Africa Market Attractiveness Analysis by End Use
- Figure 110: Middle East and Africa Market Value Share and BPS Analysis by Purity, 2026 and 2036
- Figure 111: Middle East and Africa Market Y-o-Y Growth Comparison by Purity, 2026-2036
- Figure 112: Middle East and Africa Market Attractiveness Analysis by Purity
- Figure 113: Middle East and Africa Market Value Share and BPS Analysis by Source, 2026 and 2036
- Figure 114: Middle East and Africa Market Y-o-Y Growth Comparison by Source, 2026-2036
- Figure 115: Middle East and Africa Market Attractiveness Analysis by Source
- Figure 116: Global Market - Tier Structure Analysis
- Figure 117: Global Market - Company Share Analysis
Frequently Asked Questions
How big is the Neodymium Market in 2026?
Future Market Insights estimates the global neodymium market at USD 6.5 billion in 2026, projected to reach USD 14.0 billion by 2036.
How fast is the Neodymium Market expected to grow through 2036?
FMI projects an 8.0% CAGR from 2026 to 2036, taking the global market from USD 6.5 billion in 2026 to USD 14.0 billion by 2036.
Which product segment leads the Neodymium Market?
NdPr oxide leads the product segment with a 58.0% share in 2026, supported by its established use as a feedstock for neodymium metal and alloy conversion.
Which end-use segment leads the Neodymium Market?
Electric vehicle motors account for the largest end-use share at 31.2% in 2026, driven by traction motor requirements for consistent magnet chemistry and reliable long-term material supply.
Which countries are expected to grow fastest in the Neodymium Market?
The United States is projected to record the fastest growth at a 12.0% CAGR from 2026 to 2036, followed by Vietnam at 10.0% over the same period.
Which companies are profiled in the Neodymium Market?
The key companies profiled in the neodymium market include China Northern Rare Earth Group, China Rare Earth Group, Shenghe Resources, Lynas Rare Earths, MP Materials, Neo Performance Materials, Solvay, and Energy Fuels. Their market activities span resource development, rare earth separation, material conversion, and specialty materials.
Preview the report firsthand - request a free sample
Get SampleGet the brochure for pricing and purchase details.
Get PDF
