Nicotinic Acid Market Size and Share Forecast Outlook 2025 to 2035

The global nicotinic acid market is projected to grow from USD 362.4 million in 2025 to USD 601.7 million by 2035, registering a CAGR of 5.2%.
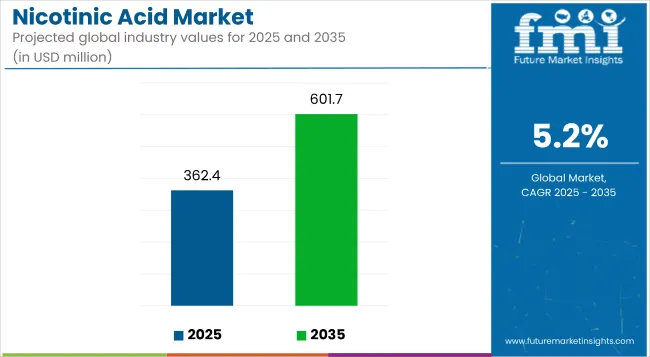
Quick Stats for Nicotinic Acid Market

  • Market Value (2025): USD 362.4 million
  • Forecast Value (2035): 601.7 million
  • Forecast CAGR: 5.2%
  • Source Leader in 2025: Synthetic (55% market share)
  • Top Form Segment: Powder (45% share)
  • Key Growth Region: East Asia (Japan is the fastest-growing market with a 4.9% CAGR)

Nicotinic Acid Market

Metric Value
Industry Size (2025E) USD 362.4 million
Industry Value (2035F) USD 601.7 million
CAGR (2025 to 2035) 5.2%

This growth is driven by rising awareness of vitamin B3 (niacin) benefits in managing metabolic disorders, skin health, and nervous system regulation. Increased consumption of functional foods, fortified beverages, and dietary supplements featuring nicotinic acid and nicotinamide is accelerating market uptake. Additionally, the pharmaceutical industry's rising use of nicotinic derivatives in anti-inflammatory and cardiovascular applications contributes to the expanding demand.

The market holds an 8.4% share, largely through niacin-based supplements. In the pharmaceutical ingredients market, the share is around 3.2%, due to use in lipid-lowering formulations and skin therapies. Within the personal care ingredients market, the share remains modest at 1.5%, primarily in anti-aging creams. In the fortified food and beverage segment, nicotinic compounds contribute about 2.6%, especially in energy drinks, cereals, and protein bars.

Government and health regulations play a critical role in shaping the market. The USA FDA, EFSA, and FSSAI set fortification limits and health claim regulations for niacin in supplements and foods. In India, the Prevention of Food Adulteration Act and guidelines from ICMR ensure controlled usage in functional food products. These regulatory frameworks encourage safe and effective nicotinic usage in both pharmaceuticals and consumer health products, supporting long-term market growth.

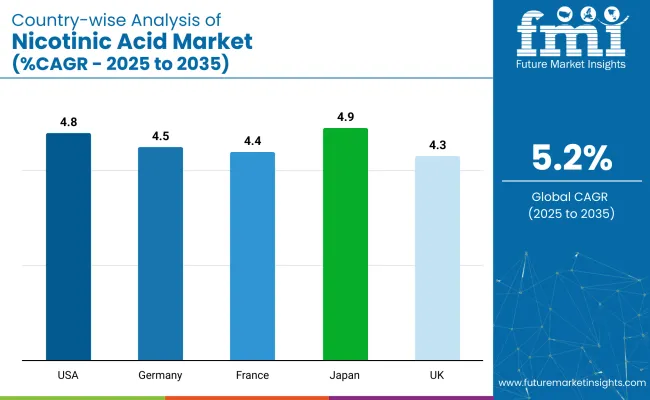
Japan is projected to be the fastest-growing market, expected to expandat a CAGR of 4.9% from 2025 to 2035. Synthetic will lead the source segment with a 55% share, while powder will dominate the form segment with a 45% share. The USA and Germany are also expected to grow steadily at CAGRs of 4.8% and 4.5%, respectively.

Nicotinic Acid Market Analysis by Top Investment Segments

The market is segmented by form, grade, source, end-use industry, and region. By form, the market is divided into powder, liquid, and tablets/capsules. In terms of grade, the market is classified into feed grade, food grade, and pharmaceutical grade. Based on source, the market is bifurcated into natural and synthetic.

By the end-use industry, the market is segmented into dietary supplements, functional foods &beverages, infant food, animal feed, personal care, pharmaceuticals, and others (sports nutrition blends, veterinary health tonics, senior wellness formulas, and functional confectionery).

Regionally, the market is classified into North America, Latin America, Western Europe, Eastern Europe, Balkans & Baltic, Russia & Belarus, Central Asia, East Asia, South Asia & Pacific, and the Middle East & Africa.

Powder to Lead the Form Segment with 45% Market Share in 2025

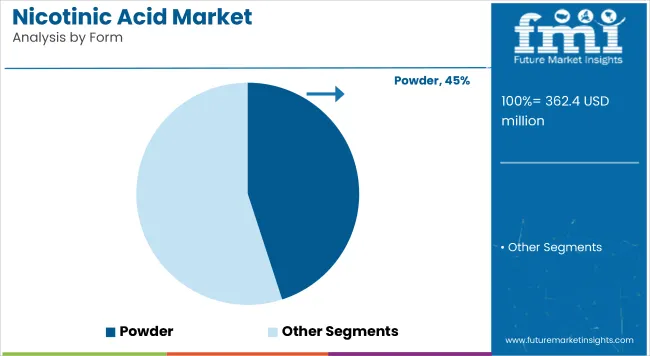
Powderis projected to hold the highest market share among all forms, accounting for 45% of global demand in 2025. This form is widely used in supplements, functional beverages, and pharmaceutical blends due to its compatibility, long shelf life, and ease of transportation. Its granular nature also makes it ideal for bulk packaging and efficient downstream formulation.
  • Powder form allows convenient blending into capsules, tablets, and drink powders.
  • Preferred for its high stability and lower storage cost in B2B production.
  • Common across multivitamin formulations and clinical niacin supplements.

Nicotinic Acid Market By Form

Pharmaceutical Grade to Capture the Grade Segment with 40% Market Share

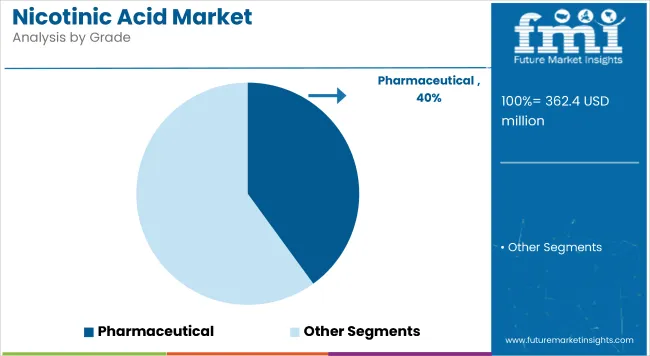
Pharmaceuticalgrade is projected to leadthe grade segment in 2025, capturing a 40% market share globally. Its dominance stems from extensive use in treating hypercholesterolemia, niacin deficiency, and neurodegenerative disorders. High purity and regulatory compliance also favor this grade across prescription-based channels.
  • Used in statin alternatives and blood lipid regulators.
  • Meets pharmacopeial quality standards (USP, EP).
  • Preferred by hospitals, clinics, and OTC pharma brands.

Nicotinic Acid Market By Grade

Synthetic to Lead the Source Segment with 55% Share in 2025

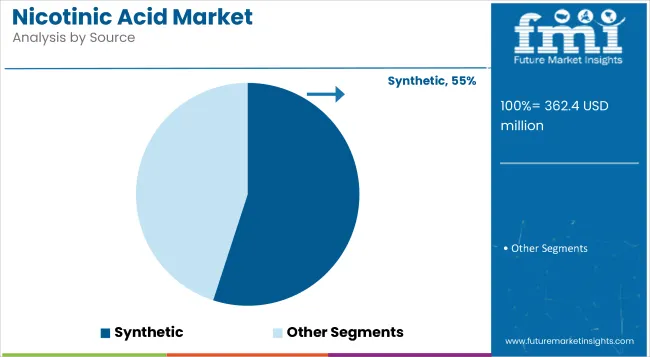
Synthetic is expected to dominate the source category, capturinga 55% global market share in 2025. The growth is driven by its cost efficiency, batch-to-batch consistency, and high scalability. Its purity and processing speed make it ideal for contract manufacturing and fortified food applications.
  • Scalable production and regulatory clarity support synthetic dominance.
  • Used heavily in food fortification and commercial supplements.
  • Reliable sourcing ensures consistent supply to global brands.

Nicotinic Acid Market By Source

Dietary Supplements to Dominate the End-use Industry with 38% Share in 2025

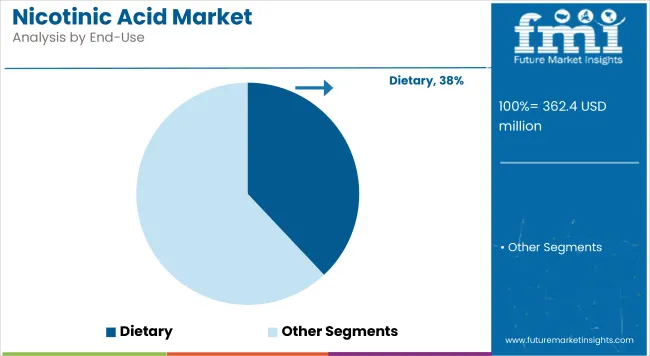
Dietary supplements are projected to remain the leading end-use industry, holding a 38% share of the global market in 2025. Rising awareness about vitamin B3’s role in energy metabolism, skin care, and heart health has made niacin a staple in both standalone supplements and complex multivitamin products.
  • Strong growth in direct-to-consumer nutraceutical channels.
  • Adopted in immunity blends, anti-aging formulations, and energy packs.
  • Supported by health campaigns promoting preventive wellness.

Nicotinic Acid Market By End Use

Top Nicotinic Acid Market Dynamics

The global nicotinic acid market is experiencing steady growth, driven by increasing awareness around preventive health, skin nourishment, and energy metabolism. Nicotinic acid (niacin) plays a vital role in cardiovascular support and neurological health, making it a key ingredient across supplements, fortified foods, and pharmaceutical formulations. Expanding use in the beauty and personal care industry also adds to its demand.

Recent Trends in the Nicotinic Acid Market

  • The integration of nicotinamide and niacinamide in cosmeceuticals is expanding rapidly due to their anti-aging, anti-inflammatory, and brightening properties.
  • The rise of clean-label and plant-based nutraceuticals is encouraging innovation in naturally sourced nicotinic acid alternatives.
  • Increasing adoption of sustained-release niacin formulations in pharma for better lipid control and reduced side effects is gaining popularity in clinical settings.

Challenges in the Nicotinic Acid Market
  • Flushing and skin irritation associated with high-dose nicotinic acid supplements hinder acceptance in some consumer segments.
  • Strict dosage regulation by bodies such as the FDA, EFSA, and FSSAI limit formulation flexibility, impacting product development timelines.
  • Price volatility in raw materials, especially from fermentation-based production routes, creates cost unpredictability for smaller players.

Top Countries Manufacturing, Regulating, and Driving Demand for Nicotinic Acid

Country Wise Analysis Of Nicotinic Acid Market

Japan’s momentum in the nicotinic acid market is driven by functional foods, clinical-grade skincare, and therapeutic vitamins. Germany and France maintain strong demand due to pharmaceutical-grade niacin usage and EU-backed wellness campaigns. The USA, UK, and Japan are growing at a steady 0.97-1.00x of the global CAGR of 4.9%.

The nicotinic acid market is expected to expandat most rapidly in Japan, growing at 4.9% CAGR from 2025 to 2035, followed by Germany (4.5%), France (4.4%), USA (4.8%), and UK (4.3%). Japan leads due to ultra-premium skincare formulations and advanced supplement formats. Western countries focus on regulated therapeutic dosing and preventive healthcare programs.

The report covers an in-depth analysis of 40+ countries; five top-performing OECD countries are highlighted below.

In-depth Analysis of Nicotinic Acid Demand in Japan

The Japan nicotinic acid market is projected to grow at a CAGR of 4.9% from 2025 to 2035.Growth is driven by innovations in dermaceuticals, nutricosmetics, and functional beverages. The popularity of niacinamide-based skin brightening serums and oral beauty supplements drives strong demand in urban centers.

  • High demand in beauty drinks, anti-aging skincare, and OTC vitamins.
  • Regulatory alignment supports clean-label and therapeutic-grade niacin.

Growth Outlook for Nicotinic Acid in Germany

The Germany nicotinic acid revenueis expected to expandat a CAGR of 4.5% during the forecast period.Pharmaceutical-grade nicotinic acid is widely used for cholesterol control and neuropathy. EU compliance for supplement labeling and purity enhances trust. Germany also sees rising use of niacinamide in organic-certified skincare and clean nutrition.

  • Emphasis on lipid-lowering therapies and fortified multivitamins.
  • Clean beauty trend strengthens demand in skincare sector.

Industrial Nicotinic Acid Demand in France

The Frenchnicotinic acid market is growing at a CAGR of 4.4% from 2025 to 2035.France focuses on wellness and clinical nutrition, with niacin supplementation increasingly common among seniors and women.

  • Dermocosmetic R&D accelerating niacinamide integration.
  • Preventive care fuels steady pharmaceutical demand.

Demand Trajectory for Nicotinic Acid in the USA

The demand for nicotinic acid in the USA is projected to grow at a CAGR of 4.8%.Clinical-grade extended-release niacin is widely used for hyperlipidemia, with demand supported by rising obesity and metabolic disorder rates.

  • High use in cardiovascular support supplements.
  • Fast adoption of plant-based niacin in clean-label health products.

Nicotinic Acid Trends in UK

The UK nicotinic acid revenueis forecast to grow at a CAGR of 4.3% between 2025 and 2035. Usage is centered on nutritional support, cosmetic formulations, and preventive healthcare. The National Health Service (NHS) supports nicotinic supplementation for pregnancy and postnatal care.
  • Strong interest in women's health and dermatology.
  • Pharmacy chains dominate supplement sales channel.

Leading Nicotinic Acid Suppliers and Manufacturers

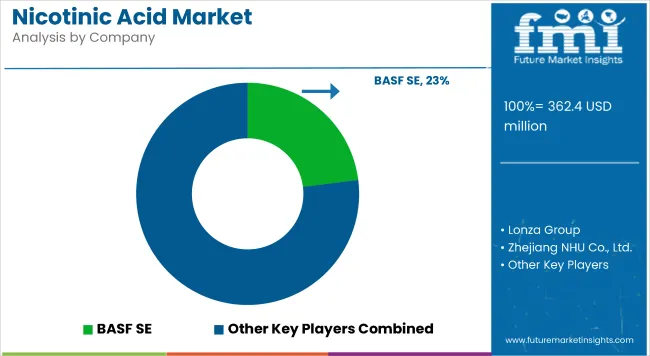
Nicotinic Acid Market By Company

The market is moderately consolidated, with key players including Lonza Group, BASF SE, Zhejiang NHU Co., Ltd., Vertellus Holdings LLC, and Brother Enterprises leading the supply chain. These companies focus on high-purity niacin (nicotinic acid) and niacinamide production for use in pharmaceuticals, personal care, and dietary supplements.

Lonza Group is known for pharmaceutical-grade nicotinic acid production, catering to clinical therapies. BASF SE offers a wide vitamin portfolio including niacinamide for food fortification and personal care. Zhejiang NHU Co., Ltd. and Brother Enterprises lead in large-scale industrial synthesis of niacin for fortified foods and feed additives. Vertellus specializes in customized niacinamide derivatives for cosmetics and functional beverages.

Recent Nicotinic Acid Industry News

  • In May 2025, BASF SE finalized the acquisition of DOMO Chemicals’ 49% share in the Alsachimie joint venture, becoming the sole owner of the production entity for essential polyamide 6.6 precursors in Chalampé, France.
  • In January 2025, Jubilant Ingrevia commissioned a new cGMP facility for Niacinamide production, featuring high bio-content to cater to global leaders in food, nutrition, and cosmetics.

Nicotinic Acid Market Report Scope

Report Attributes Details
Market Size (2025) USD 362.4 million
Projected Market Size (2035) USD 601.7 million
CAGR (2025 to 2035) 5.2%
Base Year for Estimation 2024
Historical Period 2020 to 2024
Projections Period 2025 to 2035
Report Parameter USD million for value/Volume in metric tons
Form Analyzed Powder, Liquid, and Tablets/Capsules
Grade Analyzed Feed Grade, Food Grade, and Pharmaceutical Grade
Source Analyzed Natural and Synthetic
End-use Industry Analyzed Dietary Supplements, Functional Foods & Beverages, Infant Food, Animal Feed, Personal Care, Pharmaceuticals, and Others (Sports Nutrition Blends, Veterinary Health Tonics, Senior Wellness Formulas, a nd Functional Confectioner y)
Regions Covered North America, Latin America, Western Europe, Eastern Europe, Balkans & Baltic, Russia & Belarus, Central Asia, East Asia, South Asia & Pacific, Middle East & Africa
Countries Covered United States, United Kingdom, Germany, France, Japan, China, India, Brazil, South Korea, Australia
Key Players Influencing the Market Graham Chemical, Glanbia plc, Lonza Group AG, Jubilant Life Sciences Ltd., NutraScience Labs, DSM, BASF SE, Western Drugs Ltd., Spectrum Chemical Mfg. Corp, Fengchen Group Co., Ltd
Additional Attributes Dollar sales by form and grade, share by source, regional demand growth, regulatory influence, pharmaceutical adoption trends, competitive benchmarking

Key Segments

By Form:

As per form, the industry has been categorized into Powder, Liquid, and Tablets/Capsules.

By Grade:

This segment is further categorized into Feed Grade, Food Grade, and Pharmaceutical Grade.

By Source:

This segment is further categorized into Natural and Synthetic.

By End-use Industry:

This segment is further categorized into Dietary Supplements, Functional Foods and Beverages, Infant Food, Animal Feed, Personal Care, Pharmaceuticals, and Others.

By Region:

Industry analysis has been carried out in key countries of North America, Latin America, Western Europe, Eastern Europe, Balkans & Baltic, Russia & Belarus, Central Asia, East Asia, South Asia & Pacific, and the Middle East & Africa.

Table of Content

  1. Executive Summary
    • Global Market Outlook
    • Demand-side Trends
    • Supply-side Trends
    • Technology Roadmap Analysis
    • Analysis and Recommendations
  2. Market Overview
    • Market Coverage / Taxonomy
    • Market Definition / Scope / Limitations
  3. Market Background
    • Market Dynamics
      • Drivers
      • Restraints
      • Opportunity
      • Trends
    • Scenario Forecast
      • Demand in Optimistic Scenario
      • Demand in Likely Scenario
      • Demand in Conservative Scenario
    • Opportunity Map Analysis
    • Product Life Cycle Analysis
    • Supply Chain Analysis
      • Supply Side Participants and their Roles
        • Producers
        • Mid-Level Participants (Traders/ Agents/ Brokers)
        • Wholesalers and Distributors
      • Value Added and Value Created at Node in the Supply Chain
      • List of Raw Material Suppliers
      • List of Existing and Potential Buyer’s
    • Investment Feasibility Matrix
    • Value Chain Analysis
      • Profit Margin Analysis
      • Wholesalers and Distributors
      • Retailers
    • PESTLE and Porter’s Analysis
    • Regulatory Landscape
      • By Key Regions
      • By Key Countries
    • Regional Parent Market Outlook
    • Production and Consumption Statistics
    • Import and Export Statistics
  4. Global Market Analysis 2020 to 2024 and Forecast, 2025 to 2035
    • Historical Market Size Value (USD Million) & Volume (Metric Tons) Analysis, 2020 to 2024
    • Current and Future Market Size Value (USD Million) & Volume (Metric Tons) Projections, 2025 to 2035
      • Y-o-Y Growth Trend Analysis
      • Absolute $ Opportunity Analysis
  5. Global Market Pricing Analysis 2020 to 2024 and Forecast 2025 to 2035
  6. Global Market Analysis 2020 to 2024 and Forecast 2025 to 2035, By Form
    • Introduction / Key Findings
    • Historical Market Size Value (USD Million) & Volume (Metric Tons) Analysis By Form, 2020 to 2024
    • Current and Future Market Size Value (USD Million) & Volume (Metric Tons) Analysis and Forecast By Form, 2025 to 2035
      • Powder
      • Liquid
      • Tablets/Capsules
    • Y-o-Y Growth Trend Analysis By Form, 2020 to 2024
    • Absolute $ Opportunity Analysis By Form, 2025 to 2035
  7. Global Market Analysis 2020 to 2024 and Forecast 2025 to 2035, By Grade
    • Introduction / Key Findings
    • Historical Market Size Value (USD Million) & Volume (Metric Tons) Analysis By Grade, 2020 to 2024
    • Current and Future Market Size Value (USD Million) & Volume (Metric Tons) Analysis and Forecast By Grade, 2025 to 2035
      • Feed Grade
      • Food Grade
      • Pharmaceutical Grade
    • Y-o-Y Growth Trend Analysis By Grade, 2020 to 2024
    • Absolute $ Opportunity Analysis By Grade, 2025 to 2035
  8. Global Market Analysis 2020 to 2024 and Forecast 2025 to 2035, By Source
    • Introduction / Key Findings
    • Historical Market Size Value (USD Million) & Volume (Metric Tons) Analysis By Source, 2020 to 2024
    • Current and Future Market Size Value (USD Million) & Volume (Metric Tons) Analysis and Forecast By Source, 2025 to 2035
      • Natural
      • Synthetic
    • Y-o-Y Growth Trend Analysis By Source, 2020 to 2024
    • Absolute $ Opportunity Analysis By Source, 2025 to 2035
  9. Global Market Analysis 2020 to 2024 and Forecast 2025 to 2035, By End-use Industry
    • Introduction / Key Findings
    • Historical Market Size Value (USD Million) & Volume (Metric Tons) Analysis By End-use Industry, 2020 to 2024
    • Current and Future Market Size Value (USD Million) & Volume (Metric Tons) Analysis and Forecast By End-use Industry, 2025 to 2035
      • Dietary Supplements
      • Functional Foods and Beverages
      • Infant Food
      • Animal Feed
      • Personal Care
      • Pharmaceuticals
      • Others (Sports Nutrition Blends, Veterinary Health Tonics, Senior Wellness Formulas, Functional Confectionery)
    • Y-o-Y Growth Trend Analysis By End-use Industry, 2020 to 2024
    • Absolute $ Opportunity Analysis By End-use Industry, 2025 to 2035
  10. Global Market Analysis 2020 to 2024 and Forecast 2025 to 2035, By Region
    • Introduction
    • Historical Market Size Value (USD Million) & Volume (Metric Tons) Analysis By Region, 2020 to 2024
    • Current Market Size Value (USD Million) & Volume (Metric Tons) Analysis and Forecast By Region, 2025 to 2035
      • North America
      • Latin America
      • Western Europe
      • Eastern Europe
      • East Asia
      • South Asia & Pacific
      • Middle East and Africa
    • Market Attractiveness Analysis By Region
  11. North America Market Analysis 2020 to 2024 and Forecast 2025 to 2035, By Country
    • Historical Market Size Value (USD Million) & Volume (Metric Tons) Trend Analysis By Market Taxonomy, 2020 to 2024
    • Market Size Value (USD Million) & Volume (Metric Tons) Forecast By Market Taxonomy, 2025 to 2035
      • By Country
        • USA
        • Canada
        • Mexico
      • By Form
      • By Grade
      • By Source
      • By End-use Industry
    • Market Attractiveness Analysis
      • By Country
      • By Form
      • By Grade
      • By Source
      • By End-use Industry
    • Key Takeaways
  12. Latin America Market Analysis 2020 to 2024 and Forecast 2025 to 2035, By Country
    • Historical Market Size Value (USD Million) & Volume (Metric Tons) Trend Analysis By Market Taxonomy, 2020 to 2024
    • Market Size Value (USD Million) & Volume (Metric Tons) Forecast By Market Taxonomy, 2025 to 2035
      • By Country
        • Brazil
        • Argentina
        • Rest of LATAM
      • By Form
      • By Grade
      • By Source
      • By End-use Industry
    • Market Attractiveness Analysis
      • By Country
      • By Form
      • By Grade
      • By Source
      • By End-use Industry
    • Key Takeaways
  13. Western Europe Market Analysis 2020 to 2024 and Forecast 2025 to 2035, By Country
    • Historical Market Size Value (USD Million) & Volume (Metric Tons) Trend Analysis By Market Taxonomy, 2020 to 2024
    • Market Size Value (USD Million) & Volume (Metric Tons) Forecast By Market Taxonomy, 2025 to 2035
      • By Country
        • Germany
        • Italy
        • France
        • UK
        • Spain
        • BENELUX
        • Nordic
        • Rest of W.Europe
      • By Form
      • By Grade
      • By Source
      • By End-use Industry
    • Market Attractiveness Analysis
      • By Country
      • By Form
      • By Grade
      • By Source
      • By End-use Industry
    • Key Takeaways
  14. Eastern Europe Market Analysis 2020 to 2024 and Forecast 2025 to 2035, By Country
    • Historical Market Size Value (USD Million) & Volume (Metric Tons) Trend Analysis By Market Taxonomy, 2020 to 2024
    • Market Size Value (USD Million) & Volume (Metric Tons) Forecast By Market Taxonomy, 2025 to 2035
      • By Country
        • Russia
        • Hungary
        • Poland
        • Balkan & Baltics
        • Rest of E. Europe
      • By Form
      • By Grade
      • By Source
      • By End-use Industry
    • Market Attractiveness Analysis
      • By Country
      • By Form
      • By Grade
      • By Source
      • By End-use Industry
    • Key Takeaways
  15. East Asia Market Analysis 2020 to 2024 and Forecast 2025 to 2035, By Country
    • Historical Market Size Value (USD Million) & Volume (Metric Tons) Trend Analysis By Market Taxonomy, 2020 to 2024
    • Market Size Value (USD Million) & Volume (Metric Tons) Forecast By Market Taxonomy, 2025 to 2035
      • By Country
        • China
        • Japan
        • South Korea
      • By Form
      • By Grade
      • By Source
      • By End-use Industry
    • Market Attractiveness Analysis
      • By Country
      • By Form
      • By Grade
      • By Source
      • By End-use Industry
    • Key Takeaways
  16. South Asia & Pacific Market Analysis 2020 to 2024 and Forecast 2025 to 2035, By Country
    • Historical Market Size Value (USD Million) & Volume (Metric Tons) Trend Analysis By Market Taxonomy, 2020 to 2024
    • Market Size Value (USD Million) & Volume (Metric Tons) Forecast By Market Taxonomy, 2025 to 2035
      • By Country
        • India
        • Australia & New Zealand
        • ASEAN
        • Rest of SAP
      • By Form
      • By Grade
      • By Source
      • By End-use Industry
    • Market Attractiveness Analysis
      • By Country
      • By Form
      • By Grade
      • By Source
      • By End-use Industry
    • Key Takeaways
  17. Middle East and Africa Market Analysis 2020 to 2024 and Forecast 2025 to 2035, By Country
    • Historical Market Size Value (USD Million) & Volume (Metric Tons) Trend Analysis By Market Taxonomy, 2020 to 2024
    • Market Size Value (USD Million) & Volume (Metric Tons) Forecast By Market Taxonomy, 2025 to 2035
      • By Country
        • GCC Countries
        • Northern Africa
        • South Africa
        • Turkiye
        • Rest of MEA
      • By Form
      • By Grade
      • By Source
      • By End-use Industry
    • Market Attractiveness Analysis
      • By Country
      • By Form
      • By Grade
      • By Source
      • By End-use Industry
    • Key Takeaways
  18. Key Countries Market Analysis
    • USA
      • Pricing Analysis
      • Market Share Analysis, 2024
        • By Form
        • By Grade
        • By Source
        • By End-use Industry
    • Canada
      • Pricing Analysis
      • Market Share Analysis, 2024
        • By Form
        • By Grade
        • By Source
        • By End-use Industry
    • Brazil
      • Pricing Analysis
      • Market Share Analysis, 2024
        • By Form
        • By Grade
        • By Source
        • By End-use Industry
    • Mexico
      • Pricing Analysis
      • Market Share Analysis, 2024
        • By Form
        • By Grade
        • By Source
        • By End-use Industry
    • Argentina
      • Pricing Analysis
      • Market Share Analysis, 2024
        • By Form
        • By Grade
        • By Source
        • By End-use Industry
  19. Market Structure Analysis
    • Competition Dashboard
    • Competition Benchmarking
    • Market Share Analysis of Top Players
      • By Regional
      • By Form
      • By Grade
      • By Source
      • By End-use Industry
  20. Competition Analysis
    • Competition Deep Dive
      • Graham Chemical
        • Overview
        • Product Portfolio
        • Profitability by Market Segments (Product/Age /Sales Channel/Region)
        • Sales Footprint
        • Strategy Overview
          • Marketing Strategy
          • Product Strategy
          • Channel Strategy
      • Glanbia plc
        • Overview
        • Product Portfolio
        • Profitability by Market Segments (Product/Age /Sales Channel/Region)
        • Sales Footprint
        • Strategy Overview
          • Marketing Strategy
          • Product Strategy
          • Channel Strategy
      • Lonza Group AG
        • Overview
        • Product Portfolio
        • Profitability by Market Segments (Product/Age /Sales Channel/Region)
        • Sales Footprint
        • Strategy Overview
          • Marketing Strategy
          • Product Strategy
          • Channel Strategy
      • Jubilant Life Sciences Ltd.
        • Overview
        • Product Portfolio
        • Profitability by Market Segments (Product/Age /Sales Channel/Region)
        • Sales Footprint
        • Strategy Overview
          • Marketing Strategy
          • Product Strategy
          • Channel Strategy
      • NutraScience Labs
        • Overview
        • Product Portfolio
        • Profitability by Market Segments (Product/Age /Sales Channel/Region)
        • Sales Footprint
        • Strategy Overview
          • Marketing Strategy
          • Product Strategy
          • Channel Strategy
      • DSM
        • Overview
        • Product Portfolio
        • Profitability by Market Segments (Product/Age /Sales Channel/Region)
        • Sales Footprint
        • Strategy Overview
          • Marketing Strategy
          • Product Strategy
          • Channel Strategy
      • BASF SE
        • Overview
        • Product Portfolio
        • Profitability by Market Segments (Product/Age /Sales Channel/Region)
        • Sales Footprint
        • Strategy Overview
          • Marketing Strategy
          • Product Strategy
          • Channel Strategy
      • Western Drugs Ltd.
        • Overview
        • Product Portfolio
        • Profitability by Market Segments (Product/Age /Sales Channel/Region)
        • Sales Footprint
        • Strategy Overview
          • Marketing Strategy
          • Product Strategy
          • Channel Strategy
      • Spectrum Chemical Mfg. Corp
        • Overview
        • Product Portfolio
        • Profitability by Market Segments (Product/Age /Sales Channel/Region)
        • Sales Footprint
        • Strategy Overview
          • Marketing Strategy
          • Product Strategy
          • Channel Strategy
      • Fengchen Group Co., Ltd
        • Overview
        • Product Portfolio
        • Profitability by Market Segments (Product/Age /Sales Channel/Region)
        • Sales Footprint
        • Strategy Overview
          • Marketing Strategy
          • Product Strategy
          • Channel Strategy
  21. Assumptions & Acronyms Used
  22. Research Methodology

List of Tables

  • Table 1: Global Market Value (USD Million) Forecast by Region, 2020-2035
  • Table 2: Global Market Volume (Metric Tons) Forecast by Region, 2020-2035
  • Table 3: Global Market Value (USD Million) Forecast by Form, 2020-2035
  • Table 4: Global Market Volume (Metric Tons) Forecast by Form, 2020-2035
  • Table 5: Global Market Value (USD Million) Forecast by Grade, 2020-2035
  • Table 6: Global Market Volume (Metric Tons) Forecast by Grade, 2020-2035
  • Table 7: Global Market Value (USD Million) Forecast by Source, 2020-2035
  • Table 8: Global Market Volume (Metric Tons) Forecast by Source, 2020-2035
  • Table 9: Global Market Value (USD Million) Forecast by End-use Industry, 2020-2035
  • Table 10: Global Market Volume (Metric Tons) Forecast by End-use Industry, 2020-2035
  • Table 11: North America Market Value (USD Million) Forecast by Country, 2020-2035
  • Table 12: North America Market Volume (Metric Tons) Forecast by Country, 2020-2035
  • Table 13: North America Market Value (USD Million) Forecast by Form, 2020-2035
  • Table 14: North America Market Volume (Metric Tons) Forecast by Form, 2020-2035
  • Table 15: North America Market Value (USD Million) Forecast by Grade, 2020-2035
  • Table 16: North America Market Volume (Metric Tons) Forecast by Grade, 2020-2035
  • Table 17: North America Market Value (USD Million) Forecast by Source, 2020-2035
  • Table 18: North America Market Volume (Metric Tons) Forecast by Source, 2020-2035
  • Table 19: North America Market Value (USD Million) Forecast by End-use Industry, 2020-2035
  • Table 20: North America Market Volume (Metric Tons) Forecast by End-use Industry, 2020-2035
  • Table 21: Latin America Market Value (USD Million) Forecast by Country, 2020-2035
  • Table 22: Latin America Market Volume (Metric Tons) Forecast by Country, 2020-2035
  • Table 23: Latin America Market Value (USD Million) Forecast by Form, 2020-2035
  • Table 24: Latin America Market Volume (Metric Tons) Forecast by Form, 2020-2035
  • Table 25: Latin America Market Value (USD Million) Forecast by Grade, 2020-2035
  • Table 26: Latin America Market Volume (Metric Tons) Forecast by Grade, 2020-2035
  • Table 27: Latin America Market Value (USD Million) Forecast by Source, 2020-2035
  • Table 28: Latin America Market Volume (Metric Tons) Forecast by Source, 2020-2035
  • Table 29: Latin America Market Value (USD Million) Forecast by End-use Industry, 2020-2035
  • Table 30: Latin America Market Volume (Metric Tons) Forecast by End-use Industry, 2020-2035
  • Table 31: Western Europe Market Value (USD Million) Forecast by Country, 2020-2035
  • Table 32: Western Europe Market Volume (Metric Tons) Forecast by Country, 2020-2035
  • Table 33: Western Europe Market Value (USD Million) Forecast by Form, 2020-2035
  • Table 34: Western Europe Market Volume (Metric Tons) Forecast by Form, 2020-2035
  • Table 35: Western Europe Market Value (USD Million) Forecast by Grade, 2020-2035
  • Table 36: Western Europe Market Volume (Metric Tons) Forecast by Grade, 2020-2035
  • Table 37: Western Europe Market Value (USD Million) Forecast by Source, 2020-2035
  • Table 38: Western Europe Market Volume (Metric Tons) Forecast by Source, 2020-2035
  • Table 39: Western Europe Market Value (USD Million) Forecast by End-use Industry, 2020-2035
  • Table 40: Western Europe Market Volume (Metric Tons) Forecast by End-use Industry, 2020-2035
  • Table 41: Eastern Europe Market Value (USD Million) Forecast by Country, 2020-2035
  • Table 42: Eastern Europe Market Volume (Metric Tons) Forecast by Country, 2020-2035
  • Table 43: Eastern Europe Market Value (USD Million) Forecast by Form, 2020-2035
  • Table 44: Eastern Europe Market Volume (Metric Tons) Forecast by Form, 2020-2035
  • Table 45: Eastern Europe Market Value (USD Million) Forecast by Grade, 2020-2035
  • Table 46: Eastern Europe Market Volume (Metric Tons) Forecast by Grade, 2020-2035
  • Table 47: Eastern Europe Market Value (USD Million) Forecast by Source, 2020-2035
  • Table 48: Eastern Europe Market Volume (Metric Tons) Forecast by Source, 2020-2035
  • Table 49: Eastern Europe Market Value (USD Million) Forecast by End-use Industry, 2020-2035
  • Table 50: Eastern Europe Market Volume (Metric Tons) Forecast by End-use Industry, 2020-2035
  • Table 51: East Asia Market Value (USD Million) Forecast by Country, 2020-2035
  • Table 52: East Asia Market Volume (Metric Tons) Forecast by Country, 2020-2035
  • Table 53: East Asia Market Value (USD Million) Forecast by Form, 2020-2035
  • Table 54: East Asia Market Volume (Metric Tons) Forecast by Form, 2020-2035
  • Table 55: East Asia Market Value (USD Million) Forecast by Grade, 2020-2035
  • Table 56: East Asia Market Volume (Metric Tons) Forecast by Grade, 2020-2035
  • Table 57: East Asia Market Value (USD Million) Forecast by Source, 2020-2035
  • Table 58: East Asia Market Volume (Metric Tons) Forecast by Source, 2020-2035
  • Table 59: East Asia Market Value (USD Million) Forecast by End-use Industry, 2020-2035
  • Table 60: East Asia Market Volume (Metric Tons) Forecast by End-use Industry, 2020-2035
  • Table 61: South Asia & Pacific Market Value (USD Million) Forecast by Country, 2020-2035
  • Table 62: South Asia & Pacific Market Volume (Metric Tons) Forecast by Country, 2020-2035
  • Table 63: South Asia & Pacific Market Value (USD Million) Forecast by Form, 2020-2035
  • Table 64: South Asia & Pacific Market Volume (Metric Tons) Forecast by Form, 2020-2035
  • Table 65: South Asia & Pacific Market Value (USD Million) Forecast by Grade, 2020-2035
  • Table 66: South Asia & Pacific Market Volume (Metric Tons) Forecast by Grade, 2020-2035
  • Table 67: South Asia & Pacific Market Value (USD Million) Forecast by Source, 2020-2035
  • Table 68: South Asia & Pacific Market Volume (Metric Tons) Forecast by Source, 2020-2035
  • Table 69: South Asia & Pacific Market Value (USD Million) Forecast by End-use Industry, 2020-2035
  • Table 70: South Asia & Pacific Market Volume (Metric Tons) Forecast by End-use Industry, 2020-2035
  • Table 71: Middle East and Africa Market Value (USD Million) Forecast by Country, 2020-2035
  • Table 72: Middle East and Africa Market Volume (Metric Tons) Forecast by Country, 2020-2035
  • Table 73: Middle East and Africa Market Value (USD Million) Forecast by Form, 2020-2035
  • Table 74: Middle East and Africa Market Volume (Metric Tons) Forecast by Form, 2020-2035
  • Table 75: Middle East and Africa Market Value (USD Million) Forecast by Grade, 2020-2035
  • Table 76: Middle East and Africa Market Volume (Metric Tons) Forecast by Grade, 2020-2035
  • Table 77: Middle East and Africa Market Value (USD Million) Forecast by Source, 2020-2035
  • Table 78: Middle East and Africa Market Volume (Metric Tons) Forecast by Source, 2020-2035
  • Table 79: Middle East and Africa Market Value (USD Million) Forecast by End-use Industry, 2020-2035
  • Table 80: Middle East and Africa Market Volume (Metric Tons) Forecast by End-use Industry, 2020-2035

List of Figures

  • Figure 1: Global Market Volume (Metric Tons) Forecast 2020-2035
  • Figure 2: Global Market Pricing Analysis
  • Figure 3: Global Market Value (USD Million) Forecast 2020-2035
  • Figure 4: Global Market Value Share and BPS Analysis by Form, 2025 and 2035
  • Figure 5: Global Market Y-o-Y Growth Comparison by Form, 2025-2035
  • Figure 6: Global Market Attractiveness Analysis by Form
  • Figure 7: Global Market Value Share and BPS Analysis by Grade, 2025 and 2035
  • Figure 8: Global Market Y-o-Y Growth Comparison by Grade, 2025-2035
  • Figure 9: Global Market Attractiveness Analysis by Grade
  • Figure 10: Global Market Value Share and BPS Analysis by Source, 2025 and 2035
  • Figure 11: Global Market Y-o-Y Growth Comparison by Source, 2025-2035
  • Figure 12: Global Market Attractiveness Analysis by Source
  • Figure 13: Global Market Value Share and BPS Analysis by End-use Industry, 2025 and 2035
  • Figure 14: Global Market Y-o-Y Growth Comparison by End-use Industry, 2025-2035
  • Figure 15: Global Market Attractiveness Analysis by End-use Industry
  • Figure 16: Global Market Value (USD Million) Share and BPS Analysis by Region, 2025 and 2035
  • Figure 17: Global Market Y-o-Y Growth Comparison by Region, 2025-2035
  • Figure 18: Global Market Attractiveness Analysis by Region
  • Figure 19: North America Market Incremental $ Opportunity, 2025-2035
  • Figure 20: Latin America Market Incremental $ Opportunity, 2025-2035
  • Figure 21: Western Europe Market Incremental $ Opportunity, 2025-2035
  • Figure 22: Eastern Europe Market Incremental $ Opportunity, 2025-2035
  • Figure 23: East Asia Market Incremental $ Opportunity, 2025-2035
  • Figure 24: South Asia & Pacific Market Incremental $ Opportunity, 2025-2035
  • Figure 25: Middle East and Africa Market Incremental $ Opportunity, 2025-2035
  • Figure 26: North America Market Value Share and BPS Analysis by Country, 2025 and 2035
  • Figure 27: North America Market Value Share and BPS Analysis by Form, 2025 and 2035
  • Figure 28: North America Market Y-o-Y Growth Comparison by Form, 2025-2035
  • Figure 29: North America Market Attractiveness Analysis by Form
  • Figure 30: North America Market Value Share and BPS Analysis by Grade, 2025 and 2035
  • Figure 31: North America Market Y-o-Y Growth Comparison by Grade, 2025-2035
  • Figure 32: North America Market Attractiveness Analysis by Grade
  • Figure 33: North America Market Value Share and BPS Analysis by Source, 2025 and 2035
  • Figure 34: North America Market Y-o-Y Growth Comparison by Source, 2025-2035
  • Figure 35: North America Market Attractiveness Analysis by Source
  • Figure 36: North America Market Value Share and BPS Analysis by End-use Industry, 2025 and 2035
  • Figure 37: North America Market Y-o-Y Growth Comparison by End-use Industry, 2025-2035
  • Figure 38: North America Market Attractiveness Analysis by End-use Industry
  • Figure 39: Latin America Market Value Share and BPS Analysis by Country, 2025 and 2035
  • Figure 40: Latin America Market Value Share and BPS Analysis by Form, 2025 and 2035
  • Figure 41: Latin America Market Y-o-Y Growth Comparison by Form, 2025-2035
  • Figure 42: Latin America Market Attractiveness Analysis by Form
  • Figure 43: Latin America Market Value Share and BPS Analysis by Grade, 2025 and 2035
  • Figure 44: Latin America Market Y-o-Y Growth Comparison by Grade, 2025-2035
  • Figure 45: Latin America Market Attractiveness Analysis by Grade
  • Figure 46: Latin America Market Value Share and BPS Analysis by Source, 2025 and 2035
  • Figure 47: Latin America Market Y-o-Y Growth Comparison by Source, 2025-2035
  • Figure 48: Latin America Market Attractiveness Analysis by Source
  • Figure 49: Latin America Market Value Share and BPS Analysis by End-use Industry, 2025 and 2035
  • Figure 50: Latin America Market Y-o-Y Growth Comparison by End-use Industry, 2025-2035
  • Figure 51: Latin America Market Attractiveness Analysis by End-use Industry
  • Figure 52: Western Europe Market Value Share and BPS Analysis by Country, 2025 and 2035
  • Figure 53: Western Europe Market Value Share and BPS Analysis by Form, 2025 and 2035
  • Figure 54: Western Europe Market Y-o-Y Growth Comparison by Form, 2025-2035
  • Figure 55: Western Europe Market Attractiveness Analysis by Form
  • Figure 56: Western Europe Market Value Share and BPS Analysis by Grade, 2025 and 2035
  • Figure 57: Western Europe Market Y-o-Y Growth Comparison by Grade, 2025-2035
  • Figure 58: Western Europe Market Attractiveness Analysis by Grade
  • Figure 59: Western Europe Market Value Share and BPS Analysis by Source, 2025 and 2035
  • Figure 60: Western Europe Market Y-o-Y Growth Comparison by Source, 2025-2035
  • Figure 61: Western Europe Market Attractiveness Analysis by Source
  • Figure 62: Western Europe Market Value Share and BPS Analysis by End-use Industry, 2025 and 2035
  • Figure 63: Western Europe Market Y-o-Y Growth Comparison by End-use Industry, 2025-2035
  • Figure 64: Western Europe Market Attractiveness Analysis by End-use Industry
  • Figure 65: Eastern Europe Market Value Share and BPS Analysis by Country, 2025 and 2035
  • Figure 66: Eastern Europe Market Value Share and BPS Analysis by Form, 2025 and 2035
  • Figure 67: Eastern Europe Market Y-o-Y Growth Comparison by Form, 2025-2035
  • Figure 68: Eastern Europe Market Attractiveness Analysis by Form
  • Figure 69: Eastern Europe Market Value Share and BPS Analysis by Grade, 2025 and 2035
  • Figure 70: Eastern Europe Market Y-o-Y Growth Comparison by Grade, 2025-2035
  • Figure 71: Eastern Europe Market Attractiveness Analysis by Grade
  • Figure 72: Eastern Europe Market Value Share and BPS Analysis by Source, 2025 and 2035
  • Figure 73: Eastern Europe Market Y-o-Y Growth Comparison by Source, 2025-2035
  • Figure 74: Eastern Europe Market Attractiveness Analysis by Source
  • Figure 75: Eastern Europe Market Value Share and BPS Analysis by End-use Industry, 2025 and 2035
  • Figure 76: Eastern Europe Market Y-o-Y Growth Comparison by End-use Industry, 2025-2035
  • Figure 77: Eastern Europe Market Attractiveness Analysis by End-use Industry
  • Figure 78: East Asia Market Value Share and BPS Analysis by Country, 2025 and 2035
  • Figure 79: East Asia Market Value Share and BPS Analysis by Form, 2025 and 2035
  • Figure 80: East Asia Market Y-o-Y Growth Comparison by Form, 2025-2035
  • Figure 81: East Asia Market Attractiveness Analysis by Form
  • Figure 82: East Asia Market Value Share and BPS Analysis by Grade, 2025 and 2035
  • Figure 83: East Asia Market Y-o-Y Growth Comparison by Grade, 2025-2035
  • Figure 84: East Asia Market Attractiveness Analysis by Grade
  • Figure 85: East Asia Market Value Share and BPS Analysis by Source, 2025 and 2035
  • Figure 86: East Asia Market Y-o-Y Growth Comparison by Source, 2025-2035
  • Figure 87: East Asia Market Attractiveness Analysis by Source
  • Figure 88: East Asia Market Value Share and BPS Analysis by End-use Industry, 2025 and 2035
  • Figure 89: East Asia Market Y-o-Y Growth Comparison by End-use Industry, 2025-2035
  • Figure 90: East Asia Market Attractiveness Analysis by End-use Industry
  • Figure 91: South Asia & Pacific Market Value Share and BPS Analysis by Country, 2025 and 2035
  • Figure 92: South Asia & Pacific Market Value Share and BPS Analysis by Form, 2025 and 2035
  • Figure 93: South Asia & Pacific Market Y-o-Y Growth Comparison by Form, 2025-2035
  • Figure 94: South Asia & Pacific Market Attractiveness Analysis by Form
  • Figure 95: South Asia & Pacific Market Value Share and BPS Analysis by Grade, 2025 and 2035
  • Figure 96: South Asia & Pacific Market Y-o-Y Growth Comparison by Grade, 2025-2035
  • Figure 97: South Asia & Pacific Market Attractiveness Analysis by Grade
  • Figure 98: South Asia & Pacific Market Value Share and BPS Analysis by Source, 2025 and 2035
  • Figure 99: South Asia & Pacific Market Y-o-Y Growth Comparison by Source, 2025-2035
  • Figure 100: South Asia & Pacific Market Attractiveness Analysis by Source
  • Figure 101: South Asia & Pacific Market Value Share and BPS Analysis by End-use Industry, 2025 and 2035
  • Figure 102: South Asia & Pacific Market Y-o-Y Growth Comparison by End-use Industry, 2025-2035
  • Figure 103: South Asia & Pacific Market Attractiveness Analysis by End-use Industry
  • Figure 104: Middle East and Africa Market Value Share and BPS Analysis by Country, 2025 and 2035
  • Figure 105: Middle East and Africa Market Value Share and BPS Analysis by Form, 2025 and 2035
  • Figure 106: Middle East and Africa Market Y-o-Y Growth Comparison by Form, 2025-2035
  • Figure 107: Middle East and Africa Market Attractiveness Analysis by Form
  • Figure 108: Middle East and Africa Market Value Share and BPS Analysis by Grade, 2025 and 2035
  • Figure 109: Middle East and Africa Market Y-o-Y Growth Comparison by Grade, 2025-2035
  • Figure 110: Middle East and Africa Market Attractiveness Analysis by Grade
  • Figure 111: Middle East and Africa Market Value Share and BPS Analysis by Source, 2025 and 2035
  • Figure 112: Middle East and Africa Market Y-o-Y Growth Comparison by Source, 2025-2035
  • Figure 113: Middle East and Africa Market Attractiveness Analysis by Source
  • Figure 114: Middle East and Africa Market Value Share and BPS Analysis by End-use Industry, 2025 and 2035
  • Figure 115: Middle East and Africa Market Y-o-Y Growth Comparison by End-use Industry, 2025-2035
  • Figure 116: Middle East and Africa Market Attractiveness Analysis by End-use Industry
  • Figure 117: Global Market - Tier Structure Analysis
  • Figure 118: Global Market - Company Share Analysis

Frequently Asked Questions

What is the projected size of the nicotinic acid market in 2025?

The market is valued at USD 362.4 million in 2025.

What is the outlook on nicotinic acid demand by 2035?

The market is forecasted to reach USD 601.7 million by 2035, reflecting a CAGR of 5.2%.

Which form segment in nicotinic acid market is leading in 2025?

Powder will lead the form segment, accounting for 45% of the global market share in 2025.

What is the top source segment for the nicotinic acid market in 2025?

Synthetic will dominate the source segment with a 55% share in 2025.

Which country is projected to have the fastest-growing nicotinic acid market?

Japan is projected to grow at the fastest rate, with a CAGR of 4.9% from 2025 to 2035.

Explore Similar Insights

Future Market Insights

Nicotinic Acid Market