

- Market Size (2026)
- USD 520.6 Mn
- Forecast (2036)
- USD 968.1 Mn
- CAGR (2026 to 2036)
- 6.4%
How big is Nitrite Removal Chemicals Market in 2026?
USD 520.6 million in 2026 and USD 968.1 million by 2036 at a 6.4% CAGR.
Demand for nitrite removal chemicals increases once compliance monitoring exposes a nitrite-control duty that existing process management cannot close reliably. Iowa DNR’s 2025 compliance report recorded repeated nitrite-monitoring violations at Glenn Oaks Addition before the system returned to compliance in October 2025. The record does not establish a nitrite exceedance but it shows that regulated monitoring can force corrective administrative action. Water treatment chemicals enter procurement if subsequent water chemistry demonstrates a treatment gap that requires a dedicated consumable step.
Aquaculture changes purchase frequency, driven by pond chemistry that can require faster correction than municipal asset replacement cycles. Vietnam’s National Statistics Office reported that farmed shrimp output increased 6.1% during 2025, expanding the production base that requires routine water-quality control. Vietnam’s modeled 6.8% CAGR therefore exceeds Brazil’s 6.2%, attributable to stronger participation by water treatment dealers and farm-level technical teams in order conversion.
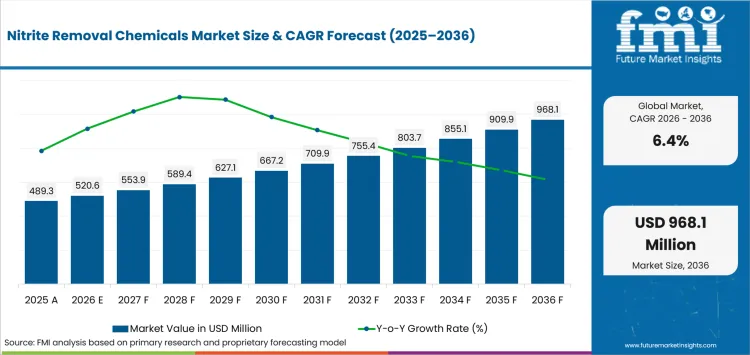
Key Takeaways of Nitrite Removal Chemicals Market
- Demand rises when monitored nitrite exceeds an operating limit that biological control or routine process adjustment does not correct reliably.
- Ion exchange media is projected to account for 26.0% of product type demand in 2026 because contained resin beds support controlled anion removal.
- Granular media is estimated to hold 38.0% of form demand in 2026, supported by replaceable media formats that avoid vessel rebuilding when capacity is exhausted.
- Drinking water treatment is anticipated to represent 28.0% of application demand in 2026, underpinned by enforceable thresholds that create a measurable treatment objective.
- Competing biological conversion and feedwater ions restrain adoption by increasing testing needs and weakening the economics of a dedicated treatment step.
- Some of the key players in this market include LANXESS AG, DuPont de Nemours, Inc., Kuraray Co., Ltd., Thermax Limited, Ion Exchange (India) Limited, Ecolab Inc., Xylem Inc., and Kemira Oyj.
Analyst Perspective
“Nitrite removal offers should be evaluated on usable treatment capacity within the site’s real water chemistry instead of quoted unit price alone. Commercial value is earned where media life, replacement logistics and technical guidance reduce the interval between a high nitrite reading and a controlled response.”
- Nikhil Kaitwade, Principal Consultant, Future Market Insights
How is the Nitrite Removal Chemicals Market segmented?
The market is segmented by product type, form, application, end use, sales channel and region.
Product type covers ion exchange media, biological nitrification aids, chemical reducing agents, adsorbent blends and aquaculture nitrite binders. Form includes granular media, liquid treatment, powder and tablet or sachet formats. Application covers drinking water treatment, aquaculture ponds, industrial process water, wastewater polishing and aquarium treatment. End use and sales channel distinguish utilities, farms, industrial sites, filtration users, aquarium channels and their direct or distributor purchasing routes.
What makes Ion exchange media central to the Product Type category?
Ion exchange media fits treatment plants that need a contained removal step with defined loading and replacement intervals. In March 2025 LANXESS launched Lewatit MDS TP 108 for difficult short-chain contaminant removal and expanded current investment in selective ion exchange resins.
How does Drinking Water Treatment anchor the Application category?
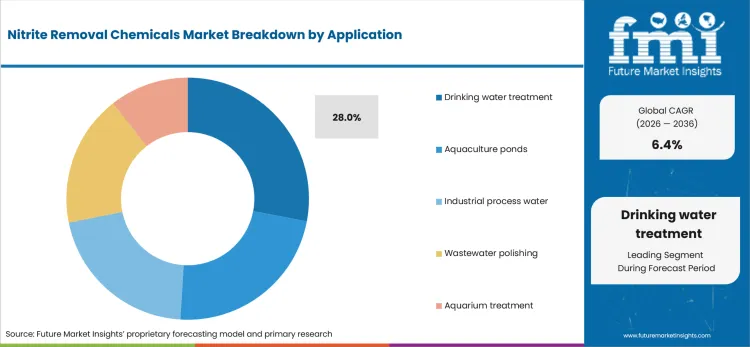
Drinking-water operators specify supplemental treatment after routine monitoring identifies a regulated contaminant that the installed process cannot control with adequate margin. Minnesota’s 2025 report recorded 5,617 noncommunity systems tested for nitrate or nitrite and eight affected systems. Water treatment systems therefore need a measurable finished-water objective during routine plant review.
- Drinking water treatment is anticipated to hold 28.0% share in 2026, supported by compliance monitoring that turns removal targets into routine plant-performance benchmarks.
- Utilities assess treatment capacity against source-water chemistry and installed equipment before approving a replacement medium or chemical step. The selected option must perform consistently during normal plant operation.
- By product type, Ion exchange media is projected to hold 26.0% share; in 2026, driven by fixed-bed operation that fits existing vessels and established service routines without altering pretreatment or post-treatment equipment.
- Water engineers assess selectivity and regeneration economics against the site’s actual feedwater chemistry. That review informs regular resin replacement and multi-cycle procurement schedules.
Why does Granular Media lead the Form category?
Granular media gives operators a replaceable treatment inventory separate from the pressure vessel and makes exhausted capacity a visible service event. Kemira approved a Helsingborg reactivation plant in September 2025 for spent granular activated carbon used in drinking-water treatment.
- Granular media is estimated to account for 38.0% of form demand in 2026, attributable to contained media that lets operators plan exchanges without rebuilding upstream treatment or changing vessel configuration.
- Reactivation availability and distributor inventory shape replacement economics because exhausted media must leave service quickly. Fast replacement protects treatment continuity and avoids extended outages.
What supports Municipal Utilities as the leading End Use?
Municipal utilities route treatment changes through sampling records and engineering review before a new consumable enters regular service. In May 2026 Minnesota reported more than 6,500 public water suppliers and more than 99% met federal health-based standards during 2025. Water treatment chemistry enters utility purchasing through documented operating need and accountable review.
- Municipal utilities are projected to represent 31.0% by end-use in 2026, reflecting compliance programs that convert monitoring results into formal treatment decisions with clear operating responsibility.
- Lifecycle cost and replacement availability govern utility purchasing after a corrective installation enters regular service. Treatment must remain serviceable over later replacement cycles.
What are the drivers, restraints and opportunities in the Nitrite Removal Chemicals Market?
Enforceable water-quality limits increase demand while feedwater-specific qualification restrains adoption and regional supply improves consumable replenishment economics.
- Driver: Regulatory monitoring converts an unresolved nitrite condition into an engineering decision that can require dedicated media or chemical treatment.
- Restraint: Feedwater chemistry and existing biological conversion increase qualification work before operators commit to a separate consumable treatment route.
- Opportunity: Regional manufacturing and reactivation capacity shorten replenishment routes for sites that depend on predictable treatment continuity after media exhaustion.
Enforceable Nitrite Limits Define Treatment Duty
Regulatory monitoring converts nitrite from a background chemistry issue into a budget decision once an exceedance requires documented follow-up. California’s 2024 Annual Compliance Report was published in June 2025 and recorded one nitrite maximum-contaminant-level violation in Santa Barbara County. That evidence gives industrial water analysis providers a concrete entry point, as municipal engineers must determine whether existing controls provide enough margin before selecting supplemental treatment.
Feedwater Chemistry Raises Qualification Cost
Feedwater chemistry can shorten effective resin capacity and raises the cost of proving that a dedicated treatment step works under site conditions. DuPont expanded WAVE PRO in September 2025 by integrating AmberLite ion-exchange resins with feedwater-specific modeling and project economics. Water engineers therefore need a defensible loading and regeneration case before procurement commits to repeat media purchases, particularly where an existing biological or process-control route already meets the operating target.
Regional Capacity Improves Replenishment Economics
Regional supply changes consumable economics, since a site cannot wait through long import cycles after treatment capacity is exhausted. Thermax commissioned a 3,838 MT-per-year chemical manufacturing facility in Cilegon during 2025 to strengthen Southeast Asian supply. Local manufacturing gives industrial water treatment distributors shorter replenishment routes and lets technical teams support repeat dosing programs without forcing operators to carry excessive safety stock.
Which country CAGRs are profiled in the Nitrite Removal Chemicals Market?
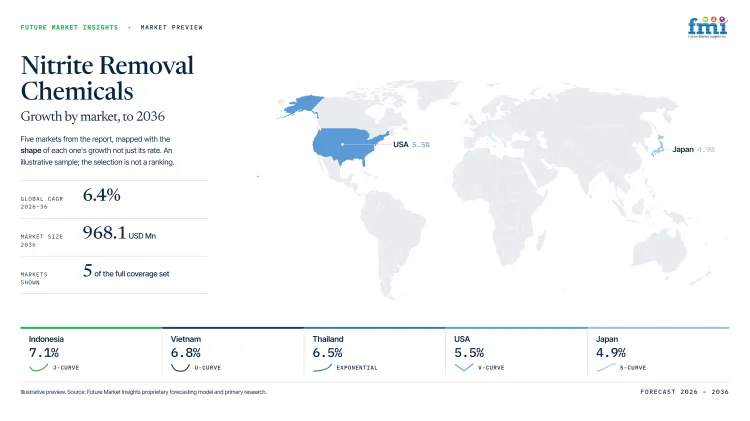
| Country | CAGR |
|---|---|
| Indonesia | 7.1% |
| Vietnam | 6.8% |
| Thailand | 6.5% |
| USA | 5.5% |
| Japan | 4.9% |
How do country-level CAGRs compare in the Nitrite Removal Chemicals Market?
The five countries span 2.2 percentage points, from Indonesia at 7.1% CAGR to Japan at 4.9%. Indonesia, Vietnam, and Thailand form the upper growth band, supported by intensive shrimp farming and recurring pond-management requirements. The USA follows, while Japan records the lowest CAGR among the five markets, reflecting its more mature aquaculture base and established treatment practices.
- Indonesia’s shrimp clusters reward dealers with crop-cycle replenishment stock.
- Vietnam’s approval route makes local trials part of market entry.
- Thailand’s intensive farms sustain treatment stock near coastal production hubs.
- The USA benefits from established aquaculture operations and structured distribution channels for treatment products.
- Japan’s mature aquaculture sector and established water-quality practices result in comparatively slower market expansion.
The CAGR range conceals distinct service costs and order-conversion conditions in each national market. The full report provides country-level CAGR analysis across North America, Latin America, Europe, East Asia, South Asia, Oceania and the Middle East and Africa.
Country-wise Analysis
- Indonesia’s high-density shrimp farms depend on regular pond testing and nearby aquaculture dealers. The Ministry of Marine Affairs and Fisheries reported provisional shrimp output of 1.13 million tonnes in 2025, reflecting an average annual growth rate of 7.32% since 2021. This expanding production base increases the need for routine water-quality management and rapid corrective treatment during crop cycles. Supported by these operating requirements, demand for nitrite removal chemicals in Indonesia is expected to expand at a CAGR of 7.1% over the forecast period. Variable pond chemistry further reinforces the importance of technical dosing support, helping suppliers generate repeat orders.
- Vietnam’s intensive shrimp farming industry makes water-quality management an operational priority. The National Statistics Office reported 5.1% growth in aquaculture output and 5.5% growth in farmed shrimp production during the first quarter of 2025, highlighting continued expansion in commercial farming activity. A larger production base strengthens distribution networks and increases demand for routine water-treatment inputs. Vietnam is set to record a CAGR of 6.8% between 2026 and 2036, aided by dense production clusters and dealer networks capable of converting water-testing requirements into recurring purchases after technical qualification.
- Thailand’s established farm-input distribution network serves intensive aquaculture operations concentrated near key coastal production areas. According to the Department of Fisheries, intensive systems accounted for 85.28% of Thailand’s 389,793 tonnes of farmed marine shrimp production in 2024, underscoring the industry's reliance on closely managed pond conditions. Higher biological loads in intensive systems create a recurring need for water-quality correction, thereby supporting market expansion at a projected CAGR of 6.5% during the assessment period. Distributors that maintain local inventory and technical advisory capabilities remain well positioned to capture repeat business.
- The USA benefits from established aquaculture operations, structured distribution networks, and increasing emphasis on maintaining stable water conditions in commercial production systems. Demand for nitrite removal chemicals is expected to expand at a CAGR of 5.5% from 2026 to 2036. The market’s relatively developed aquaculture infrastructure supports product availability and technical adoption, while established treatment practices moderate the pace of incremental demand compared with the faster-growing Southeast Asian markets.
- Japan’s aquaculture sector operates within a mature production environment supported by established farm-management practices and structured supply networks. Demand for nitrite removal chemicals is projected to grow at a CAGR of 4.9% over the forecast period. The comparatively slower growth reflects the maturity of the market and established water-quality management practices, although continued demand for reliable treatment solutions remains supported by the need to maintain stable conditions across intensive aquaculture operations..
Who are the notable companies in the Nitrite Removal Chemicals Market?
LANXESS AG, DuPont de Nemours, Inc., Kuraray Co., Ltd., Thermax Limited, Ion Exchange (India) Limited, Ecolab Inc., Xylem Inc., and Kemira Oyj are the notable companies profiled in this market.
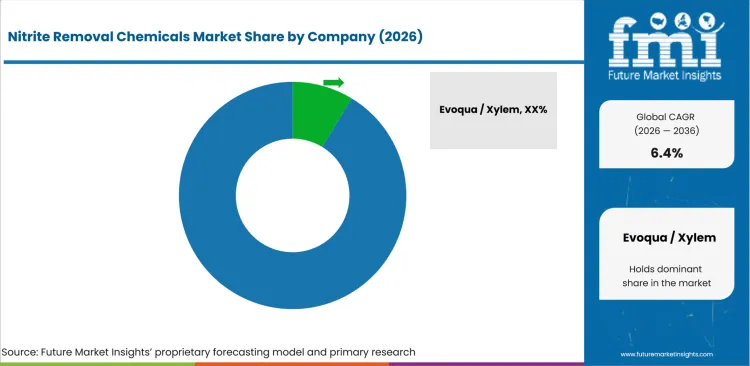
Competition is fragmented among resin producers and adsorbent groups plus integrated water-treatment companies that serve several contaminant-control routes from the same technical base. Thermax also participates in boiler water treatment where chemical replenishment uses related industrial service channels and local operating support.
Xylem serves adjacent produced-water treatment and municipal applications that place its service organization near sites already managing complex water chemistry. Entry barriers depend on qualification evidence and local replacement stock plus field support more than corporate size alone.
- LANXESS AG and DuPont de Nemours, Inc. compete on ion-exchange and separation platforms that support engineered treatment design for regulated water duties.
- Thermax Limited, Ion Exchange (India) Limited and Ecolab Inc. pair treatment chemicals or resins with engineering and service coverage for industrial water programs.
- Kuraray Co., Ltd., Xylem Inc. and Kemira Oyj participate through adsorbent media or treatment equipment and water-chemistry platforms serving municipal and industrial operators.
Competitive Benchmarking: Nitrite Removal Chemicals Market
| Company | Treatment Technology Breadth | Water Application Coverage | Design or Service Support | Geographic Reach |
|---|---|---|---|---|
| LANXESS AG | Medium | High | High | Global |
| DuPont de Nemours, Inc. | High | High | High | Global |
| Kuraray Co., Ltd. | Low | High | Medium | Global |
| Thermax Limited | High | High | High | India, Europe, Americas and Southeast Asia |
| Ion Exchange (India) Limited | High | High | High | Asia, Middle East, Africa and international projects |
| Ecolab Inc. | High | High | High | Global |
| Xylem Inc. | High | High | High | Global |
| Kemira Oyj | Medium | High | High | Europe, North America and international sales |
Scoring basis: High technology breadth requires at least three documented treatment routes, Medium requires two and Low identifies one verified route. High application coverage requires drinking water, industrial water and wastewater evidence while Medium requires two settings and Low one. High support requires documented engineering plus operating service, Medium one support route and Low product supply without verified service depth.
Key Developments in the Nitrite Removal Chemicals Market
- In July 2026, DuPont launched multi-technology WAVE PRO design capability that integrates ultrafiltration, ion exchange resins, reverse osmosis and nanofiltration for water-treatment planning.
- In March 2026, Kuraray approved 12,300 tons per year of added reactivated-carbon capacity at Calgon Carbon’s Columbus plant for drinking-water applications.
- In September 2025, Ion Exchange (India) Limited began stage-wise commissioning of its 42,600 cubic-meter-per-year greenfield resin plant at Roha, starting with 3,696 cubic meters of capacity.
Key Players in the Nitrite Removal Chemicals Market
Ion Exchange and Separation Platforms
- LANXESS AG
- DuPont de Nemours, Inc.
- Ion Exchange (India) Limited
Integrated Water Treatment and Chemical Platforms
- Thermax Limited
- Ecolab Inc.
- Xylem Inc.
- Kemira Oyj
Adsorbent Media Specialist
- Kuraray Co., Ltd.
Nitrite Removal Chemicals Market - Report Scope
| Coverage field | Report scope |
|---|---|
| Market breakdown | By product type, form, application, end use, sales channel and region. |
| Quantitative Units | USD Million. |
| Market Definition | Commercial chemicals and consumable media specified to remove, bind or control nitrite in drinking water, aquaculture, industrial process water, wastewater polishing and aquarium treatment. |
| Regions Covered | North America, Latin America, Western Europe, Eastern Europe, East Asia, South Asia and Pacific and Middle East and Africa. |
| Countries Covered | Indonesia, Vietnam, Thailand, Brazil, Mexico, and 20+ countries included in the full report. |
| Key Companies Profiled | LANXESS AG, DuPont de Nemours, Inc., Kuraray Co., Ltd., Thermax Limited, Ion Exchange (India) Limited, Ecolab Inc., Xylem Inc., Kemira Oyj. |
| Forecast Period | 2026 to 2036. |
| Approach | Primary and secondary research with market triangulation. |
Nitrite Removal Chemicals Market - Research Methodology
| Method | Approach |
|---|---|
| Primary Research | FMI analysts gathered input from manufacturers, service providers, technology developers, distributors, end users, procurement teams, and subject-matter experts. Interviews examined purchasing decisions, product or service evaluation, adoption barriers, approval requirements, pricing considerations, and expectations for technical or commercial support. Respondents were also asked what evidence is required before a trial, pilot, or initial order develops into regular purchasing. |
| Desk Research | Desk research covered government statistics, regulatory publications, trade data, industry associations, technical literature, standards, company filings, product information, and official corporate announcements. Sources were reviewed for relevance, publication date, geographic coverage, and consistency with the defined market scope. Claims relating to performance, applications, approvals, capacity, investment, and commercial activity were retained only when supported by credible public evidence. |
| Market Sizing and Forecasting | The market model combined the baseline value with historical performance, segment structure, pricing and volume indicators, adoption levels, company participation, and country-level demand conditions. Forecast assumptions considered economic activity, investment trends, regulatory developments, technology adoption, purchasing cycles, supply availability, and barriers to wider market use. Segment and regional estimates were reconciled before the final market total was calculated. |
| Data Validation | Estimates were checked against multiple independent indicators, including public data, company activity, trade patterns, industry developments, and findings from primary interviews. Validation also tested whether products, services, applications, and company revenues fell within the defined market boundaries. Adjacent categories, unsupported claims, overlapping revenues, and activities without direct market relevance were excluded to reduce double counting and maintain consistency across segments and countries. |
Nitrite Removal Chemicals Market by Segments
Nitrite Removal Chemicals Market segmented by Product Type:
- Ion exchange media
- Biological nitrification aids
- Chemical reducing agents
- Adsorbent blends
- Aquaculture nitrite binders
Nitrite Removal Chemicals Market segmented by Form:
- Granular media
- Liquid treatment
- Powder
- Tablet / sachet
Nitrite Removal Chemicals Market segmented by Application:
- Drinking water treatment
- Aquaculture ponds
- Industrial process water
- Wastewater polishing
- Aquarium treatment
Nitrite Removal Chemicals Market segmented by End Use:
- Municipal utilities
- Aquaculture farms
- Industrial facilities
- Residential / commercial filtration
- Retail aquarium channel
Nitrite Removal Chemicals Market segmented by Sales Channel:
- Water treatment distributors
- Direct utility supply
- Aquaculture input dealers
- Retail / e-commerce
Nitrite Removal Chemicals Market by Region:
- North America
- United States
- Canada
- Latin America
- Brazil
- Mexico
- Argentina
- Chile
- Western Europe
- Germany
- France
- United Kingdom
- Italy
- Spain
- Benelux
- Nordics
- Eastern Europe
- Poland
- Czech Republic
- Romania
- Hungary
- East Asia
- China
- Japan
- South Korea
- South Asia and Pacific
- India
- ASEAN
- Australia and New Zealand
- Middle East and Africa
- GCC Countries
- South Africa
- Türkiye
- Israel
Research Sources and Bibliography
- Iowa Department of Natural Resources. (2026). Public Drinking Water Program 2025 Annual Compliance Report.
- National Statistics Office of Vietnam. (2026, January). Press release social-economic situation in the fourth quarter and 2025.
- LANXESS AG. (2025, March 10). Lewatit MDS TP 108 from LANXESS removes short-chain PFAS from water.
- Kemira Oyj. (2025, September 17). Kemira’s Activated Carbon Reactivation Plant in Helsingborg Approved - Site Celebrates 150 Years of Innovation.
- Minnesota Department of Health. (2026, May 14). Minnesota Drinking Water Annual Report for 2025.
- California State Water Resources Control Board. (2025, June 25). 2024 Annual Compliance Report: California Drinking Water Program.
- DuPont Water Solutions. (2025, September 16). DuPont Unveils Enhanced WAVE PRO Water Treatment Design Software with DuPont AmberLite Ion Exchange Resins Integration.
- Thermax Limited. (2025, July 31). Q1 FY26 Investor Presentation.
- Ministry of Marine Affairs and Fisheries, Republic of Indonesia. (2026, January 25). Laporan Kinerja Direktorat Jenderal Perikanan Budi Daya Tahun 2025.
- National Statistics Office of Vietnam. (2025, April). Press release socio-economic situation in the First quarter of 2025.
- Department of Fisheries, Thailand. (2025, July 29). Statistics of marine shrimp farm production.
- Ministry of Fisheries and Aquaculture, Brazil. (2026). Plano Nacional de Desenvolvimento Sustentável da Aquicultura.
- Comisión Nacional de Acuacultura y Pesca. (2026, January 5). Impulsa Conapesca desarrollo de actividad acuícola durante 2025.
- LANXESS AG. (2026, April 21). LANXESS at IFAT 2026: Filtration solutions for PFAS, phosphorus, micropollutants, and ultrapure water.
- Kuraray Co., Ltd. (2026, June 23). Held Management Briefing on Growth Opportunities in the Activated Carbon Business.
- Thermax Limited. (2026, May 7). 45th Annual Report 2025-26.
- Ion Exchange (India) Limited. (2025, August 13). 61st Annual Report 2024-25.
- Ecolab Inc. (2026, February 27). Annual Report 2025.
- Xylem Inc. (2026, February 25). 2025 Annual Report on Form 10-K.
- Kemira Oyj. (2026, February 10). Annual Report 2025.
- DuPont. (2026, July 9). DuPont Launches Multi-Technology Water Treatment Design Tool.
- Kuraray Co., Ltd. (2026, March 2). Kuraray to Expand Reactivated Carbon Production Capacity in the United States.
- Ion Exchange (India) Limited. (2025, September 30). Intimation of Commissioning and Commercialization of Greenfield Plant at Roha, Maharashtra.
- Veolia. (2025, June 19). Veolia Opens One of the Largest PFAS Treatment Plants in the USA
- Solenis LLC. (2025, November 3). Solenis confirms completion of the acquisition of NCH Corporation.
- LANXESS AG. (2026, May 5). PFAS Removal: LANXESS Selective Resin Proves Its Worth in Industrial Use.
- Kuraray Co., Ltd. and DOWA HOLDINGS CO., LTD. (2026, March 30). Kuraray and DOWA Ecosystem Begin Joint Study on Resource Circulation Business, Focusing on the Reactivation of Activated Carbon.
- Ecolab Inc. (2025, December 16). Ecolab Closes Acquisition of Ovivo’s Electronics Ultrapure Water Business.
- Xylem Inc. (2026, February 25). 2025 Annual Report on Form 10-K: acquisition of EnviroMix on July 23, 2025.
- Kemira Oyj. (2026, August 4). Kemira acquires REPUR S.r.l., strengthening its position in water treatment and circular solutions.
- DuPont Water Solutions. (2025, March 10). DuPont Water Solutions Launches WAVE PRO for Ultrafiltration Modeling.
This bibliography is provided for reader reference and is not exhaustive. The full report contains the complete reference list and detailed citations
This Report Answers
- How large is the nitrite removal chemicals market in 2026 and 2036?
- Which operating conditions convert a monitored nitrite problem into treatment spending?
- Why does ion exchange media account for 26.0% of product type demand in 2026?
- Why does granular media account for 38.0% of form demand in 2026?
- How does drinking water treatment shape application demand for nitrite removal chemicals?
- How do country growth rates differ among Indonesia, Vietnam, Thailand, Brazil and Mexico?
- Which companies provide ion exchange, adsorbent, chemical or integrated water-treatment platforms?
- What limits adoption if biological conversion or existing process control remains technically adequate?
Frequently Asked Questions
How big is the Nitrite Removal Chemicals Market in 2026?
The nitrite removal chemicals market is valued at USD 520.6 million in 2026 and is projected to reach USD 968.1 million by 2036. Compliance monitoring makes dedicated treatment purchasable once operators document a nitrite-control gap.
What is the CAGR of the Nitrite Removal Chemicals Market from 2026 to 2036?
The nitrite removal chemicals market is projected to grow at a CAGR of 6.4% between 2026 and 2036. The forecast reflects regulatory monitoring duties and recurring pond-treatment needs in intensive aquaculture operations.
Which product type leads the Nitrite Removal Chemicals Market?
The ion exchange media segment is expected to hold 26.0% of the nitrite removal chemicals market in 2026. Fixed-bed operation fits installed treatment vessels and allows planned media purchasing after site qualification.
Which form leads the Nitrite Removal Chemicals Market?
The granular media segment is expected to hold 38.0% of the nitrite removal chemicals market in 2026. Local inventory and reactivation routes enable repeat purchasing after treatment capacity is exhausted.
Which countries are projected to record the highest growth in the Nitrite Removal Chemicals Market?
Indonesia is projected to grow at 7.1% CAGR through 2036. Vietnam and Thailand follow at 6.8% and 6.5%, respectively. Intensive shrimp farming keeps water-quality intervention close to commercial farm operations and local treatment channels.
Which companies are active in the Nitrite Removal Chemicals Market?
Key companies operating in the nitrite removal chemicals market include LANXESS AG, DuPont de Nemours, Inc., Kuraray Co., Ltd., Thermax Limited, Ion Exchange (India) Limited, Ecolab Inc., Xylem Inc., and Kemira Oyj. Their competition rests on treatment breadth, manufacturing depth and technical service coverage.
Preview the report firsthand - request a free sample
Get SampleGet the brochure for pricing and purchase details.
Get PDFTable of Content
- Key Takeaways
- Market Size and CAGR
- Top Growth Driver
- Fastest Growing Segment
- Leading Region
- Key Companies
- Emerging Opportunities
- Executive Summary
- Global Market Outlook
- Demand-side Trends
- Supply-side Trends
- Technology Roadmap Analysis
- Analysis and Recommendations
- Analyst Perspective (What is happening? Why now? What should investors know?)
- Key Questions Answered
- How large is the market?
- What is the CAGR?
- What are key trends?
- Which region dominates?
- Who are the leaders?
- Market Overview
- Market Coverage / Taxonomy
- Market Definition / Scope / Limitations
- Research Methodology
- Chapter Orientation
- Analytical Lens and Working Hypotheses
- Market Structure, Signals, and Trend Drivers
- Benchmarking and Cross-market Comparability
- Market Sizing, Forecasting, and Opportunity Mapping
- Research Design and Evidence Framework
- Desk Research Programme (Secondary Evidence)
- Expert Input and Fieldwork (Primary Evidence)
- Tooling, Models, and Reference Databases
- Data Engineering and Model Build
- Quality Assurance and Audit Trail
- Market Background
- Market Dynamics (Drivers, Restraints, Opportunity, Trends)
- Scenario Forecast (Optimistic, Likely, Conservative)
- Impact Analysis
- AI Impact
- Sustainability Impact
- Regulatory Impact
- Technology Impact
- Consumer / Buyer Analysis
- Purchase Drivers
- Adoption Barriers
- Buyer Journey
- Opportunity Map Analysis
- Product Life Cycle Analysis
- Supply Chain Analysis
- Investment Feasibility Matrix
- Value Chain Analysis
- PESTLE and Porter's Analysis
- Regulatory Landscape
- Regional Parent Market Outlook
- Production and Consumption Statistics
- Import and Export Statistics
- Global Market Analysis and Forecast, 2021 to 2036
- Historical Market Size Value (USD Million) Analysis, 2021 to 2025
- Current and Future Market Size Value (USD Million) Projections, 2026 to 2036
- Y-o-Y Growth Trend Analysis
- Absolute $ Opportunity Analysis
- Global Market Pricing Analysis, 2021 to 2036
- Global Market Analysis and Forecast, By Product Type, 2021 to 2036
- Introduction / Key Findings
- Historical Market Size Value (USD Million) Analysis By Product Type, 2021 to 2025
- Current and Future Market Size Value (USD Million) Analysis and Forecast By Product Type, 2026 to 2036
- Ion exchange media
- Biological nitrification aids
- Chemical reducing agents
- Adsorbent blends
- Aquaculture nitrite binders
- Ion exchange media
- Y-o-Y Growth Trend Analysis By Product Type, 2021 to 2025
- Absolute $ Opportunity Analysis By Product Type, 2026 to 2036
- Global Market Analysis and Forecast, By Form, 2021 to 2036
- Introduction / Key Findings
- Historical Market Size Value (USD Million) Analysis By Form, 2021 to 2025
- Current and Future Market Size Value (USD Million) Analysis and Forecast By Form, 2026 to 2036
- Granular media
- Liquid treatment
- Powder
- Tablet / sachet
- Granular media
- Y-o-Y Growth Trend Analysis By Form, 2021 to 2025
- Absolute $ Opportunity Analysis By Form, 2026 to 2036
- Global Market Analysis and Forecast, By Application, 2021 to 2036
- Introduction / Key Findings
- Historical Market Size Value (USD Million) Analysis By Application, 2021 to 2025
- Current and Future Market Size Value (USD Million) Analysis and Forecast By Application, 2026 to 2036
- Drinking water treatment
- Aquaculture ponds
- Industrial process water
- Wastewater polishing
- Aquarium treatment
- Drinking water treatment
- Y-o-Y Growth Trend Analysis By Application, 2021 to 2025
- Absolute $ Opportunity Analysis By Application, 2026 to 2036
- Global Market Analysis and Forecast, By End Use, 2021 to 2036
- Introduction / Key Findings
- Historical Market Size Value (USD Million) Analysis By End Use, 2021 to 2025
- Current and Future Market Size Value (USD Million) Analysis and Forecast By End Use, 2026 to 2036
- Municipal utilities
- Aquaculture farms
- Industrial facilities
- Residential / commercial filtration
- Retail aquarium channel
- Municipal utilities
- Y-o-Y Growth Trend Analysis By End Use, 2021 to 2025
- Absolute $ Opportunity Analysis By End Use, 2026 to 2036
- Global Market Analysis and Forecast, By Sales Channel, 2021 to 2036
- Introduction / Key Findings
- Historical Market Size Value (USD Million) Analysis By Sales Channel, 2021 to 2025
- Current and Future Market Size Value (USD Million) Analysis and Forecast By Sales Channel, 2026 to 2036
- Water treatment distributors
- Direct utility supply
- Aquaculture input dealers
- Retail / e-commerce
- Water treatment distributors
- Y-o-Y Growth Trend Analysis By Sales Channel, 2021 to 2025
- Absolute $ Opportunity Analysis By Sales Channel, 2026 to 2036
- Global Market Analysis and Forecast, By Region, 2021 to 2036
- Introduction
- Historical Market Size Value (USD Million) Analysis By Region, 2021 to 2025
- Current Market Size Value (USD Million) Analysis and Forecast By Region, 2026 to 2036
- North America
- Latin America
- Western Europe
- Eastern Europe
- East Asia
- South Asia and Pacific
- Middle East & Africa
- Market Attractiveness Analysis By Region
- North America Market Analysis and Forecast, By Country, 2021 to 2036
- Historical Market Size Value (USD Million) Trend Analysis By Market Taxonomy, 2021 to 2025
- Market Size Value (USD Million) Forecast By Market Taxonomy, 2026 to 2036
- By Country
- USA
- Canada
- By Product Type
- By Form
- By Application
- By End Use
- By Sales Channel
- By Country
- Market Attractiveness Analysis
- By Country
- By Product Type
- By Form
- By Application
- By End Use
- By Sales Channel
- Key Takeaways
- Latin America Market Analysis and Forecast, By Country
- Historical Market Size Value (USD Million) Trend Analysis By Market Taxonomy, 2021 to 2025
- Market Size Value (USD Million) Forecast By Market Taxonomy, 2026 to 2036
- By Country
- Brazil
- Mexico
- Chile
- Rest of Latin America
- By Product Type
- By Form
- By Application
- By End Use
- By Sales Channel
- By Country
- Market Attractiveness Analysis
- By Country
- By Product Type
- By Form
- By Application
- By End Use
- By Sales Channel
- Key Takeaways
- Western Europe Market Analysis and Forecast, By Country
- Historical Market Size Value (USD Million) Trend Analysis By Market Taxonomy, 2021 to 2025
- Market Size Value (USD Million) Forecast By Market Taxonomy, 2026 to 2036
- By Country
- Germany
- UK
- Italy
- Spain
- France
- Nordic
- BENELUX
- Rest of Western Europe
- By Product Type
- By Form
- By Application
- By End Use
- By Sales Channel
- By Country
- Market Attractiveness Analysis
- By Country
- By Product Type
- By Form
- By Application
- By End Use
- By Sales Channel
- Key Takeaways
- Eastern Europe Market Analysis and Forecast, By Country
- Historical Market Size Value (USD Million) Trend Analysis By Market Taxonomy, 2021 to 2025
- Market Size Value (USD Million) Forecast By Market Taxonomy, 2026 to 2036
- By Country
- Russia
- Poland
- Hungary
- Balkan & Baltic
- Rest of Eastern Europe
- By Product Type
- By Form
- By Application
- By End Use
- By Sales Channel
- By Country
- Market Attractiveness Analysis
- By Country
- By Product Type
- By Form
- By Application
- By End Use
- By Sales Channel
- Key Takeaways
- East Asia Market Analysis and Forecast, By Country
- Historical Market Size Value (USD Million) Trend Analysis By Market Taxonomy, 2021 to 2025
- Market Size Value (USD Million) Forecast By Market Taxonomy, 2026 to 2036
- By Country
- China
- Japan
- South Korea
- By Product Type
- By Form
- By Application
- By End Use
- By Sales Channel
- By Country
- Market Attractiveness Analysis
- By Country
- By Product Type
- By Form
- By Application
- By End Use
- By Sales Channel
- Key Takeaways
- South Asia and Pacific Market Analysis and Forecast, By Country
- Historical Market Size Value (USD Million) Trend Analysis By Market Taxonomy, 2021 to 2025
- Market Size Value (USD Million) Forecast By Market Taxonomy, 2026 to 2036
- By Country
- India
- ASEAN
- Australia & New Zealand
- Rest of South Asia and Pacific
- By Product Type
- By Form
- By Application
- By End Use
- By Sales Channel
- By Country
- Market Attractiveness Analysis
- By Country
- By Product Type
- By Form
- By Application
- By End Use
- By Sales Channel
- Key Takeaways
- Middle East & Africa Market Analysis and Forecast, By Country
- Historical Market Size Value (USD Million) Trend Analysis By Market Taxonomy, 2021 to 2025
- Market Size Value (USD Million) Forecast By Market Taxonomy, 2026 to 2036
- By Country
- Kingdom of Saudi Arabia
- Other GCC Countries
- Türkiye
- South Africa
- Other African Union
- Rest of Middle East & Africa
- By Product Type
- By Form
- By Application
- By End Use
- By Sales Channel
- By Country
- Market Attractiveness Analysis
- By Country
- By Product Type
- By Form
- By Application
- By End Use
- By Sales Channel
- Key Takeaways
- Key Countries Market Analysis
- USA
- Pricing Analysis
- Market Share Analysis, 2025
- By Product Type
- By Form
- By Application
- By End Use
- By Sales Channel
- Canada
- Pricing Analysis
- Market Share Analysis, 2025
- By Product Type
- By Form
- By Application
- By End Use
- By Sales Channel
- Mexico
- Pricing Analysis
- Market Share Analysis, 2025
- By Product Type
- By Form
- By Application
- By End Use
- By Sales Channel
- Brazil
- Pricing Analysis
- Market Share Analysis, 2025
- By Product Type
- By Form
- By Application
- By End Use
- By Sales Channel
- Chile
- Pricing Analysis
- Market Share Analysis, 2025
- By Product Type
- By Form
- By Application
- By End Use
- By Sales Channel
- Germany
- Pricing Analysis
- Market Share Analysis, 2025
- By Product Type
- By Form
- By Application
- By End Use
- By Sales Channel
- UK
- Pricing Analysis
- Market Share Analysis, 2025
- By Product Type
- By Form
- By Application
- By End Use
- By Sales Channel
- Italy
- Pricing Analysis
- Market Share Analysis, 2025
- By Product Type
- By Form
- By Application
- By End Use
- By Sales Channel
- Spain
- Pricing Analysis
- Market Share Analysis, 2025
- By Product Type
- By Form
- By Application
- By End Use
- By Sales Channel
- France
- Pricing Analysis
- Market Share Analysis, 2025
- By Product Type
- By Form
- By Application
- By End Use
- By Sales Channel
- India
- Pricing Analysis
- Market Share Analysis, 2025
- By Product Type
- By Form
- By Application
- By End Use
- By Sales Channel
- ASEAN
- Pricing Analysis
- Market Share Analysis, 2025
- By Product Type
- By Form
- By Application
- By End Use
- By Sales Channel
- Australia & New Zealand
- Pricing Analysis
- Market Share Analysis, 2025
- By Product Type
- By Form
- By Application
- By End Use
- By Sales Channel
- China
- Pricing Analysis
- Market Share Analysis, 2025
- By Product Type
- By Form
- By Application
- By End Use
- By Sales Channel
- Japan
- Pricing Analysis
- Market Share Analysis, 2025
- By Product Type
- By Form
- By Application
- By End Use
- By Sales Channel
- South Korea
- Pricing Analysis
- Market Share Analysis, 2025
- By Product Type
- By Form
- By Application
- By End Use
- By Sales Channel
- Russia
- Pricing Analysis
- Market Share Analysis, 2025
- By Product Type
- By Form
- By Application
- By End Use
- By Sales Channel
- Poland
- Pricing Analysis
- Market Share Analysis, 2025
- By Product Type
- By Form
- By Application
- By End Use
- By Sales Channel
- Hungary
- Pricing Analysis
- Market Share Analysis, 2025
- By Product Type
- By Form
- By Application
- By End Use
- By Sales Channel
- Kingdom of Saudi Arabia
- Pricing Analysis
- Market Share Analysis, 2025
- By Product Type
- By Form
- By Application
- By End Use
- By Sales Channel
- Türkiye
- Pricing Analysis
- Market Share Analysis, 2025
- By Product Type
- By Form
- By Application
- By End Use
- By Sales Channel
- South Africa
- Pricing Analysis
- Market Share Analysis, 2025
- By Product Type
- By Form
- By Application
- By End Use
- By Sales Channel
- USA
- Market Structure Analysis
- Competition Dashboard
- Competition Benchmarking
- Market Share Analysis of Top Players
- By Regional
- By Product Type
- By Form
- By Application
- By End Use
- By Sales Channel
- Emerging Startups
- Innovation Benchmarking
- Competition Analysis
- Competition Deep Dive
- Evoqua / Xylem
- Overview
- Product Portfolio
- Profitability by Market Segments
- Sales Footprint
- Strategy Overview
- Marketing Strategy
- Product Strategy
- Channel Strategy
- Purolite / Ecolab
- LANXESS
- Jacobi Carbons
- Pentair
- Seachem Laboratories
- API / Mars Fishcare
- Kuraray
- AquaSorb
- Thermax
- Evoqua / Xylem
- Case Studies
- Success Stories
- Recent Developments
- Competition Deep Dive
- Assumptions & Acronyms Used


