No-Aldehyde Acid Fixing Agent Market Forecast and Outlook 2025 to 2035

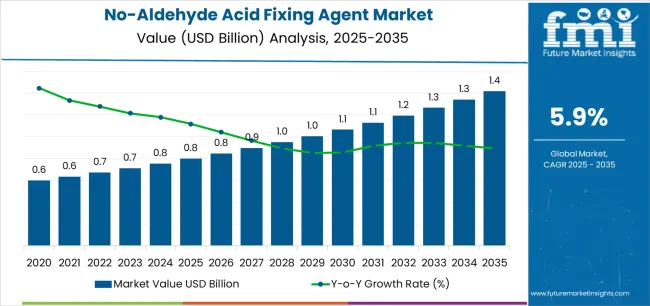
The no-aldehyde acid fixing agent market is valued at USD 0.8 billion in 2025 and is projected to reach USD 1.3 billion by 2035, registering a CAGR of 5.9%. Market growth is influenced by the increasing demand for eco-friendly textile processing chemicals and tightening environmental regulations on formaldehyde emissions. The textile industry’s shift toward sustainable dyeing and finishing operations continues to drive the adoption of non-aldehyde formulations that ensure color fastness and fabric integrity without releasing harmful volatile compounds.

Fixing agents with a pH value range of 1.5–3.5 represent the leading segment due to their high effectiveness in improving dye retention, brightness, and washing durability in both cotton and blended fabrics. These formulations are compatible with a wide range of reactive and direct dyes, offering stable performance in acidic dye baths. The transition from formaldehyde-based products to biodegradable, non-toxic alternatives aligns with global efforts to enhance worker safety and reduce wastewater impact.

Asia Pacific remains the dominant growth region, supported by expanding textile production in China, India, and Bangladesh. Europe and North America sustain demand through stricter chemical safety standards and adoption of green chemistry initiatives. Key players include PROTEX, Matex Bangladesh, Piedmont Chemical Industries, Achitex Minerva, NICCA, and Avocet Dye & Chemical, emphasizing product innovation, compliance, and sustainable textile chemistry.
Quick Stats for No-Aldehyde Acid Fixing Agent Market

  • No-Aldehyde Acid Fixing Agent Market Value (2025): USD 0.8 billion
  • No-Aldehyde Acid Fixing Agent Market Forecast Value (2035): USD 1.3 billion
  • No-Aldehyde Acid Fixing Agent Market Forecast CAGR: 5.9%
  • Leading Type in No-Aldehyde Acid Fixing Agent Market: pH Value 1.5–3.5
  • Key Growth Regions in No-Aldehyde Acid Fixing Agent Market: Asia Pacific, Europe, North America
  • Top Players in No-Aldehyde Acid Fixing Agent Market: PROTEX, Matex Bangladesh, Piedmont Chemical Industries, Achitex Minerva, NICCA, Avocet Dye & Chemical, Sarex Chemicals, HT Fine Chemical, Dymatic Chemicals, GuangDong Kefeng New Material Technology

No Aldehyde Acid Fixing Agent Market Market Value Analysis

The no-aldehyde acid fixing agent market is projected to increase from USD 0.8 billion in 2025 to USD 1.3 billion by 2035, registering a CAGR of 5.9%. The market’s acceleration and deceleration pattern indicates a balanced growth trajectory shaped by environmental compliance trends and textile processing advancements. From 2025 to 2029, an initial acceleration phase is expected as textile manufacturers adopt non-toxic and formaldehyde-free fixing agents to meet stricter environmental regulations and consumer demand for sustainable fabrics. This period will show faster adoption rates, supported by the substitution of aldehyde-based chemicals in dyeing applications.

Between 2030 and 2035, growth is expected to enter a mild deceleration phase as the market matures and replacement demand stabilizes. The deceleration will stem from saturation in developed markets, where largest textile producers will have already completed the transition to no-aldehyde formulations. Despite the slower pace, steady demand from emerging economies in Asia-Pacific and Latin America will maintain market stability. Continuous innovation in eco-friendly formulations and improved compatibility with reactive dyes will prevent sharp slowdowns, resulting in a controlled and sustainable long-term expansion pattern.

No-Aldehyde Acid Fixing Agent Market Key Takeaways

Metric Value
Market Value (2025) USD 0.8 billion
Market Forecast Value (2035) USD 1.3 billion
Forecast CAGR (2025-2035) 5.9%

Why is the No-Aldehyde Acid Fixing Agent Market Growing?

The no-aldehyde acid fixing agent market is expanding as textile, home-furnishing and automotive-interior manufacturers increasingly adopt safer chemical solutions to meet stricter regulatory frameworks and consumer demand for low-emission finishes. Traditional acid-fixing agents often rely on formaldehyde-based compounds, which raise concerns about indoor air quality, worker exposure and environmental compliance. Non-aldehyde alternatives provide similar fixation and dye-fastness performance while reducing formaldehyde emission and associated health risks. Concurrently, the growing global textile industry and rising demand for high-quality, durable fabricated goods drive greater usage of advanced fixing agents. Ecofriendly chemistry initiatives and eco-label certifications encourage buyers to switch to non-aldehyde acid fixing formulations. The market is constrained by higher formulation and manufacturing costs relative to conventional agents, variation in performance across substrates, and slower adoption in regions with less stringent regulatory enforcement or limited awareness of conventional-chemical risks.

Which Classification and Application Segments Lead the No-Aldehyde Acid Fixing Agent Market?

The no-aldehyde acid fixing agent market is segmented by classification and application. By classification, the market is divided into pH value: 1.5–3.5 and pH value: 5.0–7.0. Based on application, it is categorized into clothing, home textiles, automotive interiors, and other industrial textile uses. Regionally, the market is divided into Asia Pacific, Europe, North America, and other key regions.

By Classification, the pH Value: 1.5–3.5 Segment Accounts for the Largest Market Share
No Aldehyde Acid Fixing Agent Market Analysis By Classification

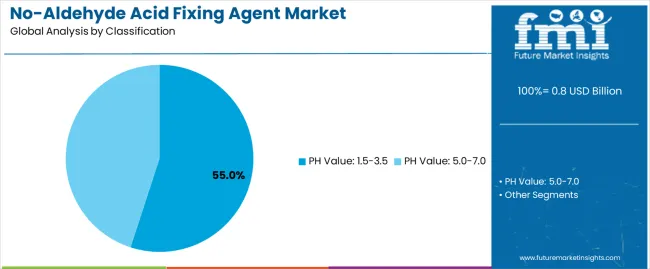
The pH value: 1.5-3.5 segment holds the dominant position in the no-aldehyde acid fixing agent market, representing approximately 55.0% of the total share in 2025. This classification is preferred in dyeing and finishing processes due to its strong color fixation performance, compatibility with reactive dyes, and ability to maintain shade stability under acidic conditions. Agents within this pH range are widely adopted in textile finishing operations requiring high color fastness, reduced formaldehyde emissions, and compliance with environmental standards.

The segment’s leadership is supported by increased utilization in high-quality dyeing operations, especially in apparel and home textile manufacturing, where consistent dye retention and eco-compliant processing are critical. The pH 5.0–7.0 category is used in applications demanding milder fixation conditions or specific fiber compatibility, though it represents a smaller share due to narrower performance stability under industrial dyeing environments.

Key factors supporting the pH 1.5–3.5 segment include:
  • Superior fixation efficiency enhancing dye fastness and color depth.
  • Compliance with environmental and safety standards limiting aldehyde-based agents.
  • Broad applicability across cotton, polyester, and blended fabrics.
  • Consistent performance in large-scale, high-speed textile dyeing operations.

By Application, the Clothing Segment Represents the Dominant Market Category

No Aldehyde Acid Fixing Agent Market Analysis By Application

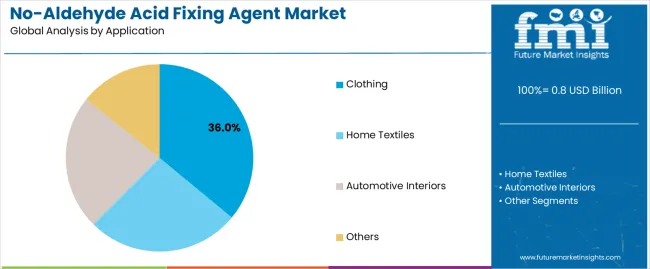
The clothing segment accounts for approximately 36.0% of the no-aldehyde acid fixing agent market in 2025. This share reflects the widespread use of these agents in apparel manufacturing, where color stability, wash resistance, and eco-friendly finishing are essential. The demand is driven by textile producers’ efforts to meet international safety certifications and reduce formaldehyde levels in finished garments, particularly in export-oriented production.

Home textiles form the second-largest application area, supported by the need for durable color retention in products such as curtains, bed linens, and upholstery fabrics. Automotive interiors represent a smaller but emerging segment, where these agents contribute to maintaining color consistency and minimizing volatile organic compound (VOC) emissions in vehicle cabins.

Primary dynamics driving demand from the clothing segment include:

  • Expanding global apparel production requiring environmentally compliant textile auxiliaries.
  • Rising consumer demand for low-emission, skin-safe fabric finishing agents.
  • Implementation of strict textile chemical management regulations across manufacturing hubs.
  • Continuous improvement in formaldehyde-free fixation chemistry ensuring long-term color durability.

What are the Drivers, Restraints, and Key Trends of the No-Aldehyde Acid Fixing Agent Market?

Stricter environmental regulations, rising textile finishing demand, and growth in eco-safe chemical adoption.

The market for no-aldehyde acid fixing agents is driven by increasingly stringent environmental and health regulations targeting formaldehyde emissions and volatile organic compounds (VOCs), which compel textile and furnishing manufacturers to adopt alternatives. Growing demand for high-quality textile finishes, including home textiles, apparel and automotive interiors, supports uptake of acid-fixing agents that enhance wash and rub fastness. The shift toward ecofriendly and eco-friendly textile processing techniques fosters the use of “no-aldehyde” or low-formaldehyde chemical systems, thereby expanding the market for acid-fixing agents designed for dye fixation in acid-dye applications.

High formulation costs, limited performance in legacy systems, and slow conversion in developing regions.

Higher cost of specialty no-aldehyde acid fixing agents relative to traditional formaldehyde-based fixatives reduces margin and slows conversion, particularly in price-sensitive developing markets. Some existing textile finishing lines are optimized for conventional fixatives, making performance parity and process adaptation a barrier for switching to no-aldehyde agents. Infrastructure limitations and lack of chemical process awareness in emerging textile hubs limit adoption rate and inhibit market penetration in certain geographies.

Expansion in Asia-Pacific textile hubs, innovation in bio-based formulations, and growth of retrofit finishing lines.

Regionally, Asia-Pacific is emerging as the fastest-growing market, driven by large textile finishing capacity in India, Bangladesh, Vietnam and China, and growing demand for ecofriendly credentials. Chemical manufacturers are increasingly developing bio-based and non-formaldehyde acid-fixing agents, enhancing performance without aldehyde generation. Retrofit of existing finishing lines with eco-compliant chemicals is gaining traction, accelerating migration toward no-aldehyde systems as ecofriendly certifications become more influential in supply chains.

Analysis of the No-Aldehyde Acid Fixing Agent Market by Key Country

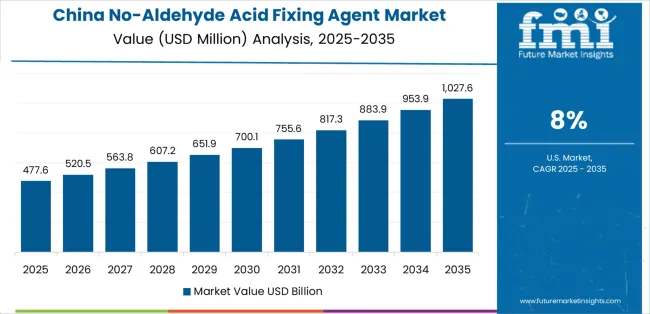
The global no-aldehyde acid fixing agent market is expanding steadily through 2035, driven by increased adoption of eco-friendly textile processing chemicals, regulatory restrictions on formaldehyde, and growing demand for ecofriendly dye-fixation solutions. China leads with a 8.0% CAGR, followed by India at 7.4%, reflecting strong textile manufacturing capacity and environmental compliance initiatives. Germany grows at 6.8%, supported by green chemistry innovation and advanced textile technology. Brazil, at 6.2%, benefits from rising textile exports and process modernization. The United States records 5.6%, driven by industrial reformulation efforts. The United Kingdom (5.0%) and Japan (4.4%) maintain steady growth through ecofriendly-driven manufacturing and R&D investments.
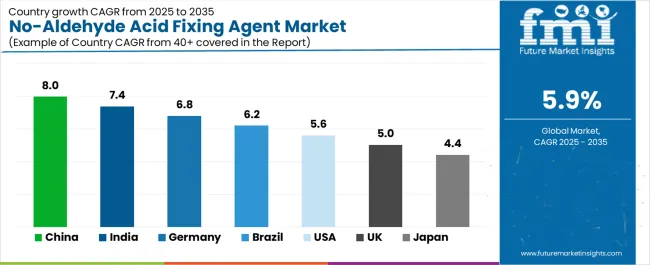
No Aldehyde Acid Fixing Agent Market Cagr Analysis By Country

Country CAGR (%)
China 8.0
India 7.4
Germany 6.8
Brazil 6.2
U.S. 5.6
U.K. 5.0
Japan 4.4

How is China leading the No-Aldehyde Acid Fixing Agent Market?

No Aldehyde Acid Fixing Agent Market Country Value Analysis

China’s market grows at 8.0% CAGR, supported by its large-scale textile production and government-driven chemical regulation reforms. Growing restrictions on formaldehyde-based fixing agents under national environmental standards have accelerated the adoption of no-aldehyde formulations. Domestic chemical producers are developing acid-based fixing agents with improved dye affinity and wash durability. Major textile hubs such as Zhejiang, Jiangsu, and Guangdong are modernizing processing systems to align with green manufacturing practices. Export-oriented dyeing and finishing facilities are upgrading to no-aldehyde solutions to meet global compliance requirements. Collaboration between universities and chemical firms is promoting research in bio-based textile auxiliaries.

Key Market Factors:

  • Policy restrictions on formaldehyde-based textile chemicals
  • Expansion of ecofriendly textile production in major industrial clusters
  • Development of bio-based and high-performance acid fixing agents
  • Increasing adoption of eco-compliant auxiliaries in export-oriented manufacturing

How is India expanding its No-Aldehyde Acid Fixing Agent Market?

India’s market grows at 7.4% CAGR, driven by textile sector modernization and environmental compliance mandates. The government’s initiatives to promote green chemistry under the Zero Discharge of Hazardous Chemicals (ZDHC) framework are encouraging mills to replace aldehyde-based fixatives. Domestic manufacturers are producing cost-effective no-aldehyde acid fixing agents for cotton and blended fabrics. Rising demand for export-quality textiles, especially in apparel and home furnishings, supports adoption across dyeing units in Tirupur, Surat, and Ludhiana. Collaborations with chemical technology providers are improving product formulation and operational consistency. Increased focus on water conservation is promoting the use of low-residue fixing agents.

Market Development Factors:

  • Implementation of ZDHC and REACH-compliant textile chemistry standards
  • Expansion of export-driven textile production across key clusters
  • Localization of eco-friendly dye-fixing chemical manufacturing
  • Collaboration between dye houses and chemical suppliers for process optimization

How is Germany driving innovation in the No-Aldehyde Acid Fixing Agent Market?

No Aldehyde Acid Fixing Agent Market Europe Country Market Share Analysis, 2025 & 2035

Germany’s market grows at 6.8% CAGR, supported by advanced R&D in ecofriendly textile chemistry and high regulatory standards. The country’s chemical manufacturers are pioneering formaldehyde-free fixing agents with enhanced fabric fastness and low wastewater load. Textile processors are adopting high-efficiency formulations to reduce effluent toxicity and improve dye uptake. Germany’s integration of circular textile production and closed-loop water treatment supports chemical durability. Research partnerships between universities and chemical companies continue to focus on biodegradable and non-toxic auxiliaries. The strong presence of specialty chemical producers ensures reliable supply of certified eco-compliant formulations for textile applications.

Key Market Characteristics:

  • Innovation in formaldehyde-free and biodegradable textile auxiliaries
  • Integration of ecofriendly and circular production frameworks
  • Stringent EU compliance promoting safe chemical formulation standards
  • Collaboration between R&D institutions and specialty chemical firms

How is Brazil growing its No-Aldehyde Acid Fixing Agent Market?

Brazil’s market grows at 6.2% CAGR, supported by the textile industry’s transition toward green processing and export competitiveness. Local manufacturers are reformulating fixing agents to eliminate formaldehyde and improve compatibility with reactive and direct dyes. The adoption of eco-certified products is expanding among textile clusters in São Paulo and Santa Catarina. Government initiatives promoting low-impact chemical manufacturing are reinforcing market growth. Collaborations with European suppliers provide access to advanced formulations suited for tropical processing conditions. The market’s expansion is linked to demand for environmentally responsible finishing chemicals across apparel and industrial textile segments.

Market Development Factors:

  • Increasing adoption of eco-certified and formaldehyde-free textile chemicals
  • Growth in export-focused textile production adopting ecofriendly chemistry
  • Collaboration with European chemical suppliers for high-performance agents
  • Policy initiatives supporting green chemical and wastewater management programs

How is the United States advancing its No-Aldehyde Acid Fixing Agent Market?

The United States records 5.6% CAGR, driven by ecofriendly compliance and innovation in textile chemistry. The shift toward formaldehyde-free formulations aligns with the Environmental Protection Agency (EPA) and consumer safety standards. Domestic specialty chemical firms are developing multifunctional fixing agents enhancing color retention and wet fastness. The adoption of advanced dye-fixing technologies in textile and nonwoven manufacturing supports demand. The market benefits from increasing focus on eco-labeling and transparent supply chains. Research initiatives in polymer chemistry are also producing low-VOC and biodegradable agents designed for performance and environmental compliance.

Key Market Factors:

  • Regulatory compliance with EPA and consumer product safety standards
  • Expansion of ecofriendly chemical portfolios by domestic manufacturers
  • Growth in eco-label adoption across textile and apparel industries
  • Ongoing R&D in low-VOC and biodegradable textile fixing agents

How is the United Kingdom supporting its No-Aldehyde Acid Fixing Agent Market?

The United Kingdom’s market grows at 5.0% CAGR, supported by regulatory alignment with European ecofriendly standards and increasing demand for green textile solutions. Textile chemical suppliers are focusing on REACH-compliant and non-toxic formulations. The country’s apparel and technical textile industries are adopting no-aldehyde fixing agents to meet eco-certification requirements. Collaboration between research institutions and chemical companies is improving process efficiency and dye fixation levels. The U.K.’s focus on responsible sourcing and green supply chains supports market expansion through environmentally conscious manufacturing programs.

Market Development Factors:
  • Regulatory focus on REACH-compliant and formaldehyde-free formulations
  • Growing demand for certified eco-friendly textile auxiliaries
  • R&D collaboration between chemical and textile innovation centers
  • Expansion of ecofriendly supply chain practices across textile production

How is Japan advancing the No-Aldehyde Acid Fixing Agent Market?

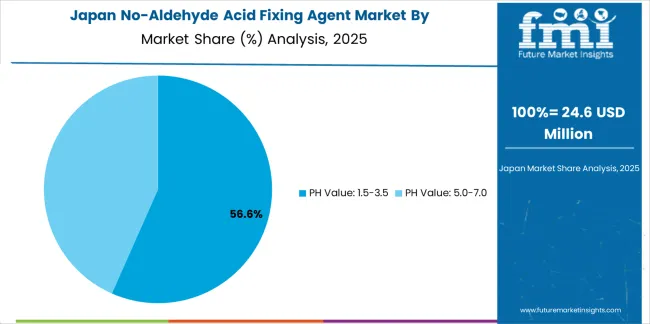
No Aldehyde Acid Fixing Agent Market Japan Market Share Analysis By Classification

Japan’s market grows at 4.4% CAGR, supported by its expertise in high-performance textile materials and clean chemical manufacturing. Domestic chemical firms are developing low-emission, non-formaldehyde fixatives for synthetic and blended fabrics. The integration of green manufacturing standards under the Green Innovation Fund supports process improvements across dyeing facilities. Research in polymer modification is improving dye bonding efficiency and reducing effluent load. The market benefits from continuous innovation in precision chemistry and textile auxiliaries that meet stringent environmental and quality standards. Japan’s mature textile sector ensures stable adoption of advanced, eco-friendly chemical solutions.

Market Characteristics:

  • Development of low-emission and polymer-modified no-aldehyde fixatives
  • Integration of green manufacturing standards across textile facilities
  • Research in high-performance and low-effluent dyeing chemistry
  • Consistent innovation ensuring compliance with advanced environmental norms

What is the competitive landscape of the No-Aldehyde Acid Fixing Agent Market?

The no-aldehyde acid fixing agent market is moderately fragmented, featuring around fifteen to twenty regional and multinational manufacturers engaged in textile chemical production. PROTEX leads the market with an estimated 14.0% global share, supported by its extensive textile auxiliary portfolio, proven formulation stability, and long-term supply relationships with apparel manufacturers and dyeing units. The company’s competitive advantage lies in sustained product innovation and environmental compliance with REACH and OEKO-TEX standards.

Matex Bangladesh, Piedmont Chemical Industries, and Achitex Minerva follow as strong mid-tier competitors with diversified product lines and regional manufacturing strength. Their competitiveness stems from process reliability, consistent color fastness outcomes, and strategic presence in Asia’s high-volume textile hubs. NICCA, Avocet Dye & Chemical, and Sarex Chemicals emphasize sustainable formulations and low-formaldehyde chemistry, aligning with global eco-textile trends and stricter discharge regulations.

Chinese producers such as Dymatic Chemicals, HT Fine Chemical, and GuangDong Kefeng New Material Technology drive competitive pricing through scale efficiencies and rapid product adaptation to local textile processing demands. Emerging players including Shandong IRO Polymer Chemicals, Zhejiang Hongda Chemicals, and Ningbo Aoxiang Fine Chemical contribute to regional supply resilience and export-oriented growth.

Competition is primarily defined by chemical stability, dye compatibility, and environmental performance rather than price alone. Market growth is supported by increasing demand for sustainable textile auxiliaries, driving innovation in eco-friendly, non-toxic, and high-performance fixing agent formulations across global textile finishing applications.
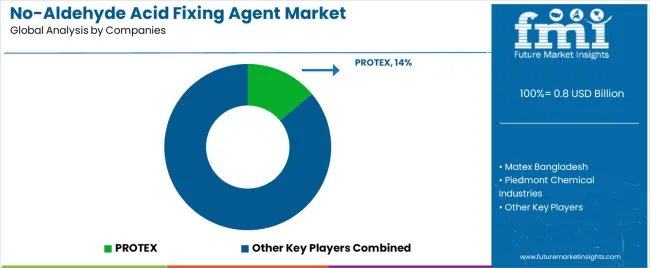
Key Players in the No-Aldehyde Acid Fixing Agent Market

No Aldehyde Acid Fixing Agent Market Analysis By Company

  • PROTEX
  • Matex Bangladesh
  • Piedmont Chemical Industries
  • Achitex Minerva
  • NICCA
  • Avocet Dye & Chemical
  • Sarex Chemicals
  • HT Fine Chemical
  • Dymatic Chemicals
  • HT&K Chemical
  • Starco Arochem
  • Yixing Cleanwater Chemicals
  • Zhejiang Hongda Chemicals
  • GuangDong Kefeng New Material Technology
  • Shandong IRO Polymer Chemicals
  • Shandong Tiancheng Chemical
  • Guangzhou Qiantai Chemical
  • Beijing Jingfang Detergent Products
  • Ningbo Aoxiang Fine Chemical

Scope of the Report

Items Values
Quantitative Units USD billion
Classification PH Value: 1.5–3.5, PH Value: 5.0–7.0
Application Clothing, Home Textiles, Automotive Interiors, Others
Regions Covered Asia Pacific, Europe, North America, Latin America, Middle East & Africa
Countries Covered India, China, USA, Germany, South Korea, Japan, Italy, and 40+ countries
Key Companies Profiled PROTEX, Matex Bangladesh, Piedmont Chemical Industries, Achitex Minerva, NICCA, Avocet Dye & Chemical, Sarex Chemicals, HT Fine Chemical, Dymatic Chemicals, HT&K Chemical, Starco Arochem
Additional Attributes Dollar sales by classification and application categories; regional adoption trends across Asia Pacific, Europe, and North America; competitive landscape of textile chemical and dye-fixing agent manufacturers; advancements in eco-friendly, no-aldehyde formulations; integration with sustainable textile processing and green chemistry initiatives.

No-Aldehyde Acid Fixing Agent Market by Segments

Classification:

  • PH Value: 1.5-3.5
  • PH Value: 5.0-7.0

Application:

  • Clothing
  • Home Textiles
  • Automotive Interiors
  • Others

Region:

  • Asia Pacific
    • China
    • Japan
    • South Korea
    • India
    • Australia & New Zealand
    • ASEAN
    • Rest of Asia Pacific
  • Europe
    • Germany
    • United Kingdom
    • France
    • Italy
    • Spain
    • Nordic
    • BENELUX
    • Rest of Europe
  • North America
    • United States
    • Canada
    • Mexico
  • Latin America
    • Brazil
    • Chile
    • Rest of Latin America
  • Middle East & Africa
    • Kingdom of Saudi Arabia
    • Other GCC Countries
    • Turkey
    • South Africa
    • Other African Union
    • Rest of Middle East & Africa

Frequently Asked Questions

How big is the no-aldehyde acid fixing agent market in 2025?

The global no-aldehyde acid fixing agent market is estimated to be valued at USD 0.8 billion in 2025.

What will be the size of no-aldehyde acid fixing agent market in 2035?

The market size for the no-aldehyde acid fixing agent market is projected to reach USD 1.4 billion by 2035.

How much will be the no-aldehyde acid fixing agent market growth between 2025 and 2035?

The no-aldehyde acid fixing agent market is expected to grow at a 5.9% CAGR between 2025 and 2035.

What are the key product types in the no-aldehyde acid fixing agent market?

The key product types in no-aldehyde acid fixing agent market are ph value: 1.5-3.5 and ph value: 5.0-7.0.

Which application segment to contribute significant share in the no-aldehyde acid fixing agent market in 2025?

In terms of application, clothing segment to command 36.0% share in the no-aldehyde acid fixing agent market in 2025.

Table of Content

  1. Executive Summary
    • Global Market Outlook
    • Demand to side Trends
    • Supply to side Trends
    • Technology Roadmap Analysis
    • Analysis and Recommendations
  2. Market Overview
    • Market Coverage / Taxonomy
    • Market Definition / Scope / Limitations
  3. Market Background
    • Market Dynamics
      • Drivers
      • Restraints
      • Opportunity
      • Trends
    • Scenario Forecast
      • Demand in Optimistic Scenario
      • Demand in Likely Scenario
      • Demand in Conservative Scenario
    • Opportunity Map Analysis
    • Product Life Cycle Analysis
    • Supply Chain Analysis
    • Investment Feasibility Matrix
    • Value Chain Analysis
    • PESTLE and Porter’s Analysis
    • Regulatory Landscape
    • Regional Parent Market Outlook
    • Production and Consumption Statistics
    • Import and Export Statistics
  4. Global Market Analysis 2020 to 2024 and Forecast, 2025 to 2035
    • Historical Market Size Value (USD Million) Analysis, 2020 to 2024
    • Current and Future Market Size Value (USD Million) Projections, 2025 to 2035
      • Y to o to Y Growth Trend Analysis
      • Absolute $ Opportunity Analysis
  5. Global Market Pricing Analysis 2020 to 2024 and Forecast 2025 to 2035
  6. Global Market Analysis 2020 to 2024 and Forecast 2025 to 2035, By Classification
    • Introduction / Key Findings
    • Historical Market Size Value (USD Million) Analysis By Classification , 2020 to 2024
    • Current and Future Market Size Value (USD Million) Analysis and Forecast By Classification , 2025 to 2035
      • PH Value: 1.5-3.5
      • PH Value: 5.0-7.0
    • Y to o to Y Growth Trend Analysis By Classification , 2020 to 2024
    • Absolute $ Opportunity Analysis By Classification , 2025 to 2035
  7. Global Market Analysis 2020 to 2024 and Forecast 2025 to 2035, By Application
    • Introduction / Key Findings
    • Historical Market Size Value (USD Million) Analysis By Application, 2020 to 2024
    • Current and Future Market Size Value (USD Million) Analysis and Forecast By Application, 2025 to 2035
      • Clothing
      • Home Textiles
      • Automotive Interiors
      • Others
    • Y to o to Y Growth Trend Analysis By Application, 2020 to 2024
    • Absolute $ Opportunity Analysis By Application, 2025 to 2035
  8. Global Market Analysis 2020 to 2024 and Forecast 2025 to 2035, By Region
    • Introduction
    • Historical Market Size Value (USD Million) Analysis By Region, 2020 to 2024
    • Current Market Size Value (USD Million) Analysis and Forecast By Region, 2025 to 2035
      • North America
      • Latin America
      • Western Europe
      • Eastern Europe
      • East Asia
      • South Asia and Pacific
      • Middle East & Africa
    • Market Attractiveness Analysis By Region
  9. North America Market Analysis 2020 to 2024 and Forecast 2025 to 2035, By Country
    • Historical Market Size Value (USD Million) Trend Analysis By Market Taxonomy, 2020 to 2024
    • Market Size Value (USD Million) Forecast By Market Taxonomy, 2025 to 2035
      • By Country
        • USA
        • Canada
        • Mexico
      • By Classification
      • By Application
    • Market Attractiveness Analysis
      • By Country
      • By Classification
      • By Application
    • Key Takeaways
  10. Latin America Market Analysis 2020 to 2024 and Forecast 2025 to 2035, By Country
    • Historical Market Size Value (USD Million) Trend Analysis By Market Taxonomy, 2020 to 2024
    • Market Size Value (USD Million) Forecast By Market Taxonomy, 2025 to 2035
      • By Country
        • Brazil
        • Chile
        • Rest of Latin America
      • By Classification
      • By Application
    • Market Attractiveness Analysis
      • By Country
      • By Classification
      • By Application
    • Key Takeaways
  11. Western Europe Market Analysis 2020 to 2024 and Forecast 2025 to 2035, By Country
    • Historical Market Size Value (USD Million) Trend Analysis By Market Taxonomy, 2020 to 2024
    • Market Size Value (USD Million) Forecast By Market Taxonomy, 2025 to 2035
      • By Country
        • Germany
        • UK
        • Italy
        • Spain
        • France
        • Nordic
        • BENELUX
        • Rest of Western Europe
      • By Classification
      • By Application
    • Market Attractiveness Analysis
      • By Country
      • By Classification
      • By Application
    • Key Takeaways
  12. Eastern Europe Market Analysis 2020 to 2024 and Forecast 2025 to 2035, By Country
    • Historical Market Size Value (USD Million) Trend Analysis By Market Taxonomy, 2020 to 2024
    • Market Size Value (USD Million) Forecast By Market Taxonomy, 2025 to 2035
      • By Country
        • Russia
        • Poland
        • Hungary
        • Balkan & Baltic
        • Rest of Eastern Europe
      • By Classification
      • By Application
    • Market Attractiveness Analysis
      • By Country
      • By Classification
      • By Application
    • Key Takeaways
  13. East Asia Market Analysis 2020 to 2024 and Forecast 2025 to 2035, By Country
    • Historical Market Size Value (USD Million) Trend Analysis By Market Taxonomy, 2020 to 2024
    • Market Size Value (USD Million) Forecast By Market Taxonomy, 2025 to 2035
      • By Country
        • China
        • Japan
        • South Korea
      • By Classification
      • By Application
    • Market Attractiveness Analysis
      • By Country
      • By Classification
      • By Application
    • Key Takeaways
  14. South Asia and Pacific Market Analysis 2020 to 2024 and Forecast 2025 to 2035, By Country
    • Historical Market Size Value (USD Million) Trend Analysis By Market Taxonomy, 2020 to 2024
    • Market Size Value (USD Million) Forecast By Market Taxonomy, 2025 to 2035
      • By Country
        • India
        • ASEAN
        • Australia & New Zealand
        • Rest of South Asia and Pacific
      • By Classification
      • By Application
    • Market Attractiveness Analysis
      • By Country
      • By Classification
      • By Application
    • Key Takeaways
  15. Middle East & Africa Market Analysis 2020 to 2024 and Forecast 2025 to 2035, By Country
    • Historical Market Size Value (USD Million) Trend Analysis By Market Taxonomy, 2020 to 2024
    • Market Size Value (USD Million) Forecast By Market Taxonomy, 2025 to 2035
      • By Country
        • Kingdom of Saudi Arabia
        • Other GCC Countries
        • Turkiye
        • South Africa
        • Other African Union
        • Rest of Middle East & Africa
      • By Classification
      • By Application
    • Market Attractiveness Analysis
      • By Country
      • By Classification
      • By Application
    • Key Takeaways
  16. Key Countries Market Analysis
    • USA
      • Pricing Analysis
      • Market Share Analysis, 2024
        • By Classification
        • By Application
    • Canada
      • Pricing Analysis
      • Market Share Analysis, 2024
        • By Classification
        • By Application
    • Mexico
      • Pricing Analysis
      • Market Share Analysis, 2024
        • By Classification
        • By Application
    • Brazil
      • Pricing Analysis
      • Market Share Analysis, 2024
        • By Classification
        • By Application
    • Chile
      • Pricing Analysis
      • Market Share Analysis, 2024
        • By Classification
        • By Application
    • Germany
      • Pricing Analysis
      • Market Share Analysis, 2024
        • By Classification
        • By Application
    • UK
      • Pricing Analysis
      • Market Share Analysis, 2024
        • By Classification
        • By Application
    • Italy
      • Pricing Analysis
      • Market Share Analysis, 2024
        • By Classification
        • By Application
    • Spain
      • Pricing Analysis
      • Market Share Analysis, 2024
        • By Classification
        • By Application
    • France
      • Pricing Analysis
      • Market Share Analysis, 2024
        • By Classification
        • By Application
    • India
      • Pricing Analysis
      • Market Share Analysis, 2024
        • By Classification
        • By Application
    • ASEAN
      • Pricing Analysis
      • Market Share Analysis, 2024
        • By Classification
        • By Application
    • Australia & New Zealand
      • Pricing Analysis
      • Market Share Analysis, 2024
        • By Classification
        • By Application
    • China
      • Pricing Analysis
      • Market Share Analysis, 2024
        • By Classification
        • By Application
    • Japan
      • Pricing Analysis
      • Market Share Analysis, 2024
        • By Classification
        • By Application
    • South Korea
      • Pricing Analysis
      • Market Share Analysis, 2024
        • By Classification
        • By Application
    • Russia
      • Pricing Analysis
      • Market Share Analysis, 2024
        • By Classification
        • By Application
    • Poland
      • Pricing Analysis
      • Market Share Analysis, 2024
        • By Classification
        • By Application
    • Hungary
      • Pricing Analysis
      • Market Share Analysis, 2024
        • By Classification
        • By Application
    • Kingdom of Saudi Arabia
      • Pricing Analysis
      • Market Share Analysis, 2024
        • By Classification
        • By Application
    • Turkiye
      • Pricing Analysis
      • Market Share Analysis, 2024
        • By Classification
        • By Application
    • South Africa
      • Pricing Analysis
      • Market Share Analysis, 2024
        • By Classification
        • By Application
  17. Market Structure Analysis
    • Competition Dashboard
    • Competition Benchmarking
    • Market Share Analysis of Top Players
      • By Regional
      • By Classification
      • By Application
  18. Competition Analysis
    • Competition Deep Dive
      • PROTEX
        • Overview
        • Product Portfolio
        • Profitability by Market Segments (Product/Age /Sales Channel/Region)
        • Sales Footprint
        • Strategy Overview
          • Marketing Strategy
          • Product Strategy
          • Channel Strategy
      • Matex Bangladesh
      • Piedmont Chemical Industries
      • Achitex Minerva
      • NICCA
      • Avocet Dye & Chemical
      • Sarex Chemicals
      • HT Fine Chemical
      • Dymatic Chemicals
      • HT&K Chemical
      • Starco Arochem
      • Yixing Cleanwater Chemicals
      • Zhejiang Hongda Chemicals
      • GuangDong Kefeng New Material Technology
      • Shandong IRO Polymer Chemicals
      • Shandong Tiancheng Chemical
      • Guangzhou Qiantai Chemical
      • Beijing Jingfang Detergent Products
      • Ningbo Aoxiang Fine Chemical
  19. Assumptions & Acronyms Used
  20. Research Methodology

List of Tables

  • Table 1: Global Market Value (USD Million) Forecast by Region, 2020 to 2035
  • Table 2: Global Market Value (USD Million) Forecast by Classification , 2020 to 2035
  • Table 3: Global Market Value (USD Million) Forecast by Application, 2020 to 2035
  • Table 4: North America Market Value (USD Million) Forecast by Country, 2020 to 2035
  • Table 5: North America Market Value (USD Million) Forecast by Classification , 2020 to 2035
  • Table 6: North America Market Value (USD Million) Forecast by Application, 2020 to 2035
  • Table 7: Latin America Market Value (USD Million) Forecast by Country, 2020 to 2035
  • Table 8: Latin America Market Value (USD Million) Forecast by Classification , 2020 to 2035
  • Table 9: Latin America Market Value (USD Million) Forecast by Application, 2020 to 2035
  • Table 10: Western Europe Market Value (USD Million) Forecast by Country, 2020 to 2035
  • Table 11: Western Europe Market Value (USD Million) Forecast by Classification , 2020 to 2035
  • Table 12: Western Europe Market Value (USD Million) Forecast by Application, 2020 to 2035
  • Table 13: Eastern Europe Market Value (USD Million) Forecast by Country, 2020 to 2035
  • Table 14: Eastern Europe Market Value (USD Million) Forecast by Classification , 2020 to 2035
  • Table 15: Eastern Europe Market Value (USD Million) Forecast by Application, 2020 to 2035
  • Table 16: East Asia Market Value (USD Million) Forecast by Country, 2020 to 2035
  • Table 17: East Asia Market Value (USD Million) Forecast by Classification , 2020 to 2035
  • Table 18: East Asia Market Value (USD Million) Forecast by Application, 2020 to 2035
  • Table 19: South Asia and Pacific Market Value (USD Million) Forecast by Country, 2020 to 2035
  • Table 20: South Asia and Pacific Market Value (USD Million) Forecast by Classification , 2020 to 2035
  • Table 21: South Asia and Pacific Market Value (USD Million) Forecast by Application, 2020 to 2035
  • Table 22: Middle East & Africa Market Value (USD Million) Forecast by Country, 2020 to 2035
  • Table 23: Middle East & Africa Market Value (USD Million) Forecast by Classification , 2020 to 2035
  • Table 24: Middle East & Africa Market Value (USD Million) Forecast by Application, 2020 to 2035

List of Figures

  • Figure 1: Global Market Pricing Analysis
  • Figure 2: Global Market Value (USD Million) Forecast 2020-2035
  • Figure 3: Global Market Value Share and BPS Analysis by Classification , 2025 and 2035
  • Figure 4: Global Market Y-o-Y Growth Comparison by Classification , 2025-2035
  • Figure 5: Global Market Attractiveness Analysis by Classification
  • Figure 6: Global Market Value Share and BPS Analysis by Application, 2025 and 2035
  • Figure 7: Global Market Y-o-Y Growth Comparison by Application, 2025-2035
  • Figure 8: Global Market Attractiveness Analysis by Application
  • Figure 9: Global Market Value (USD Million) Share and BPS Analysis by Region, 2025 and 2035
  • Figure 10: Global Market Y-o-Y Growth Comparison by Region, 2025-2035
  • Figure 11: Global Market Attractiveness Analysis by Region
  • Figure 12: North America Market Incremental Dollar Opportunity, 2025-2035
  • Figure 13: Latin America Market Incremental Dollar Opportunity, 2025-2035
  • Figure 14: Western Europe Market Incremental Dollar Opportunity, 2025-2035
  • Figure 15: Eastern Europe Market Incremental Dollar Opportunity, 2025-2035
  • Figure 16: East Asia Market Incremental Dollar Opportunity, 2025-2035
  • Figure 17: South Asia and Pacific Market Incremental Dollar Opportunity, 2025-2035
  • Figure 18: Middle East & Africa Market Incremental Dollar Opportunity, 2025-2035
  • Figure 19: North America Market Value Share and BPS Analysis by Country, 2025 and 2035
  • Figure 20: North America Market Value Share and BPS Analysis by Classification , 2025 and 2035
  • Figure 21: North America Market Y-o-Y Growth Comparison by Classification , 2025-2035
  • Figure 22: North America Market Attractiveness Analysis by Classification
  • Figure 23: North America Market Value Share and BPS Analysis by Application, 2025 and 2035
  • Figure 24: North America Market Y-o-Y Growth Comparison by Application, 2025-2035
  • Figure 25: North America Market Attractiveness Analysis by Application
  • Figure 26: Latin America Market Value Share and BPS Analysis by Country, 2025 and 2035
  • Figure 27: Latin America Market Value Share and BPS Analysis by Classification , 2025 and 2035
  • Figure 28: Latin America Market Y-o-Y Growth Comparison by Classification , 2025-2035
  • Figure 29: Latin America Market Attractiveness Analysis by Classification
  • Figure 30: Latin America Market Value Share and BPS Analysis by Application, 2025 and 2035
  • Figure 31: Latin America Market Y-o-Y Growth Comparison by Application, 2025-2035
  • Figure 32: Latin America Market Attractiveness Analysis by Application
  • Figure 33: Western Europe Market Value Share and BPS Analysis by Country, 2025 and 2035
  • Figure 34: Western Europe Market Value Share and BPS Analysis by Classification , 2025 and 2035
  • Figure 35: Western Europe Market Y-o-Y Growth Comparison by Classification , 2025-2035
  • Figure 36: Western Europe Market Attractiveness Analysis by Classification
  • Figure 37: Western Europe Market Value Share and BPS Analysis by Application, 2025 and 2035
  • Figure 38: Western Europe Market Y-o-Y Growth Comparison by Application, 2025-2035
  • Figure 39: Western Europe Market Attractiveness Analysis by Application
  • Figure 40: Eastern Europe Market Value Share and BPS Analysis by Country, 2025 and 2035
  • Figure 41: Eastern Europe Market Value Share and BPS Analysis by Classification , 2025 and 2035
  • Figure 42: Eastern Europe Market Y-o-Y Growth Comparison by Classification , 2025-2035
  • Figure 43: Eastern Europe Market Attractiveness Analysis by Classification
  • Figure 44: Eastern Europe Market Value Share and BPS Analysis by Application, 2025 and 2035
  • Figure 45: Eastern Europe Market Y-o-Y Growth Comparison by Application, 2025-2035
  • Figure 46: Eastern Europe Market Attractiveness Analysis by Application
  • Figure 47: East Asia Market Value Share and BPS Analysis by Country, 2025 and 2035
  • Figure 48: East Asia Market Value Share and BPS Analysis by Classification , 2025 and 2035
  • Figure 49: East Asia Market Y-o-Y Growth Comparison by Classification , 2025-2035
  • Figure 50: East Asia Market Attractiveness Analysis by Classification
  • Figure 51: East Asia Market Value Share and BPS Analysis by Application, 2025 and 2035
  • Figure 52: East Asia Market Y-o-Y Growth Comparison by Application, 2025-2035
  • Figure 53: East Asia Market Attractiveness Analysis by Application
  • Figure 54: South Asia and Pacific Market Value Share and BPS Analysis by Country, 2025 and 2035
  • Figure 55: South Asia and Pacific Market Value Share and BPS Analysis by Classification , 2025 and 2035
  • Figure 56: South Asia and Pacific Market Y-o-Y Growth Comparison by Classification , 2025-2035
  • Figure 57: South Asia and Pacific Market Attractiveness Analysis by Classification
  • Figure 58: South Asia and Pacific Market Value Share and BPS Analysis by Application, 2025 and 2035
  • Figure 59: South Asia and Pacific Market Y-o-Y Growth Comparison by Application, 2025-2035
  • Figure 60: South Asia and Pacific Market Attractiveness Analysis by Application
  • Figure 61: Middle East & Africa Market Value Share and BPS Analysis by Country, 2025 and 2035
  • Figure 62: Middle East & Africa Market Value Share and BPS Analysis by Classification , 2025 and 2035
  • Figure 63: Middle East & Africa Market Y-o-Y Growth Comparison by Classification , 2025-2035
  • Figure 64: Middle East & Africa Market Attractiveness Analysis by Classification
  • Figure 65: Middle East & Africa Market Value Share and BPS Analysis by Application, 2025 and 2035
  • Figure 66: Middle East & Africa Market Y-o-Y Growth Comparison by Application, 2025-2035
  • Figure 67: Middle East & Africa Market Attractiveness Analysis by Application
  • Figure 68: Global Market - Tier Structure Analysis
  • Figure 69: Global Market - Company Share Analysis
Dashboard
Dashboard
Dashboard
Dashboard
Dashboard
Dashboard

Our Research Products

Full Research Suite

The "Full Research Suite" delivers actionable market intel, deep dives on markets or technologies, so clients act faster, cut risk, and unlock growth.

Competitor Leaderboard Report

The Leaderboard benchmarks and ranks top vendors, classifying them as Established Leaders, Leading Challengers, or Disruptors & Challengers.

Future Leaders Index

Locates where complements amplify value and substitutes erode it, forecasting net impact by horizon

Market Data & Forecasts

We deliver granular, decision-grade intel: market sizing, 5-year forecasts, pricing, adoption, usage, revenue, and operational KPIs—plus competitor tracking, regulation, and value chains—across 60 countries broadly.

Market Focus Report

Spot the shifts before they hit your P&L. We track inflection points, adoption curves, pricing moves, and ecosystem plays to show where demand is heading, why it is changing, and what to do next across high-growth markets and disruptive tech

Survey Report

Real-time reads of user behavior. We track shifting priorities, perceptions of today’s and next-gen services, and provider experience, then pace how fast tech moves from trial to adoption, blending buyer, consumer, and channel inputs with social signals (#WhySwitch, #UX).

Bespoke Reports

Partner with our analyst team to build a custom report designed around your business priorities. From analysing market trends to assessing competitors or crafting bespoke datasets, we tailor insights to your needs.

Supplier Intelligence

Discovery & Profiling

Capacity & Footprint

Performance & Risk

Compliance & Governance

Commercial Readiness

Who Supplies Whom

Scorecards & Shortlists

Playbooks & Docs

Category Intelligence

Definition & Scope

Demand & Use Cases

Cost Drivers

Market Structure

Supply Chain Map

Trade & Policy

Operating Norms

Deliverables

Buyer Intelligence

Account Basics

Spend & Scope

Procurement Model

Vendor Requirements

Terms & Policies

Entry Strategy

Pain Points & Triggers

Outputs

Pricing Analysis

Benchmarks

Trends

Should-Cost

Indexation

Landed Cost

Commercial Terms

Deliverables

Brand Analysis

Positioning & Value Prop

Share & Presence

Customer Evidence

Go-to-Market

Digital & Reputation

Compliance & Trust

KPIs & Gaps

Outputs

Full Research Suite comprises of:

Market outlook & trends analysis

Market outlook & trends analysis

Interviews & case studies

Interviews & case studies

Strategic recommendations

Strategic recommendations

Vendor profiles & capabilities analysis

Vendor profiles & capabilities analysis

5-year forecasts

5-year forecasts

8 regions and 60+ country-level data splits

8 regions and 60+ country-level data splits

Market segment data splits

Market segment data splits

12 months of continuous data updates

12 months of continuous data updates

DELIVERED AS:

PDF EXCEL ONLINE

Full Research Suite


$5000

$7500

$10000

Buy Report Now
Similar Industry Reports

Similar Industry Reports

Acid Resistant Pipe Market

Acid Resistant Pipe Market Forecast and Outlook 2025 to 2035

Acid Coil Cleaner Market

Acid Coil Cleaner Market Size and Share Forecast Outlook 2025 to 2035

Acid Filling and Leveling Machine Market

Acid Filling and Leveling Machine Market Size and Share Forecast Outlook 2025 to 2035

Acid Chlorides Market

Acid Chlorides Market Size and Share Forecast Outlook 2025 to 2035

Acid-Sensitive APIs Market

Acid-Sensitive APIs Market Analysis - Size, Share, and Forecast Outlook 2025 to 2035

Acidified Whey Protein Market

Acidified Whey Protein Market Analysis - Size, Share & Trends 2025 to 2035

Acid Dyes Market
Acid Dyes Market

Acid Dyes Market Growth - Trends & Forecast 2025 to 2035

Acidity Regulator Market

Acidity Regulator Market Growth - Trends & Forecast 2025 to 2035

Acid Proof Lining Market

Acid Proof Lining Market Trends 2025 to 2035

Acid Citrate Dextrose Tube Market

Acid Citrate Dextrose Tube Market Trends – Growth & Industry Outlook 2024-2034

Acid Orange Market
Acid Orange Market

Acid Orange Market

Antacids Market
Antacids Market

Antacids Market Analysis – Size, Trends & Forecast 2025 to 2035

Lead Acid Battery Market

Lead Acid Battery Market Size and Share Forecast Outlook 2025 to 2035

Lead Acid Battery Recycling Market

Lead Acid Battery Recycling Market Size and Share Forecast Outlook 2025 to 2035

Feed Acidifier Market

Feed Acidifier Market Analysis Size Share and Forecast Outlook 2025 to 2035

Food Acidulants Market

Food Acidulants Market Growth - Key Trends, Size & Forecast 2024 to 2034

Boric Acid Market
Boric Acid Market

Boric Acid Market Forecast and Outlook 2025 to 2035

Folic Acid Market
Folic Acid Market

Folic Acid Market Size and Share Forecast Outlook 2025 to 2035

Oleic Acid Market
Oleic Acid Market

Oleic Acid Market Size and Share Forecast Outlook 2025 to 2035

Dimer Acid-based (DAB) Polyamide Resin Market

Dimer Acid-based (DABa) Polyamide Resin Market Size and Share Forecast Outlook 2025 to 2035

Future Market Insights

No-Aldehyde Acid Fixing Agent Market

Chat With MaRIA

Chat With

MaRIA

Hi There, I am MaRIA, Your Market Research Intelligence Assistant. How may I help you?