Methodology

Non-Invasive Jaundice Detector Market Forecast and Outlook 2025 to 2035

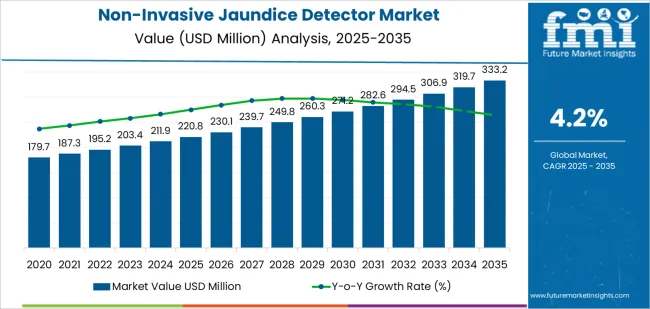
The global non-invasive jaundice detector market is valued at USD 220.8 million in 2025 and is projected to reach USD 333.2 million by 2035, reflecting a CAGR of 4.2%. Early growth is driven by the increasing prevalence of jaundice in newborns, particularly in developing regions with expanding access to healthcare services. Non-invasive jaundice detectors, which offer quick, reliable, and pain-free screening for neonatal jaundice, are becoming a preferred choice for pediatricians and healthcare providers. The technology's ability to reduce the need for blood tests and its ease of use in both clinical and home settings further drives adoption.

As the market progresses through the forecast period, steady growth continues with increasing awareness of the importance of early jaundice detection in reducing health complications. Advancements in sensor accuracy, portability, and cost-efficiency contribute to broader adoption across healthcare systems and home healthcare environments. Manufacturers also focus on developing devices that integrate with mobile health platforms, enabling real-time data sharing and monitoring. By 2035, the market remains strong, supported by continuous improvements in detection technology, growing healthcare infrastructure, and the ongoing push for early detection of neonatal conditions worldwide.
Quick Stats for Non-Invasive Jaundice Detector Market

  • Non-Invasive Jaundice Detector Market Value (2025): USD 220.8 million
  • Non-Invasive Jaundice Detector Market Forecast Value (2035): USD 333.2 million
  • Non-Invasive Jaundice Detector Market Forecast CAGR (2025 to 2035): 4.2%
  • Leading Segment in Non-Invasive Jaundice Detector Market (2025): Non-Invasive Transcutaneous Bilirubin Meters (45.0%)
  • Key Growth Regions in Non-Invasive Jaundice Detector Market: China, India, Germany, Brazil
  • Top Players in Non-Invasive Jaundice Detector Market: Dräger, Philips, GE HealthCare, Natus Medical Incorporated, Konica Minolta

Non Invasive Jaundice Detector Market Market Value Analysis

What is the Growth Forecast for the Non-Invasive Jaundice Detector Market through 2035?

Between 2025 and 2030, the Non-Invasive Jaundice Detector Market grows from USD 220.8 million to USD 271.3 million, creating USD 50.5 million in additional value. The inflection point occurs around 2027 to 2028, when the annual growth rate accelerates from approximately USD 7.3 million to USD 12.7 million, marking a clear shift from steady growth to faster adoption. This inflection reflects increasing demand for non-invasive diagnostic tools, growing awareness of jaundice screening in newborn care, and rising preference for non-invasive procedures over traditional blood tests. Advances in sensor technologies, affordability of devices, and integration with portable health-monitoring systems contribute to this turning point.

From 2030 to 2035, the market expands from USD 271.3 million to USD 333.2 million, adding another USD 61.9 million. The inflection point for this phase occurs between 2032 and 2033, when the market sees a significant increase in adoption, with annual growth moving from USD 12 million to USD 15 million. This later inflection point indicates a stronger market trajectory driven by wider integration of non-invasive jaundice detectors in healthcare systems, especially in developing regions. The device's role in early-stage disease identification, improved affordability, and ease of use in remote settings lead to increased healthcare provider adoption, driving significant market expansion through 2035.

Non-Invasive Jaundice Detector Market Key Takeaways

Metric Value
Market Value (2025) USD 220.8 million
Market Forecast Value (2035) USD 333.2 million
Forecast CAGR (2025 to 2035) 4.2%

Why Is the Non-Invasive Jaundice Detector Market Growing Across Neonatal and Pediatric Care?

The non invasive jaundice detector market is growing as hospitals and clinics prioritize tools that measure bilirubin levels without requiring blood draws, thereby reducing discomfort and infection risk in newborns. These devices employ transcutaneous optics and skin tone sensors to detect rising bilirubin in neonates quickly and repeatedly. With about 60% of newborns experiencing some level of jaundice, the need for rapid, safe screening remains high. Manufacturers refine portable form factors, improved calibration algorithms, and integrated monitoring that supports early intervention workflows in nurseries and maternity units. The demand is especially strong in emerging markets, where access to lab based testing is limited and point of care devices help standardize care.

Adoption growth is further supported by regulatory emphasis on early detection of hyperbilirubinemia to prevent complications such as kernicterus. Many hospitals incorporate non invasive jaundice detectors alongside traditional blood tests to expedite decision making and reduce resource utilization. Research into wearable and smartphone based bilirubin monitoring devices is advancing, enabling continuous or home based monitoring for vulnerable infants. Although device cost and reimbursement constraints remain hurdles in some regions, improving accuracy, portability, and ease of integration into neonatal protocols continue to drive adoption and global market growth.

How Do Detection Technologies and Healthcare Settings Shape Segmentation in the Non-Invasive Jaundice Detector Market?

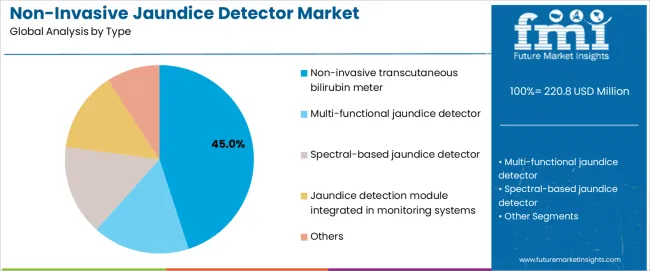
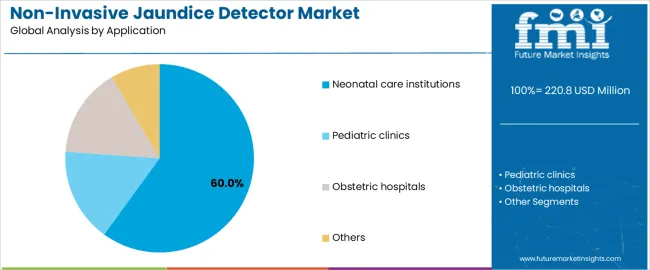
The non-invasive jaundice detector market is segmented by type, application, and region. By type, the market includes non-invasive transcutaneous bilirubin meters, multi-functional jaundice detectors, spectral-based jaundice detectors, jaundice detection modules integrated in monitoring systems, and others. Based on application, it is categorized into neonatal care institutions, pediatric clinics, obstetric hospitals, and others. Regionally, the market is segmented into North America, Europe, East Asia, South Asia, Latin America, and the Middle East & Africa. These divisions reflect differences in clinical workflows, neonatal care capacity, and regional investment in infant health screening technologies.
What Factors Support the Leading Position of Non-Invasive Transcutaneous Bilirubin Meters?

Non Invasive Jaundice Detector Market Analysis By Type

The non-invasive transcutaneous bilirubin meter segment accounts for approximately 45.0% of the global non-invasive jaundice detector market in 2025, making it the leading type category. This position is tied to the segment’s long-established use in neonatal care settings, where quick, painless bilirubin assessments are essential for early detection of jaundice. These meters’ function through optical measurement of bilirubin levels, enabling clinicians to perform rapid screening without blood draws, which is particularly beneficial for premature and newborn infants.

Manufacturers design these devices with calibrated optical sensors that support standardized measurement across different skin tones and neonatal conditions. Adoption is strong in North America, Europe, and East Asia, where neonatal care units routinely screen newborns for jaundice as part of standard postnatal protocols. The segment maintains its leading position because transcutaneous meters are widely recognized for simplicity, speed, and minimal procedural risk, allowing healthcare staff to perform frequent bilirubin checks without disrupting infant care routines.
Why Do Neonatal Care Institutions Represent the Largest Application Share in This Market?

Non Invasive Jaundice Detector Market Analysis By Application

The neonatal care institutions segment represents about 60.0% of the total non-invasive jaundice detector market in 2025, making it the dominant application category. This position reflects the critical role these facilities play in early infant health monitoring, where systematic bilirubin screening helps prevent severe hyperbilirubinemia and related complications. Neonatal units rely on non-invasive devices to conduct repeated measurements during the first days of life, when bilirubin levels frequently change and require close observation.

Hospitals equip neonatal units with multiple detectors to ensure continuous screening capacity, particularly in high-birth-volume regions across East Asia, South Asia, and parts of Europe. These institutions integrate jaundice detection into standardized postnatal workflows, supporting rapid decision-making regarding phototherapy or further diagnostic testing. The segment maintains its lead because neonatal units represent the core environment where bilirubin monitoring is most frequent, creating steady demand for accurate, non-invasive detectors that support infant safety and align with modern neonatal care practices.

What are the Key Trends, Drivers, and Restraints in the NonInvasive Jaundice Detector Market?

The non invasive jaundice detector market is expanding as healthcare providers and caregivers seek safer, quicker and more comfortable alternatives to blood based bilirubin testing for newborns and at risk populations. These devices such as transcutaneous bilirubinometers and optical jaundice meters allow bilirubin assessment through skin contact or imaging, reducing pain and infection risk. Growth is supported by increasing neonatal care standards, rising jaundice incidence globally and technological advances in sensing and analytics. Adoption is restrained by high unit cost, accuracy concerns in diverse skin tones and the need for clinical validation across settings. Device makers are refining algorithms, lowering cost of ownership and improving portability to meet broader use cases.

How are rising neonatal jaundice cases and care quality demands driving detector adoption?

Demand is driven by the high prevalence of neonatal jaundice affecting a significant percentage of term and pre term infants and clinical imperatives to diagnose early and reduce complications. Hospitals increasingly prefer non invasive tools to monitor bilirubin levels without repeated heel pricks, improving patient comfort and workflow. Care in remote or resource limited settings is also motivating tools that support rapid screening and triage. As healthcare systems expand neonatal units or enforce discharge screening protocols, non invasive jaundice detectors become integral to improving care delivery.

What factors are restraining wider deployment of non invasive jaundice detectors?

Adoption is constrained by concerns over device accuracy, especially in newborns with darker skin types, or under variable ambient lighting and tissue conditions. Some clinicians remain sceptical of non invasive readings compared to serum bilirubin tests, limiting routine use. The upfront cost of detectors and consumables may be high for smaller clinics or low income regions. Maintenance, calibration and training also add overhead. Regulatory approvals and reimbursement limitations in certain regions further slow adoption, particularly for home care or mobile screening models.

What trends are shaping the evolution of non invasive jaundice device technology?

Key trends include miniaturisation and portability, enabling point of care or home based screening; integration of AI and image processing to enhance sensitivity and compensate for skin tone or environmental variability; and development of wearable or continuous monitoring solutions that track bilirubin over time. Device manufacturers are also focusing on cost effective models for emerging markets, cloud based data integration and seamless interoperability with neonatal health information systems. As care models extend into outpatient and home settings, the detector market will continue broadening its reach beyond hospital nurseries.
What is the Analysis of the Non-Invasive Jaundice Detector Market by Key Country?

Non Invasive Jaundice Detector Market Cagr Analysis By Country

Country CAGR (%)
China 5.7%
India 5.3%
Germany 4.8%
Brazil 4.4%
USA 4.0%
UK 3.6%
Japan 3.2%

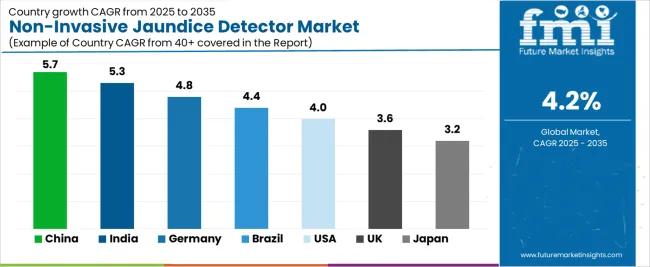
The Non-Invasive Jaundice Detector Market is expanding steadily across healthcare sectors globally, with China leading at a 5.7% CAGR through 2035, driven by significant advancements in neonatal healthcare, increased demand for early jaundice detection, and a growing healthcare infrastructure. India follows at 5.3%, supported by rising awareness, healthcare access improvements, and increasing investment in non-invasive diagnostic technologies.

Germany records 4.8%, benefiting from stringent healthcare standards, advanced medical device manufacturing, and high adoption of neonatal care solutions. Brazil grows at 4.4%, fueled by expanding healthcare access and improved prenatal and neonatal services. The USA, at 4.0%, remains a stable market focusing on pediatric care innovations and home-based diagnostic tools, while the UK (3.6%) and Japan (3.2%) focus on enhancing diagnostic accuracy and patient-friendly solutions for jaundice monitoring.

How Is Healthcare Expansion Supporting Market Growth in China?

China is projected to grow at a CAGR of 5.7% through 2035 in the non-invasive jaundice detector market. Increasing healthcare access, neonatal care services, and growing awareness of early disease detection are driving the demand for non-invasive jaundice diagnostic tools. Hospitals and clinics adopt these devices to improve patient comfort and reduce the need for blood tests. Manufacturers focus on enhancing the accuracy and portability of jaundice detectors for widespread use in both rural and urban settings. The market is also supported by government healthcare initiatives promoting early detection and treatment of neonatal conditions.

  • Neonatal care expansion drives demand for non-invasive diagnostic tools.
  • Portable, accurate detectors reduce the need for invasive blood tests.
  • Government healthcare initiatives promote early jaundice detection and treatment.
  • Improved accuracy and portability support broader market penetration.

Why Are Rising Healthcare Investments Driving Demand in India?

India is projected to grow at a CAGR of 5.3% through 2035 in the non-invasive jaundice detector market. Growing healthcare infrastructure, awareness programs, and increasing neonatal care facilities contribute to the rising demand for early-stage jaundice detection. Non-invasive devices reduce discomfort and healthcare costs, especially in rural areas where access to laboratory testing is limited. Manufacturers focus on developing affordable, easy-to-use devices to cater to India’s diverse healthcare needs. The market also benefits from mobile health units and government-funded health programs targeting rural populations.
  • Rural healthcare growth increases the need for portable jaundice detectors.
  • Affordable, easy-to-use devices meet the diverse needs of Indian healthcare.
  • Government health programs promote early-stage jaundice detection and management.
  • Mobile health units facilitate widespread testing in underserved areas.

How Are Technological Advancements Shaping the Market in Germany?

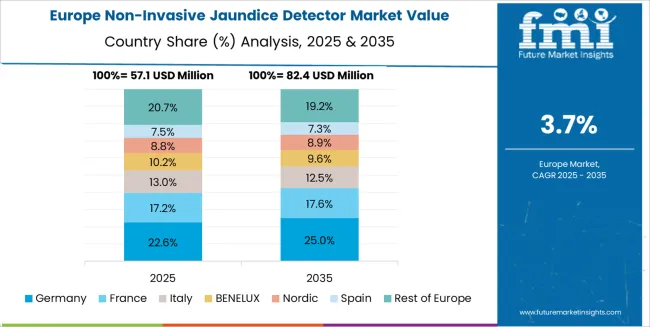
Non Invasive Jaundice Detector Market Europe Country Market Share Analysis, 2025 & 2035

Germany is projected to grow at a CAGR of 4.8% through 2035 in the non-invasive jaundice detector market. As a leader in medical device innovation, Germany’s demand for non-invasive jaundice detection is driven by technological advancements in sensor accuracy and miniaturisation. Hospitals and neonatal care units adopt advanced diagnostic tools to reduce invasive testing and improve patient experience. Manufacturers focus on integrating AI algorithms for enhanced detection and predictive analytics. The market is further driven by Germany’s commitment to healthcare excellence and stringent regulations ensuring high product standards for medical devices.

  • Technological advancements in sensors increase detection accuracy and reliability.
  • Miniaturisation supports integration into portable devices for at-home use.
  • AI algorithms enhance diagnostic capabilities and predictive healthcare.
  • Strict regulatory standards ensure high-quality medical device performance.

Why Is Growing Healthcare Access Supporting Brazil’s Market?

Brazil is projected to grow at a CAGR of 4.4% through 2035 in the non-invasive jaundice detector market. Increased healthcare access, particularly in rural and underserved regions, drives the adoption of non-invasive diagnostic tools. These devices enable early detection of neonatal jaundice without the need for blood tests, which is crucial for remote or low-resource areas. Manufacturers are focusing on developing cost-effective, portable jaundice detectors that can be used in community health centers. Brazil’s expanding maternal and child healthcare programs also contribute to the market’s growth.
  • Rural healthcare access drives demand for portable jaundice detection tools.
  • Cost-effective devices cater to Brazil’s growing need for affordable diagnostics.
  • Non-invasive detection reduces healthcare costs and improves patient care.
  • Maternal and child healthcare expansion promotes early diagnosis and treatment.

How Are Technological Integration and Healthcare Demand Shaping the Market in the USA?

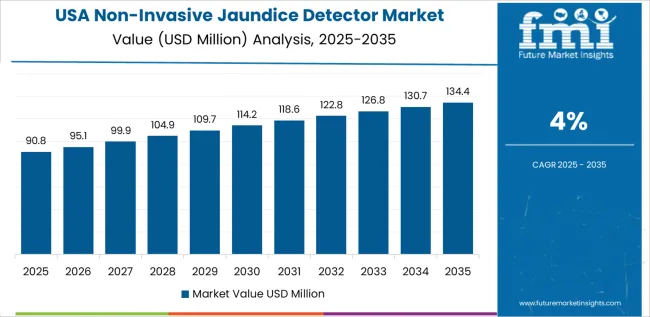
Non Invasive Jaundice Detector Market Country Value Analysis

USA is projected to grow at a CAGR of 4% through 2035 in the non-invasive jaundice detector market. The growing adoption of advanced diagnostic technology and the increasing demand for early disease detection are key drivers of market growth. Hospitals and healthcare providers favour non-invasive solutions to reduce the risk of infection and enhance patient comfort. Manufacturers focus on integrating wireless connectivity and cloud data storage for remote monitoring and patient tracking. The USA’s well-established healthcare system continues to invest in innovative diagnostic tools, including non-invasive jaundice detectors.

  • Wireless connectivity allows for remote monitoring and patient tracking.
  • Non-invasive detection reduces risk of infection and improves patient comfort.
  • Advanced diagnostic technology adoption drives demand for modern healthcare tools.
  • Remote monitoring and cloud storage improve data accessibility and patient care.

How Are Healthcare System Reforms Driving Market Growth in the UK?

UK is projected to grow at a CAGR of 3.6% through 2035 in the non-invasive jaundice detector market. National healthcare reforms focusing on reducing healthcare costs and improving patient outcomes are increasing demand for non-invasive diagnostic devices. Hospitals and community health programs adopt jaundice detectors to support neonatal care without the need for blood draws. The UK’s National Health Service (NHS) invests in cost-effective, patient-friendly solutions, encouraging widespread adoption of these technologies. Manufacturers are focusing on enhancing the portability, usability, and accuracy of these devices for use in both clinical and home settings.
  • National healthcare reforms drive demand for cost-effective diagnostic solutions.
  • Non-invasive detection reduces the need for invasive procedures in neonatal care.
  • NHS adoption encourages widespread use of jaundice detection devices.
  • Portability and accuracy improvements support clinical and home-use applications.

How Is Demand for Neonatal Care Shaping the Market in Japan?

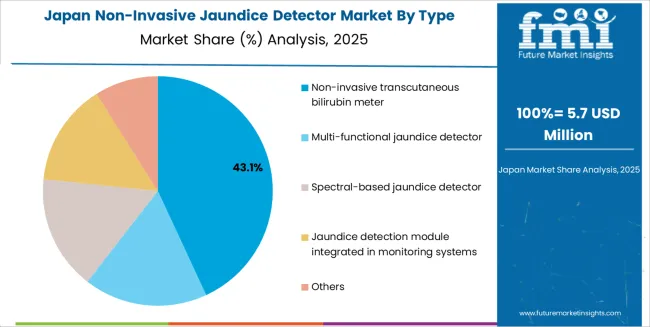
Non Invasive Jaundice Detector Market Japan Market Share Analysis By Type

Japan is projected to grow at a CAGR of 3.2% through 2035 in the non-invasive jaundice detector market. Japan’s aging population and high standard of neonatal care increase the need for early detection of conditions such as jaundice. Non-invasive jaundice detectors are used in hospitals and clinics to improve patient comfort and reduce the need for frequent blood tests. Manufacturers focus on developing compact, user-friendly devices for both professional healthcare settings and homecare environments. Japan’s strong healthcare infrastructure supports market expansion, particularly in urban areas with advanced medical facilities.
  • High standard of neonatal care increases demand for non-invasive detection.
  • Compact, user-friendly devices cater to both professional and homecare settings.
  • Non-invasive devices enhance patient comfort by reducing blood testing.
  • Japan’s advanced healthcare infrastructure supports widespread device adoption.

How Competitive Is the Global Non-Invasive Jaundice Detector Market and What Defines Its Strategic Landscape?

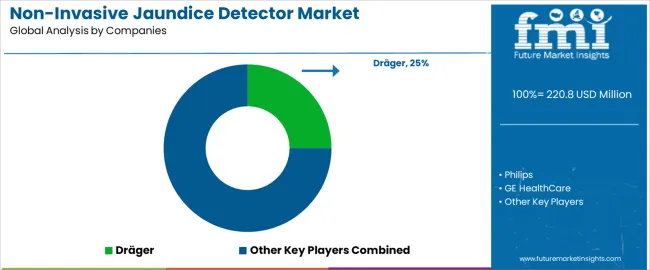
Non Invasive Jaundice Detector Market Analysis By Company

The global non-invasive jaundice detector market is moderately competitive, driven by leading healthcare and medical technology companies providing solutions for neonatal care, routine screenings, and early detection of jaundice in infants. Dräger, Philips, and GE HealthCare hold dominant positions with advanced, clinically validated jaundice detectors that utilize light-based technology to measure bilirubin levels without the need for blood samples. Natus Medical Incorporated and Konica Minolta strengthen the upper tier with reliable and easy-to-use non-invasive solutions that focus on early detection and enhanced clinical outcomes for newborns. Atys Medical, AVI Healthcare, and Micro Lab Instruments contribute to the mid-range competition with portable, user-friendly detectors designed for pediatric and neonatal units in hospitals, clinics, and outpatient settings.

Refine Medical Technology, Beijing M&B Electronic Instruments, Delta Medical International, and Xuzhou Kejian Hi-tech Co., Ltd. expand regional market presence with cost-effective and accurate jaundice detection devices tailored for healthcare providers in emerging markets. Zhengzhou Dison Instrument and Meter Co., Ltd., Shanghai Hisen Limited, and Shenzhen Aeon Technology Co., Ltd. strengthen competition through innovations in sensor accuracy, device portability, and integration with hospital management systems. Market competition is shaped by device reliability, ease of use, and measurement accuracy, while strategic differentiation depends on non-invasive technology, portability, and speed of results. As neonatal healthcare demands rise globally, manufacturers with robust clinical validation, mobile capabilities, and integration with electronic medical records are positioned to strengthen their long-term competitiveness in this growing market.

Key Players in the Non-Invasive Jaundice Detector Market

  • Dräger
  • Philips
  • GE HealthCare
  • Natus Medical Incorporated
  • Konica Minolta
  • Atys Medical
  • AVI Healthcare
  • Micro Lab Instruments
  • Refine Medical Technology
  • Beijing M&B Electronic Instruments Co., Ltd.
  • Delta Medical International
  • Xuzhou Kejian Hi-tech Co., Ltd.
  • Zhengzhou Dison Instrument and Meter Co., Ltd.
  • Shanghai Hisen Limited
  • Shenzhen Aeon Technology Co., Ltd.

Report Scope for Non-Invasive Jaundice Detector Market

Items Values
Quantitative Units (2025) USD million
Type Non-invasive transcutaneous bilirubin meter, Multi-functional jaundice detector, Spectral-based jaundice detector, Jaundice detection module integrated in monitoring systems, Others
Application Neonatal care institutions, Pediatric clinics, Obstetric hospitals
Regions Covered East Asia, Europe, North America, South Asia, Latin America, Middle East & Africa
Countries Covered China, India, Germany, Brazil, USA, UK, Japan, and 40+ additional countries
Key Companies Profiled Dräger, Philips, GE HealthCare, Natus Medical Incorporated, Konica Minolta, Atys Medical, AVI Healthcare, Micro Lab Instruments, Refine Medical Technology, Beijing M&B Electronic Instruments Co., Ltd., Delta Medical International, Xuzhou Kejian Hi-tech Co., Ltd., Zhengzhou Dison Instrument and Meter Co., Ltd., Shanghai Hisen Limited, Shenzhen Aeon Technology Co., Ltd.
Additional Attributes Market share by type and application, technological advancements (e.g., integration with health platforms, AI and sensor accuracy), regulatory environment across regions, growth in home healthcare, mobile-based jaundice monitoring solutions, emerging market adoption, pediatric and neonatal care trends.

Non-Invasive Jaundice Detector Market Segmentation

Type:

  • Non-invasive transcutaneous bilirubin meter
  • Multi-functional jaundice detector
  • Spectral-based jaundice detector
  • Jaundice detection module integrated in monitoring systems
  • Others

Application:

  • Neonatal care institutions
  • Pediatric clinics
  • Obstetric hospitals
  • Others

Region:

  • East Asia

    • China
    • Japan
    • South Korea
    • Taiwan
    • Rest of East Asia
  • Europe

    • Germany
    • UK
    • France
    • Italy
    • Spain
    • Switzerland
    • Nordic
    • BENELUX
    • Rest of Europe
  • North America

    • USA
    • Canada
    • Mexico
  • South Asia

    • India
    • Pakistan
    • Bangladesh
    • Rest of South Asia
  • Latin America

    • Brazil
    • Argentina
    • Chile
    • Rest of Latin America
  • Middle East & Africa

    • Kingdom of Saudi Arabia
    • Other GCC Countries
    • Turkey
    • South Africa
    • Other African Union
    • Rest of Middle East & Africa
  • Eastern Europe

    • Russia
    • Poland
    • Czech Republic
    • Rest of Eastern Europe

Frequently Asked Questions

How big is the non-invasive jaundice detector market in 2025?

The global non-invasive jaundice detector market is estimated to be valued at USD 220.8 million in 2025.

What will be the size of non-invasive jaundice detector market in 2035?

The market size for the non-invasive jaundice detector market is projected to reach USD 333.2 million by 2035.

How much will be the non-invasive jaundice detector market growth between 2025 and 2035?

The non-invasive jaundice detector market is expected to grow at a 4.2% CAGR between 2025 and 2035.

What are the key product types in the non-invasive jaundice detector market?

The key product types in non-invasive jaundice detector market are non-invasive transcutaneous bilirubin meter, multi-functional jaundice detector, spectral-based jaundice detector, jaundice detection module integrated in monitoring systems and others.

Which application segment to contribute significant share in the non-invasive jaundice detector market in 2025?

In terms of application, neonatal care institutions segment to command 60.0% share in the non-invasive jaundice detector market in 2025.

Table of Content

  1. Executive Summary
    • Global Market Outlook
    • Demand to side Trends
    • Supply to side Trends
    • Technology Roadmap Analysis
    • Analysis and Recommendations
  2. Market Overview
    • Market Coverage / Taxonomy
    • Market Definition / Scope / Limitations
  3. Market Background
    • Market Dynamics
      • Drivers
      • Restraints
      • Opportunity
      • Trends
    • Scenario Forecast
      • Demand in Optimistic Scenario
      • Demand in Likely Scenario
      • Demand in Conservative Scenario
    • Opportunity Map Analysis
    • Product Life Cycle Analysis
    • Supply Chain Analysis
    • Investment Feasibility Matrix
    • Value Chain Analysis
    • PESTLE and Porter’s Analysis
    • Regulatory Landscape
    • Regional Parent Market Outlook
    • Production and Consumption Statistics
    • Import and Export Statistics
  4. Global Market Analysis 2020 to 2024 and Forecast, 2025 to 2035
    • Historical Market Size Value (USD Million) Analysis, 2020 to 2024
    • Current and Future Market Size Value (USD Million) Projections, 2025 to 2035
      • Y to o to Y Growth Trend Analysis
      • Absolute $ Opportunity Analysis
  5. Global Market Pricing Analysis 2020 to 2024 and Forecast 2025 to 2035
  6. Global Market Analysis 2020 to 2024 and Forecast 2025 to 2035, By Type
    • Introduction / Key Findings
    • Historical Market Size Value (USD Million) Analysis By Type , 2020 to 2024
    • Current and Future Market Size Value (USD Million) Analysis and Forecast By Type , 2025 to 2035
      • Non-invasive transcutaneous bilirubin meter
      • Multi-functional jaundice detector
      • Spectral-based jaundice detector
      • Jaundice detection module integrated in monitoring systems
      • Others
    • Y to o to Y Growth Trend Analysis By Type , 2020 to 2024
    • Absolute $ Opportunity Analysis By Type , 2025 to 2035
  7. Global Market Analysis 2020 to 2024 and Forecast 2025 to 2035, By Application
    • Introduction / Key Findings
    • Historical Market Size Value (USD Million) Analysis By Application, 2020 to 2024
    • Current and Future Market Size Value (USD Million) Analysis and Forecast By Application, 2025 to 2035
      • Neonatal care institutions
      • Pediatric clinics
      • Obstetric hospitals
      • Others
    • Y to o to Y Growth Trend Analysis By Application, 2020 to 2024
    • Absolute $ Opportunity Analysis By Application, 2025 to 2035
  8. Global Market Analysis 2020 to 2024 and Forecast 2025 to 2035, By Region
    • Introduction
    • Historical Market Size Value (USD Million) Analysis By Region, 2020 to 2024
    • Current Market Size Value (USD Million) Analysis and Forecast By Region, 2025 to 2035
      • North America
      • Latin America
      • Western Europe
      • Eastern Europe
      • East Asia
      • South Asia and Pacific
      • Middle East & Africa
    • Market Attractiveness Analysis By Region
  9. North America Market Analysis 2020 to 2024 and Forecast 2025 to 2035, By Country
    • Historical Market Size Value (USD Million) Trend Analysis By Market Taxonomy, 2020 to 2024
    • Market Size Value (USD Million) Forecast By Market Taxonomy, 2025 to 2035
      • By Country
        • USA
        • Canada
        • Mexico
      • By Type
      • By Application
    • Market Attractiveness Analysis
      • By Country
      • By Type
      • By Application
    • Key Takeaways
  10. Latin America Market Analysis 2020 to 2024 and Forecast 2025 to 2035, By Country
    • Historical Market Size Value (USD Million) Trend Analysis By Market Taxonomy, 2020 to 2024
    • Market Size Value (USD Million) Forecast By Market Taxonomy, 2025 to 2035
      • By Country
        • Brazil
        • Chile
        • Rest of Latin America
      • By Type
      • By Application
    • Market Attractiveness Analysis
      • By Country
      • By Type
      • By Application
    • Key Takeaways
  11. Western Europe Market Analysis 2020 to 2024 and Forecast 2025 to 2035, By Country
    • Historical Market Size Value (USD Million) Trend Analysis By Market Taxonomy, 2020 to 2024
    • Market Size Value (USD Million) Forecast By Market Taxonomy, 2025 to 2035
      • By Country
        • Germany
        • UK
        • Italy
        • Spain
        • France
        • Nordic
        • BENELUX
        • Rest of Western Europe
      • By Type
      • By Application
    • Market Attractiveness Analysis
      • By Country
      • By Type
      • By Application
    • Key Takeaways
  12. Eastern Europe Market Analysis 2020 to 2024 and Forecast 2025 to 2035, By Country
    • Historical Market Size Value (USD Million) Trend Analysis By Market Taxonomy, 2020 to 2024
    • Market Size Value (USD Million) Forecast By Market Taxonomy, 2025 to 2035
      • By Country
        • Russia
        • Poland
        • Hungary
        • Balkan & Baltic
        • Rest of Eastern Europe
      • By Type
      • By Application
    • Market Attractiveness Analysis
      • By Country
      • By Type
      • By Application
    • Key Takeaways
  13. East Asia Market Analysis 2020 to 2024 and Forecast 2025 to 2035, By Country
    • Historical Market Size Value (USD Million) Trend Analysis By Market Taxonomy, 2020 to 2024
    • Market Size Value (USD Million) Forecast By Market Taxonomy, 2025 to 2035
      • By Country
        • China
        • Japan
        • South Korea
      • By Type
      • By Application
    • Market Attractiveness Analysis
      • By Country
      • By Type
      • By Application
    • Key Takeaways
  14. South Asia and Pacific Market Analysis 2020 to 2024 and Forecast 2025 to 2035, By Country
    • Historical Market Size Value (USD Million) Trend Analysis By Market Taxonomy, 2020 to 2024
    • Market Size Value (USD Million) Forecast By Market Taxonomy, 2025 to 2035
      • By Country
        • India
        • ASEAN
        • Australia & New Zealand
        • Rest of South Asia and Pacific
      • By Type
      • By Application
    • Market Attractiveness Analysis
      • By Country
      • By Type
      • By Application
    • Key Takeaways
  15. Middle East & Africa Market Analysis 2020 to 2024 and Forecast 2025 to 2035, By Country
    • Historical Market Size Value (USD Million) Trend Analysis By Market Taxonomy, 2020 to 2024
    • Market Size Value (USD Million) Forecast By Market Taxonomy, 2025 to 2035
      • By Country
        • Kingdom of Saudi Arabia
        • Other GCC Countries
        • Turkiye
        • South Africa
        • Other African Union
        • Rest of Middle East & Africa
      • By Type
      • By Application
    • Market Attractiveness Analysis
      • By Country
      • By Type
      • By Application
    • Key Takeaways
  16. Key Countries Market Analysis
    • USA
      • Pricing Analysis
      • Market Share Analysis, 2024
        • By Type
        • By Application
    • Canada
      • Pricing Analysis
      • Market Share Analysis, 2024
        • By Type
        • By Application
    • Mexico
      • Pricing Analysis
      • Market Share Analysis, 2024
        • By Type
        • By Application
    • Brazil
      • Pricing Analysis
      • Market Share Analysis, 2024
        • By Type
        • By Application
    • Chile
      • Pricing Analysis
      • Market Share Analysis, 2024
        • By Type
        • By Application
    • Germany
      • Pricing Analysis
      • Market Share Analysis, 2024
        • By Type
        • By Application
    • UK
      • Pricing Analysis
      • Market Share Analysis, 2024
        • By Type
        • By Application
    • Italy
      • Pricing Analysis
      • Market Share Analysis, 2024
        • By Type
        • By Application
    • Spain
      • Pricing Analysis
      • Market Share Analysis, 2024
        • By Type
        • By Application
    • France
      • Pricing Analysis
      • Market Share Analysis, 2024
        • By Type
        • By Application
    • India
      • Pricing Analysis
      • Market Share Analysis, 2024
        • By Type
        • By Application
    • ASEAN
      • Pricing Analysis
      • Market Share Analysis, 2024
        • By Type
        • By Application
    • Australia & New Zealand
      • Pricing Analysis
      • Market Share Analysis, 2024
        • By Type
        • By Application
    • China
      • Pricing Analysis
      • Market Share Analysis, 2024
        • By Type
        • By Application
    • Japan
      • Pricing Analysis
      • Market Share Analysis, 2024
        • By Type
        • By Application
    • South Korea
      • Pricing Analysis
      • Market Share Analysis, 2024
        • By Type
        • By Application
    • Russia
      • Pricing Analysis
      • Market Share Analysis, 2024
        • By Type
        • By Application
    • Poland
      • Pricing Analysis
      • Market Share Analysis, 2024
        • By Type
        • By Application
    • Hungary
      • Pricing Analysis
      • Market Share Analysis, 2024
        • By Type
        • By Application
    • Kingdom of Saudi Arabia
      • Pricing Analysis
      • Market Share Analysis, 2024
        • By Type
        • By Application
    • Turkiye
      • Pricing Analysis
      • Market Share Analysis, 2024
        • By Type
        • By Application
    • South Africa
      • Pricing Analysis
      • Market Share Analysis, 2024
        • By Type
        • By Application
  17. Market Structure Analysis
    • Competition Dashboard
    • Competition Benchmarking
    • Market Share Analysis of Top Players
      • By Regional
      • By Type
      • By Application
  18. Competition Analysis
    • Competition Deep Dive
      • Dräger
        • Overview
        • Product Portfolio
        • Profitability by Market Segments (Product/Age /Sales Channel/Region)
        • Sales Footprint
        • Strategy Overview
          • Marketing Strategy
          • Product Strategy
          • Channel Strategy
      • Philips
      • GE HealthCare
      • Natus Medical Incorporated
      • Konica Minolta
      • Atys Medical
      • AVI Healthcare
      • Micro Lab Instruments
      • Refine Medical Technology
      • Beijing M&B Electronic Instruments Co., Ltd.
      • Delta Medical International
      • Xuzhou Kejian Hi-tech Co., Ltd.
      • Zhengzhou Dison Instrument and Meter Co., Ltd.
      • Shanghai Hisen Limited
      • Shenzhen Aeon Technology Co., Ltd.
  19. Assumptions & Acronyms Used
  20. Research Methodology

List of Tables

  • Table 1: Global Market Value (USD Million) Forecast by Region, 2020 to 2035
  • Table 2: Global Market Value (USD Million) Forecast by Type , 2020 to 2035
  • Table 3: Global Market Value (USD Million) Forecast by Application, 2020 to 2035
  • Table 4: North America Market Value (USD Million) Forecast by Country, 2020 to 2035
  • Table 5: North America Market Value (USD Million) Forecast by Type , 2020 to 2035
  • Table 6: North America Market Value (USD Million) Forecast by Application, 2020 to 2035
  • Table 7: Latin America Market Value (USD Million) Forecast by Country, 2020 to 2035
  • Table 8: Latin America Market Value (USD Million) Forecast by Type , 2020 to 2035
  • Table 9: Latin America Market Value (USD Million) Forecast by Application, 2020 to 2035
  • Table 10: Western Europe Market Value (USD Million) Forecast by Country, 2020 to 2035
  • Table 11: Western Europe Market Value (USD Million) Forecast by Type , 2020 to 2035
  • Table 12: Western Europe Market Value (USD Million) Forecast by Application, 2020 to 2035
  • Table 13: Eastern Europe Market Value (USD Million) Forecast by Country, 2020 to 2035
  • Table 14: Eastern Europe Market Value (USD Million) Forecast by Type , 2020 to 2035
  • Table 15: Eastern Europe Market Value (USD Million) Forecast by Application, 2020 to 2035
  • Table 16: East Asia Market Value (USD Million) Forecast by Country, 2020 to 2035
  • Table 17: East Asia Market Value (USD Million) Forecast by Type , 2020 to 2035
  • Table 18: East Asia Market Value (USD Million) Forecast by Application, 2020 to 2035
  • Table 19: South Asia and Pacific Market Value (USD Million) Forecast by Country, 2020 to 2035
  • Table 20: South Asia and Pacific Market Value (USD Million) Forecast by Type , 2020 to 2035
  • Table 21: South Asia and Pacific Market Value (USD Million) Forecast by Application, 2020 to 2035
  • Table 22: Middle East & Africa Market Value (USD Million) Forecast by Country, 2020 to 2035
  • Table 23: Middle East & Africa Market Value (USD Million) Forecast by Type , 2020 to 2035
  • Table 24: Middle East & Africa Market Value (USD Million) Forecast by Application, 2020 to 2035

List of Figures

  • Figure 1: Global Market Pricing Analysis
  • Figure 2: Global Market Value (USD Million) Forecast 2020-2035
  • Figure 3: Global Market Value Share and BPS Analysis by Type , 2025 and 2035
  • Figure 4: Global Market Y-o-Y Growth Comparison by Type , 2025-2035
  • Figure 5: Global Market Attractiveness Analysis by Type
  • Figure 6: Global Market Value Share and BPS Analysis by Application, 2025 and 2035
  • Figure 7: Global Market Y-o-Y Growth Comparison by Application, 2025-2035
  • Figure 8: Global Market Attractiveness Analysis by Application
  • Figure 9: Global Market Value (USD Million) Share and BPS Analysis by Region, 2025 and 2035
  • Figure 10: Global Market Y-o-Y Growth Comparison by Region, 2025-2035
  • Figure 11: Global Market Attractiveness Analysis by Region
  • Figure 12: North America Market Incremental Dollar Opportunity, 2025-2035
  • Figure 13: Latin America Market Incremental Dollar Opportunity, 2025-2035
  • Figure 14: Western Europe Market Incremental Dollar Opportunity, 2025-2035
  • Figure 15: Eastern Europe Market Incremental Dollar Opportunity, 2025-2035
  • Figure 16: East Asia Market Incremental Dollar Opportunity, 2025-2035
  • Figure 17: South Asia and Pacific Market Incremental Dollar Opportunity, 2025-2035
  • Figure 18: Middle East & Africa Market Incremental Dollar Opportunity, 2025-2035
  • Figure 19: North America Market Value Share and BPS Analysis by Country, 2025 and 2035
  • Figure 20: North America Market Value Share and BPS Analysis by Type , 2025 and 2035
  • Figure 21: North America Market Y-o-Y Growth Comparison by Type , 2025-2035
  • Figure 22: North America Market Attractiveness Analysis by Type
  • Figure 23: North America Market Value Share and BPS Analysis by Application, 2025 and 2035
  • Figure 24: North America Market Y-o-Y Growth Comparison by Application, 2025-2035
  • Figure 25: North America Market Attractiveness Analysis by Application
  • Figure 26: Latin America Market Value Share and BPS Analysis by Country, 2025 and 2035
  • Figure 27: Latin America Market Value Share and BPS Analysis by Type , 2025 and 2035
  • Figure 28: Latin America Market Y-o-Y Growth Comparison by Type , 2025-2035
  • Figure 29: Latin America Market Attractiveness Analysis by Type
  • Figure 30: Latin America Market Value Share and BPS Analysis by Application, 2025 and 2035
  • Figure 31: Latin America Market Y-o-Y Growth Comparison by Application, 2025-2035
  • Figure 32: Latin America Market Attractiveness Analysis by Application
  • Figure 33: Western Europe Market Value Share and BPS Analysis by Country, 2025 and 2035
  • Figure 34: Western Europe Market Value Share and BPS Analysis by Type , 2025 and 2035
  • Figure 35: Western Europe Market Y-o-Y Growth Comparison by Type , 2025-2035
  • Figure 36: Western Europe Market Attractiveness Analysis by Type
  • Figure 37: Western Europe Market Value Share and BPS Analysis by Application, 2025 and 2035
  • Figure 38: Western Europe Market Y-o-Y Growth Comparison by Application, 2025-2035
  • Figure 39: Western Europe Market Attractiveness Analysis by Application
  • Figure 40: Eastern Europe Market Value Share and BPS Analysis by Country, 2025 and 2035
  • Figure 41: Eastern Europe Market Value Share and BPS Analysis by Type , 2025 and 2035
  • Figure 42: Eastern Europe Market Y-o-Y Growth Comparison by Type , 2025-2035
  • Figure 43: Eastern Europe Market Attractiveness Analysis by Type
  • Figure 44: Eastern Europe Market Value Share and BPS Analysis by Application, 2025 and 2035
  • Figure 45: Eastern Europe Market Y-o-Y Growth Comparison by Application, 2025-2035
  • Figure 46: Eastern Europe Market Attractiveness Analysis by Application
  • Figure 47: East Asia Market Value Share and BPS Analysis by Country, 2025 and 2035
  • Figure 48: East Asia Market Value Share and BPS Analysis by Type , 2025 and 2035
  • Figure 49: East Asia Market Y-o-Y Growth Comparison by Type , 2025-2035
  • Figure 50: East Asia Market Attractiveness Analysis by Type
  • Figure 51: East Asia Market Value Share and BPS Analysis by Application, 2025 and 2035
  • Figure 52: East Asia Market Y-o-Y Growth Comparison by Application, 2025-2035
  • Figure 53: East Asia Market Attractiveness Analysis by Application
  • Figure 54: South Asia and Pacific Market Value Share and BPS Analysis by Country, 2025 and 2035
  • Figure 55: South Asia and Pacific Market Value Share and BPS Analysis by Type , 2025 and 2035
  • Figure 56: South Asia and Pacific Market Y-o-Y Growth Comparison by Type , 2025-2035
  • Figure 57: South Asia and Pacific Market Attractiveness Analysis by Type
  • Figure 58: South Asia and Pacific Market Value Share and BPS Analysis by Application, 2025 and 2035
  • Figure 59: South Asia and Pacific Market Y-o-Y Growth Comparison by Application, 2025-2035
  • Figure 60: South Asia and Pacific Market Attractiveness Analysis by Application
  • Figure 61: Middle East & Africa Market Value Share and BPS Analysis by Country, 2025 and 2035
  • Figure 62: Middle East & Africa Market Value Share and BPS Analysis by Type , 2025 and 2035
  • Figure 63: Middle East & Africa Market Y-o-Y Growth Comparison by Type , 2025-2035
  • Figure 64: Middle East & Africa Market Attractiveness Analysis by Type
  • Figure 65: Middle East & Africa Market Value Share and BPS Analysis by Application, 2025 and 2035
  • Figure 66: Middle East & Africa Market Y-o-Y Growth Comparison by Application, 2025-2035
  • Figure 67: Middle East & Africa Market Attractiveness Analysis by Application
  • Figure 68: Global Market - Tier Structure Analysis
  • Figure 69: Global Market - Company Share Analysis
Dashboard
Dashboard
Dashboard
Dashboard
Dashboard
Dashboard

Our Research Products

Full Research Suite

The "Full Research Suite" delivers actionable market intel, deep dives on markets or technologies, so clients act faster, cut risk, and unlock growth.

Competitor Leaderboard Report

The Leaderboard benchmarks and ranks top vendors, classifying them as Established Leaders, Leading Challengers, or Disruptors & Challengers.

Future Leaders Index

Locates where complements amplify value and substitutes erode it, forecasting net impact by horizon

Market Data & Forecasts

We deliver granular, decision-grade intel: market sizing, 5-year forecasts, pricing, adoption, usage, revenue, and operational KPIs—plus competitor tracking, regulation, and value chains—across 60 countries broadly.

Market Focus Report

Spot the shifts before they hit your P&L. We track inflection points, adoption curves, pricing moves, and ecosystem plays to show where demand is heading, why it is changing, and what to do next across high-growth markets and disruptive tech

Survey Report

Real-time reads of user behavior. We track shifting priorities, perceptions of today’s and next-gen services, and provider experience, then pace how fast tech moves from trial to adoption, blending buyer, consumer, and channel inputs with social signals (#WhySwitch, #UX).

Bespoke Reports

Partner with our analyst team to build a custom report designed around your business priorities. From analysing market trends to assessing competitors or crafting bespoke datasets, we tailor insights to your needs.

Supplier Intelligence

Discovery & Profiling

Capacity & Footprint

Performance & Risk

Compliance & Governance

Commercial Readiness

Who Supplies Whom

Scorecards & Shortlists

Playbooks & Docs

Category Intelligence

Definition & Scope

Demand & Use Cases

Cost Drivers

Market Structure

Supply Chain Map

Trade & Policy

Operating Norms

Deliverables

Buyer Intelligence

Account Basics

Spend & Scope

Procurement Model

Vendor Requirements

Terms & Policies

Entry Strategy

Pain Points & Triggers

Outputs

Pricing Analysis

Benchmarks

Trends

Should-Cost

Indexation

Landed Cost

Commercial Terms

Deliverables

Brand Analysis

Positioning & Value Prop

Share & Presence

Customer Evidence

Go-to-Market

Digital & Reputation

Compliance & Trust

KPIs & Gaps

Outputs

Full Research Suite comprises of:

Market outlook & trends analysis

Market outlook & trends analysis

Interviews & case studies

Interviews & case studies

Strategic recommendations

Strategic recommendations

Vendor profiles & capabilities analysis

Vendor profiles & capabilities analysis

5-year forecasts

5-year forecasts

8 regions and 60+ country-level data splits

8 regions and 60+ country-level data splits

Market segment data splits

Market segment data splits

12 months of continuous data updates

12 months of continuous data updates

DELIVERED AS:

PDF EXCEL ONLINE

Full Research Suite


$5000

$7500

$10000

Buy Report Now
Similar Industry Reports

Similar Industry Reports

Newborn Jaundice Treatment Market

Newborn Jaundice Treatment Market Size and Share Forecast Outlook 2025 to 2035

XEDS Detectors Market

XEDS Detectors Market Size and Share Forecast Outlook 2025 to 2035

Radar Detectors Market

Radar Detectors Market Size and Share Forecast Outlook 2025 to 2035

Flame Detector Market

Flame Detector Market Size and Share Forecast Outlook 2025 to 2035

Smoke Detector Market

Smoke Detector Market Insights – Growth & Forecast through 2034

Cable Detector Market

Cable Detector Market

AI Age Detector Software Market

AI-Powered Age Detection – Future of Digital Verification

Quantum Detector Market

Quantum Detector Market Size and Share Forecast Outlook 2025 to 2035

Voltage Detector Market

Voltage Detector Market Size and Share Forecast Outlook 2025 to 2035

Neutron Detectors Market

Neutron Detectors Market Analysis - Size, Growth, and Forecast 2025 to 2035

Chemical Detector Market

Chemical Detector Market Size and Share Forecast Outlook 2025 to 2035

RF Power Detector Market

RF Power Detector Market

Explosive Detectors Market

Explosive Detectors Market Size and Share Forecast Outlook 2025 to 2035

Total Dust Detector Market

Total Dust Detector Market Size and Share Forecast Outlook 2025 to 2035

Food Metal Detector Market

Food Metal Detector Market Size and Share Forecast Outlook 2025 to 2035

Vacuum Leak Detectors Market

Vacuum Leak Detectors Market Size and Share Forecast Outlook 2025 to 2035

Buried Leak Detector Market

Buried Leak Detector Market Size and Share Forecast Outlook 2025 to 2035

Radiometric Detectors Market

Radiometric Detectors Market Size and Share Forecast Outlook 2025 to 2035

HiToxic Gas Detector Market

HiToxic Gas Detector Market Size and Share Forecast Outlook 2025 to 2035

AI Deepfake Detector Tool Market

AI-Powered Deepfake Detection – Protecting Digital Identities

Future Market Insights

Non-Invasive Jaundice Detector Market

Chat With MaRIA

Chat With

MaRIA

Hi There, I am MaRIA, Your Market Research Intelligence Assistant. How may I help you?