Osteonecrosis Treatment Market
Learn About the Prominent Trends that Keep the Osteonecrosis Treatment Market Players Afloat
Osteonecrosis Treatment Market by Drug Type, Therapy, End User & region - Forecast 2022 - 2032
Osteonecrosis Treatment Market Outlook (2022-2032)
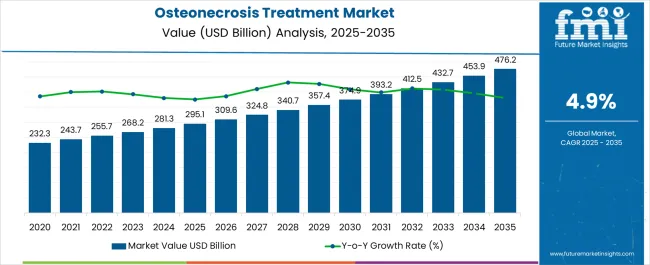
[306 Pages Report] The osteonecrosis treatment market is like to reach US$ 461.7 million by 2032, up from US$ 275.3 million in 2022, expanding at a CAGR of 4.80% during the forecast period.
Osteonecrosis generally occurs in shoulder joints, hip joints, knee joints, and ankle joints. Osteonecrosis is of two types, viz., non-traumatic osteonecrosis and traumatic osteonecrosis. It can be an outcome of reduced blood supply because of a fracture, alarming use of chronic corticosteroids, bone dislocation, and alcohol addiction.
Report Attribute |
Details |
Osteonecrosis Treatment Market Value (2022) |
US$ 275.3 Million |
Osteonecrosis Treatment Market Anticipated Value (2032) |
US$ 461.7 Million |
Osteonecrosis Treatment Projected Growth Rate (2022-2032) |
4.80% |
An important factor responsible for the osteonecrosis treatment market growth is increase in alcohol consumption across the world. The National Institute on Alcohol Abuse and Alcoholism conducted a study and concluded that in the past few years, in the United States alone the number of individuals consuming alcohol has exponentially grown. The osteonecrosis treatment market study also mentions that the number of female alcohol consumers has doubled. Alcohol abuse results in abnormal lipid metabolism and this is a significant risk factor for alcohol induces osteonecrosis and leading to surge of osteonecrosis treatment market key trends and opportunities.
As some of the reasons due to which osteonecrosis occurs are common, there is an increasing prevalence of this medical condition. Therefore, the demand for osteonecrosis treatment is surging and the osteonecrosis treatment market future trends are said to grow exponentially during the forecast period.
Let us know your requirement to get
100% FREE customization
Top Drivers Influencing the Oral Dosing Cups Market Players
- Geriatric population growth:
Increasing geriatric population is leading to rise in hip injuries and this is promoting the osteonecrosis treatment market during the forecast period. Hip injuries such as degeneration or fractures may result in obstructed blood flow to the bone, leading to trauma-related osteonecrosis boosting the osteonecrosis treatment adoption trends.
Alarming cases of traumatic injuries and road accidents coupled with excessive consumption of alcohol across the world is anticipated to promote the osteonecrosis treatment market growth. The consumption of corticosteroids excessively also favors the demand for osteonecrosis treatment and therefore surging the sales of osteonecrosis treatment.
- Biotechnology Companies:
Several measures are taken by biotechnology companies focusing on the development of new treatment options for individuals experiencing osteonecrosis. This too is propelling the global osteonecrosis treatment options escalating the osteonecrosis treatment market future trends.
- Greater Recognition of Non-Invasive Treatment:
The demand for osteonecrosis treatment is said to escalate due to rising awareness pertaining to non-invasive method of osteonecrosis treatment. Since this medical condition is asymptomatic and idiopathic in nature, it is increasing the burden on patient population and is also linked to individuals of any age group.
When osteonecrosis is left untreated, it leads to several complications and therefore there is a higher demand for osteonecrosis treatment, and this is a core osteonecrosis treatment market driving factors.
- R&D activities:
The osteonecrosis treatment market opportunities will surge owing to a greater number of research and development activities for developing novel drug. Additionally, technological advancements for enhanced osteonecrosis treatment coupled with increasing demand for non-invasive treatment are some of the other crucial osteonecrosis treatment market driving factors.
Facets Barring the Osteonecrosis Treatment Market
- No Evidence-Based Conclusion:
Although, there is no result based on evidence that shows the best way to treat or cure osteonecrosis and this could be a hindrance to the osteonecrosis treatment market future trends.
- Lack of Skilled Orthopedic Surgeons
The market driving factors, some factors such as lack of skilled orthopedic surgeons across the globe can restrict the osteonecrosis treatment market growth during the forecast period.
- Deficit of awareness
Lack of awareness amongst individuals pertaining to osteonecrosis is predicted to hinder the osteonecrosis treatment market growth.
- Expensive
Some of the treatments available for osteonecrosis are expensive and this could be a market restraining factor of global osteonecrosis treatment.
- Allocation of Alternative Ways
The main goal after being diagnosed with any disease is to get the condition treated as soon as possible in order to avoid the progression of osteonecrosis symptoms. As a result, the available treatment is expected to significantly decelerate the osteonecrosis treatment market growth.
Find your sweet spots for generating winning opportunities in this market.
Talk to AnalystNorth America to Hold a Significant Market Share in Osteonecrosis Treatment Market
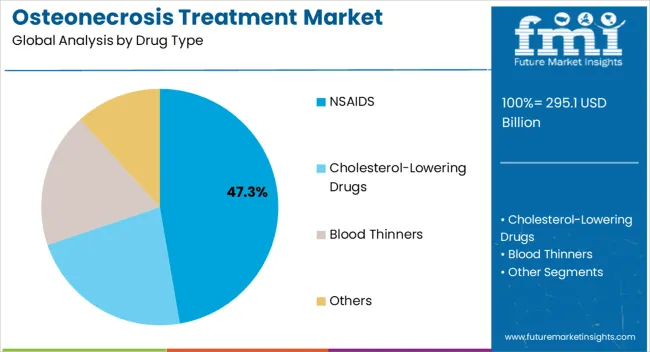
The drug segment has a considerable osteonecrosis treatment market share and is said to be on demand for osteonecrosis treatment during the forecast period owing to it being extremely efficient, lesser side-effects as compared to other therapies, and non-invasive nature.
North America is said to be accountable for major revenue share as it holds 37.80% osteonecrosis treatment market share due to higher adoption of advanced treatment option and more concentration of key osteonecrosis treatment market manufacturers. In this region, higher adoption of osteonecrosis treatment methods is witnessed in the United States.
Increasing geriatric population coupled with growing awareness of the medical condition and the diagnosis of the same amongst people in this region is said to boost the osteonecrosis treatment market growth. Increasing number of inorganic growth strategies by market players, North America is anticipated to dominate its position in the osteonecrosis treatment market.
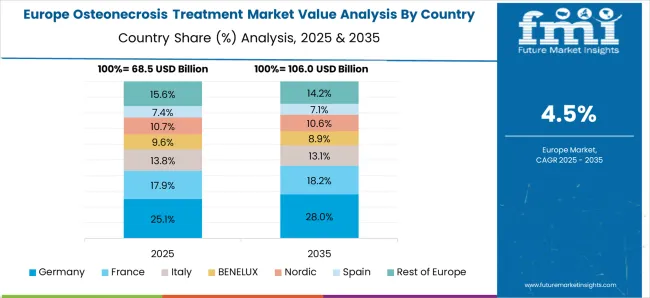
What is the Regional Outlook for the European Osteonecrosis Treatment Market?
Europe is said to hold a 31.30% osteonecrosis treatment market share. This region portrays a higher growth rate owing to increasing number of surgical procedures such as joint replacements. Increasing healthcare expenditure and rising number of bone disorders are also responsible for the osteonecrosis treatment market growth of Europe.
Presence of well-established healthcare infrastructure, technological advancements, and launch of novel drugs and treatment options of osteonecrosis are also propelling the osteonecrosis treatment market growth in Europe.

A unified Market Research Subscription Platform, built for today's disparate research needs.
How is the Start-up Ecosystem in the Osteonecrosis Treatment Market?
Various osteonecrosis treatment market opportunities exist in osteonecrosis treatment as many market players in this industry are aiming on extra expenditure on research and development activities to generate therapies for osteonecrosis.
GreenBone Ortho, an Italian start-up developed an advanced biomimetic material – a huge bone graft scaffold with a distinctive combination of mechanical strength, porosity, and chemical composition. It will provide a framework where new and living bone may grow and replace the affected one.
Who are the Key Players in the Osteonecrosis Treatment Market?
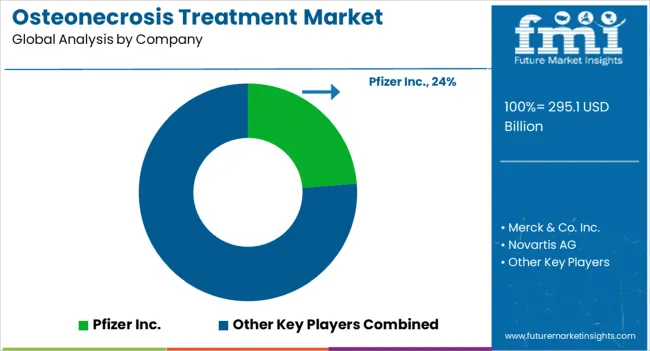
Some of the key players in the osteonecrosis treatment market are Pfizer Inc., Merck & Co. Inc., Novartis AG, Teva Pharmaceutical Industries Ltd, Bone Therapeutics SA, Regrow Biosciences, Mylan NV, Vericel Corporation, and Zimmer Biomet, and Enzo Biochem Inc.
Sr. No. |
1 |
Year |
June 2022 |
Key Player |
Merck & Co. Inc. |
Strategy Employed |
Merck & Co. Inc. announced the launch of the Merck Digital Sciences Studio (MDSS) to enable the next generation of innovative drug discovery and development technologies. |
Sr. No. |
2 |
Year |
May 2022 |
Key Player |
Regrow Biosciences |
Strategy Employed | Regrow Biosciences announced that it has received approval from the USFDA to conduct a phase 2 trial of its flagship product, OSSGROW, which is an orphan drug that aids in the treatment of osteonecrosis. |
Sr. No. |
3 |
Year |
April 2021 |
Key Player |
ECI Pharmaceuticals, LLC |
Strategy Employed | Regrow Biosciences announced that it has received approval from the USFDA to conduct a phase 2 trial of its flagship product, OSSGROW, which is an orphan drug that aids in the treatment of osteonecrosis. |
Report Scope
Report Attribute |
Details |
Growth Rate |
CAGR of 4.80% from 2022 to 2032 |
Base Year for Estimation |
2021 |
Historical Data |
2016-2021 |
Forecast Period |
2022-2032 |
Quantitative Units |
Revenue in USD million and CAGR from 2022-2032 |
Report Coverage |
Revenue Forecast, Volume Forecast, Company Ranking, Competitive Landscape, Growth Factors, Trends and Pricing Analysis |
Segments Covered |
|
Regions Covered |
|
Key Countries Profiled |
|
Key Companies Profiled |
|
Customization |
Available Upon Request |
Key Segments of the Osteonecrosis Treatment Market
By Drug Type:
- NSAIDS
- Cholesterol-Lowering Drugs
- Blood Thinners
- Others
By Therapy:
- Stem Cell Therapy
- Joint Replacement Surgery
By End User:
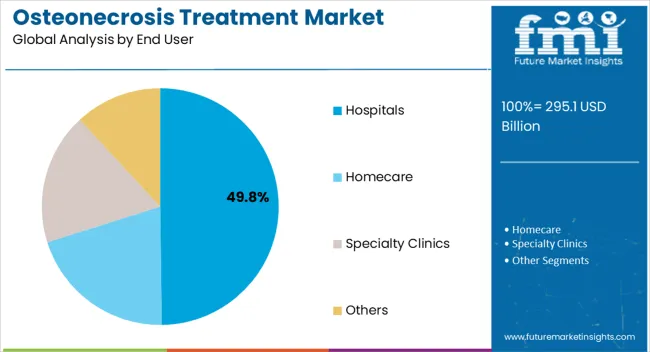
- Hospitals
- Homecare
- Specialty Clinics
- Others
By Region:
- North America
- Latin America
- Asia Pacific
- Middle East and Africa
- Europe
Frequently Asked Questions
The growth outlook for the osteonecrosis treatment market is predicted to advance at a CAGR of 4.80% from 2022 to 2032.
The North American region is anticipated to lead the osteonecrosis treatment market during the forecast period.
The osteonecrosis treatment market is likely to hold a valuation of US$ 461.7 million by 2032.
The osteonecrosis treatment market is likely to record a value of US$ 275.3 million in 2022.
Table of Content
1. Executive Summary
1.1. Global Market Outlook
1.2. Demand-side Trends
1.3. Supply-side Trends
1.4. Technology Roadmap Analysis
1.5. Analysis and Recommendations
2. Market Overview
2.1. Market Coverage / Taxonomy
2.2. Market Definition / Scope / Limitations
3. Market Background
3.1. Market Dynamics
3.1.1. Drivers
3.1.2. Restraints
3.1.3. Opportunity
3.1.4. Trends
3.2. Scenario Forecast
3.2.1. Demand in Optimistic Scenario
3.2.2. Demand in Likely Scenario
3.2.3. Demand in Conservative Scenario
3.3. Opportunity Map Analysis
3.4. Investment Feasibility Matrix
3.5. PESTLE and Porter’s Analysis
3.6. Regulatory Landscape
3.6.1. By Key Regions
3.6.2. By Key Countries
3.7. Regional Parent Market Outlook
4. Global Osteonecrosis Treatment Market Analysis 2017-2021 and Forecast, 2022-2032
4.1. Historical Market Size Value (US$ Mn) Analysis, 2017-2021
4.2. Current and Future Market Size Value (US$ Mn) Projections, 2022-2032
4.2.1. Y-o-Y Growth Trend Analysis
4.2.2. Absolute $ Opportunity Analysis
5. Global Osteonecrosis Treatment Market Analysis 2017-2021 and Forecast 2022-2032, By Drug Type
5.1. Introduction / Key Findings
5.2. Historical Market Size Value (US$ Mn) Analysis By Drug Type, 2017-2021
5.3. Current and Future Market Size Value (US$ Mn) Analysis and Forecast By Drug Type, 2022-2032
5.3.1. NSAIDS
5.3.2. Blood Thinners
5.3.3. Others
5.4. Y-o-Y Growth Trend Analysis By Drug Type, 2017-2021
5.5. Absolute $ Opportunity Analysis By Drug Type, 2022-2032
6. Global Osteonecrosis Treatment Market Analysis 2017-2021 and Forecast 2022-2032, By End User
6.1. Introduction / Key Findings
6.2. Historical Market Size Value (US$ Mn) Analysis By End User, 2017-2021
6.3. Current and Future Market Size Value (US$ Mn) Analysis and Forecast By End User, 2022-2032
6.3.1. Hospitals
6.3.2. Clinics
6.3.3. Ambulatory Surgical Centers
6.4. Y-o-Y Growth Trend Analysis By End User, 2017-2021
6.5. Absolute $ Opportunity Analysis By End User, 2022-2032
7. Global Osteonecrosis Treatment Market Analysis 2017-2021 and Forecast 2022-2032, By Region
7.1. Introduction
7.2. Historical Market Size Value (US$ Mn) Analysis By Region, 2017-2021
7.3. Current Market Size Value (US$ Mn) Analysis and Forecast By Region, 2022-2032
7.3.1. North America
7.3.2. Latin America
7.3.3. Europe
7.3.4. Asia Pacific
7.3.5. MEA
7.4. Market Attractiveness Analysis By Region
8. North America Osteonecrosis Treatment Market Analysis 2017-2021 and Forecast 2022-2032, By Country
8.1. Historical Market Size Value (US$ Mn) Trend Analysis By Market Taxonomy, 2017-2021
8.2. Market Size Value (US$ Mn) Forecast By Market Taxonomy, 2022-2032
8.2.1. By Country
8.2.1.1. US
8.2.1.2. Canada
8.2.2. By Drug Type
8.2.3. By End User
8.3. Market Attractiveness Analysis
8.3.1. By Country
8.3.2. By Drug Type
8.3.3. By End User
8.4. Key Takeaways
9. Latin America Osteonecrosis Treatment Market Analysis 2017-2021 and Forecast 2022-2032, By Country
9.1. Historical Market Size Value (US$ Mn) Trend Analysis By Market Taxonomy, 2017-2021
9.2. Market Size Value (US$ Mn) Forecast By Market Taxonomy, 2022-2032
9.2.1. By Country
9.2.1.1. Brazil
9.2.1.2. Mexico
9.2.1.3. Rest of Latin America
9.2.2. By Drug Type
9.2.3. By End User
9.3. Market Attractiveness Analysis
9.3.1. By Country
9.3.2. By Drug Type
9.3.3. By End User
9.4. Key Takeaways
10. Europe Osteonecrosis Treatment Market Analysis 2017-2021 and Forecast 2022-2032, By Country
10.1. Historical Market Size Value (US$ Mn) Trend Analysis By Market Taxonomy, 2017-2021
10.2. Market Size Value (US$ Mn) Forecast By Market Taxonomy, 2022-2032
10.2.1. By Country
10.2.1.1. Germany
10.2.1.2. U.K.
10.2.1.3. France
10.2.1.4. Spain
10.2.1.5. Italy
10.2.1.6. Rest of Europe
10.2.2. By Drug Type
10.2.3. By End User
10.3. Market Attractiveness Analysis
10.3.1. By Country
10.3.2. By Drug Type
10.3.3. By End User
10.4. Key Takeaways
11. Asia Pacific Osteonecrosis Treatment Market Analysis 2017-2021 and Forecast 2022-2032, By Country
11.1. Historical Market Size Value (US$ Mn) Trend Analysis By Market Taxonomy, 2017-2021
11.2. Market Size Value (US$ Mn) Forecast By Market Taxonomy, 2022-2032
11.2.1. By Country
11.2.1.1. China
11.2.1.2. Japan
11.2.1.3. South Korea
11.2.1.4. Rest of Asia Pacific
11.2.2. By Drug Type
11.2.3. By End User
11.3. Market Attractiveness Analysis
11.3.1. By Country
11.3.2. By Drug Type
11.3.3. By End User
11.4. Key Takeaways
12. MEA Osteonecrosis Treatment Market Analysis 2017-2021 and Forecast 2022-2032, By Country
12.1. Historical Market Size Value (US$ Mn) Trend Analysis By Market Taxonomy, 2017-2021
12.2. Market Size Value (US$ Mn) Forecast By Market Taxonomy, 2022-2032
12.2.1. By Country
12.2.1.1. GCC Countries
12.2.1.2. South Africa
12.2.1.3. Israel
12.2.1.4. Rest of MEA
12.2.2. By Drug Type
12.2.3. By End User
12.3. Market Attractiveness Analysis
12.3.1. By Country
12.3.2. By Drug Type
12.3.3. By End User
12.4. Key Takeaways
13. Key Countries Osteonecrosis Treatment Market Analysis
13.1. US
13.1.1. Pricing Analysis
13.1.2. Market Share Analysis, 2021
13.1.2.1. By Drug Type
13.1.2.2. By End User
13.2. Canada
13.2.1. Pricing Analysis
13.2.2. Market Share Analysis, 2021
13.2.2.1. By Drug Type
13.2.2.2. By End User
13.3. Brazil
13.3.1. Pricing Analysis
13.3.2. Market Share Analysis, 2021
13.3.2.1. By Drug Type
13.3.2.2. By End User
13.4. Mexico
13.4.1. Pricing Analysis
13.4.2. Market Share Analysis, 2021
13.4.2.1. By Drug Type
13.4.2.2. By End User
13.5. Germany
13.5.1. Pricing Analysis
13.5.2. Market Share Analysis, 2021
13.5.2.1. By Drug Type
13.5.2.2. By End User
13.6. U.K.
13.6.1. Pricing Analysis
13.6.2. Market Share Analysis, 2021
13.6.2.1. By Drug Type
13.6.2.2. By End User
13.7. France
13.7.1. Pricing Analysis
13.7.2. Market Share Analysis, 2021
13.7.2.1. By Drug Type
13.7.2.2. By End User
13.8. Spain
13.8.1. Pricing Analysis
13.8.2. Market Share Analysis, 2021
13.8.2.1. By Drug Type
13.8.2.2. By End User
13.9. Italy
13.9.1. Pricing Analysis
13.9.2. Market Share Analysis, 2021
13.9.2.1. By Drug Type
13.9.2.2. By End User
13.10. China
13.10.1. Pricing Analysis
13.10.2. Market Share Analysis, 2021
13.10.2.1. By Drug Type
13.10.2.2. By End User
13.11. Japan
13.11.1. Pricing Analysis
13.11.2. Market Share Analysis, 2021
13.11.2.1. By Drug Type
13.11.2.2. By End User
13.12. South Korea
13.12.1. Pricing Analysis
13.12.2. Market Share Analysis, 2021
13.12.2.1. By Drug Type
13.12.2.2. By End User
13.13. GCC Countries
13.13.1. Pricing Analysis
13.13.2. Market Share Analysis, 2021
13.13.2.1. By Drug Type
13.13.2.2. By End User
13.14. South Africa
13.14.1. Pricing Analysis
13.14.2. Market Share Analysis, 2021
13.14.2.1. By Drug Type
13.14.2.2. By End User
13.15. Israel
13.15.1. Pricing Analysis
13.15.2. Market Share Analysis, 2021
13.15.2.1. By Drug Type
13.15.2.2. By End User
14. Market Structure Analysis
14.1. Competition Dashboard
14.2. Competition Benchmarking
14.3. Market Share Analysis of Top Players
14.3.1. By Regional
14.3.2. By Drug Type
14.3.3. By End User
15. Competition Analysis
15.1. Competition Deep Dive
15.1.1. Novartis AG
15.1.1.1. Overview
15.1.1.2. Product Portfolio
15.1.1.3. Profitability by Market Segments
15.1.1.4. Sales Footprint
15.1.1.5. Strategy Overview
15.1.1.5.1. Marketing Strategy
15.1.2. Pfizer Inc.
15.1.2.1. Overview
15.1.2.2. Product Portfolio
15.1.2.3. Profitability by Market Segments
15.1.2.4. Sales Footprint
15.1.2.5. Strategy Overview
15.1.2.5.1. Marketing Strategy
15.1.3. Teva Pharmaceutical Industries Ltd
15.1.3.1. Overview
15.1.3.2. Product Portfolio
15.1.3.3. Profitability by Market Segments
15.1.3.4. Sales Footprint
15.1.3.5. Strategy Overview
15.1.3.5.1. Marketing Strategy
15.1.4. Mylan NV
15.1.4.1. Overview
15.1.4.2. Product Portfolio
15.1.4.3. Profitability by Market Segments
15.1.4.4. Sales Footprint
15.1.4.5. Strategy Overview
15.1.4.5.1. Marketing Strategy
15.1.5. Zimmer Biomet
15.1.5.1. Overview
15.1.5.2. Product Portfolio
15.1.5.3. Profitability by Market Segments
15.1.5.4. Sales Footprint
15.1.5.5. Strategy Overview
15.1.5.5.1. Marketing Strategy
15.1.6. Merck & Co. Inc.
15.1.6.1. Overview
15.1.6.2. Product Portfolio
15.1.6.3. Profitability by Market Segments
15.1.6.4. Sales Footprint
15.1.6.5. Strategy Overview
15.1.6.5.1. Marketing Strategy
15.1.7. Enzo Biochem Inc.
15.1.7.1. Overview
15.1.7.2. Product Portfolio
15.1.7.3. Profitability by Market Segments
15.1.7.4. Sales Footprint
15.1.7.5. Strategy Overview
15.1.7.5.1. Marketing Strategy
15.1.8. Bone Therapeutics SA
15.1.8.1. Overview
15.1.8.2. Product Portfolio
15.1.8.3. Profitability by Market Segments
15.1.8.4. Sales Footprint
15.1.8.5. Strategy Overview
15.1.8.5.1. Marketing Strategy
15.1.9. Vericel Corporation
15.1.9.1. Overview
15.1.9.2. Product Portfolio
15.1.9.3. Profitability by Market Segments
15.1.9.4. Sales Footprint
15.1.9.5. Strategy Overview
15.1.9.5.1. Marketing Strategy
15.1.10. Johnson & Johnson
15.1.10.1. Overview
15.1.10.2. Product Portfolio
15.1.10.3. Profitability by Market Segments
15.1.10.4. Sales Footprint
15.1.10.5. Strategy Overview
15.1.10.5.1. Marketing Strategy
15.1.11. Integra LifeSciences
15.1.11.1. Overview
15.1.11.2. Product Portfolio
15.1.11.3. Profitability by Market Segments
15.1.11.4. Sales Footprint
15.1.11.5. Strategy Overview
15.1.11.5.1. Marketing Strategy
15.1.12. F. Hoffmann-La Roche Ltd
15.1.12.1. Overview
15.1.12.2. Product Portfolio
15.1.12.3. Profitability by Market Segments
15.1.12.4. Sales Footprint
15.1.12.5. Strategy Overview
15.1.12.5.1. Marketing Strategy
15.1.13. Glenmark Pharmaceuticals
15.1.13.1. Overview
15.1.13.2. Product Portfolio
15.1.13.3. Profitability by Market Segments
15.1.13.4. Sales Footprint
15.1.13.5. Strategy Overview
15.1.13.5.1. Marketing Strategy
15.1.14. Amgen Inc
15.1.14.1. Overview
15.1.14.2. Product Portfolio
15.1.14.3. Profitability by Market Segments
15.1.14.4. Sales Footprint
15.1.14.5. Strategy Overview
15.1.14.5.1. Marketing Strategy
15.1.15. Exactech
15.1.15.1. Overview
15.1.15.2. Product Portfolio
15.1.15.3. Profitability by Market Segments
15.1.15.4. Sales Footprint
15.1.15.5. Strategy Overview
15.1.15.5.1. Marketing Strategy
15.1.16. Solvay
15.1.16.1. Overview
15.1.16.2. Product Portfolio
15.1.16.3. Profitability by Market Segments
15.1.16.4. Sales Footprint
15.1.16.5. Strategy Overview
15.1.16.5.1. Marketing Strategy
15.1.17. GlaxoSmithKline plc
15.1.17.1. Overview
15.1.17.2. Product Portfolio
15.1.17.3. Profitability by Market Segments
15.1.17.4. Sales Footprint
15.1.17.5. Strategy Overview
15.1.17.5.1. Marketing Strategy
16. Assumptions & Acronyms Used
17. Research Methodology
Let us know your requirement to get
100% FREE customization
List of Tables
Table 1: Global Osteonecrosis Treatment Market Value (US$ Mn) Forecast by Region, 2017-2032
Table 2: Global Osteonecrosis Treatment Market Value (US$ Mn) Forecast by Drug Type, 2017-2032
Table 3: Global Osteonecrosis Treatment Market Value (US$ Mn) Forecast by End User, 2017-2032
Table 4: North America Osteonecrosis Treatment Market Value (US$ Mn) Forecast by Country, 2017-2032
Table 5: North America Osteonecrosis Treatment Market Value (US$ Mn) Forecast by Drug Type, 2017-2032
Table 6: North America Osteonecrosis Treatment Market Value (US$ Mn) Forecast by End User, 2017-2032
Table 7: Latin America Osteonecrosis Treatment Market Value (US$ Mn) Forecast by Country, 2017-2032
Table 8: Latin America Osteonecrosis Treatment Market Value (US$ Mn) Forecast by Drug Type, 2017-2032
Table 9: Latin America Osteonecrosis Treatment Market Value (US$ Mn) Forecast by End User, 2017-2032
Table 10: Europe Osteonecrosis Treatment Market Value (US$ Mn) Forecast by Country, 2017-2032
Table 11: Europe Osteonecrosis Treatment Market Value (US$ Mn) Forecast by Drug Type, 2017-2032
Table 12: Europe Osteonecrosis Treatment Market Value (US$ Mn) Forecast by End User, 2017-2032
Table 13: Asia Pacific Osteonecrosis Treatment Market Value (US$ Mn) Forecast by Country, 2017-2032
Table 14: Asia Pacific Osteonecrosis Treatment Market Value (US$ Mn) Forecast by Drug Type, 2017-2032
Table 15: Asia Pacific Osteonecrosis Treatment Market Value (US$ Mn) Forecast by End User, 2017-2032
Table 16: MEA Osteonecrosis Treatment Market Value (US$ Mn) Forecast by Country, 2017-2032
Table 17: MEA Osteonecrosis Treatment Market Value (US$ Mn) Forecast by Drug Type, 2017-2032
Table 18: MEA Osteonecrosis Treatment Market Value (US$ Mn) Forecast by End User, 2017-2032
Find your sweet spots for generating winning opportunities in this market.
Talk to AnalystList of Charts
Figure 1: Global Osteonecrosis Treatment Market Value (US$ Mn) by Drug Type, 2022-2032
Figure 2: Global Osteonecrosis Treatment Market Value (US$ Mn) by End User, 2022-2032
Figure 3: Global Osteonecrosis Treatment Market Value (US$ Mn) by Region, 2022-2032
Figure 4: Global Osteonecrosis Treatment Market Value (US$ Mn) Analysis by Region, 2017-2032
Figure 5: Global Osteonecrosis Treatment Market Value Share (%) and BPS Analysis by Region, 2022-2032
Figure 6: Global Osteonecrosis Treatment Market Y-o-Y Growth (%) Projections by Region, 2022-2032
Figure 7: Global Osteonecrosis Treatment Market Value (US$ Mn) Analysis by Drug Type, 2017-2032
Figure 8: Global Osteonecrosis Treatment Market Value Share (%) and BPS Analysis by Drug Type, 2022-2032
Figure 9: Global Osteonecrosis Treatment Market Y-o-Y Growth (%) Projections by Drug Type, 2022-2032
Figure 10: Global Osteonecrosis Treatment Market Value (US$ Mn) Analysis by End User, 2017-2032
Figure 11: Global Osteonecrosis Treatment Market Value Share (%) and BPS Analysis by End User, 2022-2032
Figure 12: Global Osteonecrosis Treatment Market Y-o-Y Growth (%) Projections by End User, 2022-2032
Figure 13: Global Osteonecrosis Treatment Market Attractiveness by Drug Type, 2022-2032
Figure 14: Global Osteonecrosis Treatment Market Attractiveness by End User, 2022-2032
Figure 15: Global Osteonecrosis Treatment Market Attractiveness by Region, 2022-2032
Figure 16: North America Osteonecrosis Treatment Market Value (US$ Mn) by Drug Type, 2022-2032
Figure 17: North America Osteonecrosis Treatment Market Value (US$ Mn) by End User, 2022-2032
Figure 18: North America Osteonecrosis Treatment Market Value (US$ Mn) by Country, 2022-2032
Figure 19: North America Osteonecrosis Treatment Market Value (US$ Mn) Analysis by Country, 2017-2032
Figure 20: North America Osteonecrosis Treatment Market Value Share (%) and BPS Analysis by Country, 2022-2032
Figure 21: North America Osteonecrosis Treatment Market Y-o-Y Growth (%) Projections by Country, 2022-2032
Figure 22: North America Osteonecrosis Treatment Market Value (US$ Mn) Analysis by Drug Type, 2017-2032
Figure 23: North America Osteonecrosis Treatment Market Value Share (%) and BPS Analysis by Drug Type, 2022-2032
Figure 24: North America Osteonecrosis Treatment Market Y-o-Y Growth (%) Projections by Drug Type, 2022-2032
Figure 25: North America Osteonecrosis Treatment Market Value (US$ Mn) Analysis by End User, 2017-2032
Figure 26: North America Osteonecrosis Treatment Market Value Share (%) and BPS Analysis by End User, 2022-2032
Figure 27: North America Osteonecrosis Treatment Market Y-o-Y Growth (%) Projections by End User, 2022-2032
Figure 28: North America Osteonecrosis Treatment Market Attractiveness by Drug Type, 2022-2032
Figure 29: North America Osteonecrosis Treatment Market Attractiveness by End User, 2022-2032
Figure 30: North America Osteonecrosis Treatment Market Attractiveness by Country, 2022-2032
Figure 31: Latin America Osteonecrosis Treatment Market Value (US$ Mn) by Drug Type, 2022-2032
Figure 32: Latin America Osteonecrosis Treatment Market Value (US$ Mn) by End User, 2022-2032
Figure 33: Latin America Osteonecrosis Treatment Market Value (US$ Mn) by Country, 2022-2032
Figure 34: Latin America Osteonecrosis Treatment Market Value (US$ Mn) Analysis by Country, 2017-2032
Figure 35: Latin America Osteonecrosis Treatment Market Value Share (%) and BPS Analysis by Country, 2022-2032
Figure 36: Latin America Osteonecrosis Treatment Market Y-o-Y Growth (%) Projections by Country, 2022-2032
Figure 37: Latin America Osteonecrosis Treatment Market Value (US$ Mn) Analysis by Drug Type, 2017-2032
Figure 38: Latin America Osteonecrosis Treatment Market Value Share (%) and BPS Analysis by Drug Type, 2022-2032
Figure 39: Latin America Osteonecrosis Treatment Market Y-o-Y Growth (%) Projections by Drug Type, 2022-2032
Figure 40: Latin America Osteonecrosis Treatment Market Value (US$ Mn) Analysis by End User, 2017-2032
Figure 41: Latin America Osteonecrosis Treatment Market Value Share (%) and BPS Analysis by End User, 2022-2032
Figure 42: Latin America Osteonecrosis Treatment Market Y-o-Y Growth (%) Projections by End User, 2022-2032
Figure 43: Latin America Osteonecrosis Treatment Market Attractiveness by Drug Type, 2022-2032
Figure 44: Latin America Osteonecrosis Treatment Market Attractiveness by End User, 2022-2032
Figure 45: Latin America Osteonecrosis Treatment Market Attractiveness by Country, 2022-2032
Figure 46: Europe Osteonecrosis Treatment Market Value (US$ Mn) by Drug Type, 2022-2032
Figure 47: Europe Osteonecrosis Treatment Market Value (US$ Mn) by End User, 2022-2032
Figure 48: Europe Osteonecrosis Treatment Market Value (US$ Mn) by Country, 2022-2032
Figure 49: Europe Osteonecrosis Treatment Market Value (US$ Mn) Analysis by Country, 2017-2032
Figure 50: Europe Osteonecrosis Treatment Market Value Share (%) and BPS Analysis by Country, 2022-2032
Figure 51: Europe Osteonecrosis Treatment Market Y-o-Y Growth (%) Projections by Country, 2022-2032
Figure 52: Europe Osteonecrosis Treatment Market Value (US$ Mn) Analysis by Drug Type, 2017-2032
Figure 53: Europe Osteonecrosis Treatment Market Value Share (%) and BPS Analysis by Drug Type, 2022-2032
Figure 54: Europe Osteonecrosis Treatment Market Y-o-Y Growth (%) Projections by Drug Type, 2022-2032
Figure 55: Europe Osteonecrosis Treatment Market Value (US$ Mn) Analysis by End User, 2017-2032
Figure 56: Europe Osteonecrosis Treatment Market Value Share (%) and BPS Analysis by End User, 2022-2032
Figure 57: Europe Osteonecrosis Treatment Market Y-o-Y Growth (%) Projections by End User, 2022-2032
Figure 58: Europe Osteonecrosis Treatment Market Attractiveness by Drug Type, 2022-2032
Figure 59: Europe Osteonecrosis Treatment Market Attractiveness by End User, 2022-2032
Figure 60: Europe Osteonecrosis Treatment Market Attractiveness by Country, 2022-2032
Figure 61: Asia Pacific Osteonecrosis Treatment Market Value (US$ Mn) by Drug Type, 2022-2032
Figure 62: Asia Pacific Osteonecrosis Treatment Market Value (US$ Mn) by End User, 2022-2032
Figure 63: Asia Pacific Osteonecrosis Treatment Market Value (US$ Mn) by Country, 2022-2032
Figure 64: Asia Pacific Osteonecrosis Treatment Market Value (US$ Mn) Analysis by Country, 2017-2032
Figure 65: Asia Pacific Osteonecrosis Treatment Market Value Share (%) and BPS Analysis by Country, 2022-2032
Figure 66: Asia Pacific Osteonecrosis Treatment Market Y-o-Y Growth (%) Projections by Country, 2022-2032
Figure 67: Asia Pacific Osteonecrosis Treatment Market Value (US$ Mn) Analysis by Drug Type, 2017-2032
Figure 68: Asia Pacific Osteonecrosis Treatment Market Value Share (%) and BPS Analysis by Drug Type, 2022-2032
Figure 69: Asia Pacific Osteonecrosis Treatment Market Y-o-Y Growth (%) Projections by Drug Type, 2022-2032
Figure 70: Asia Pacific Osteonecrosis Treatment Market Value (US$ Mn) Analysis by End User, 2017-2032
Figure 71: Asia Pacific Osteonecrosis Treatment Market Value Share (%) and BPS Analysis by End User, 2022-2032
Figure 72: Asia Pacific Osteonecrosis Treatment Market Y-o-Y Growth (%) Projections by End User, 2022-2032
Figure 73: Asia Pacific Osteonecrosis Treatment Market Attractiveness by Drug Type, 2022-2032
Figure 74: Asia Pacific Osteonecrosis Treatment Market Attractiveness by End User, 2022-2032
Figure 75: Asia Pacific Osteonecrosis Treatment Market Attractiveness by Country, 2022-2032
Figure 76: MEA Osteonecrosis Treatment Market Value (US$ Mn) by Drug Type, 2022-2032
Figure 77: MEA Osteonecrosis Treatment Market Value (US$ Mn) by End User, 2022-2032
Figure 78: MEA Osteonecrosis Treatment Market Value (US$ Mn) by Country, 2022-2032
Figure 79: MEA Osteonecrosis Treatment Market Value (US$ Mn) Analysis by Country, 2017-2032
Figure 80: MEA Osteonecrosis Treatment Market Value Share (%) and BPS Analysis by Country, 2022-2032
Figure 81: MEA Osteonecrosis Treatment Market Y-o-Y Growth (%) Projections by Country, 2022-2032
Figure 82: MEA Osteonecrosis Treatment Market Value (US$ Mn) Analysis by Drug Type, 2017-2032
Figure 83: MEA Osteonecrosis Treatment Market Value Share (%) and BPS Analysis by Drug Type, 2022-2032
Figure 84: MEA Osteonecrosis Treatment Market Y-o-Y Growth (%) Projections by Drug Type, 2022-2032
Figure 85: MEA Osteonecrosis Treatment Market Value (US$ Mn) Analysis by End User, 2017-2032
Figure 86: MEA Osteonecrosis Treatment Market Value Share (%) and BPS Analysis by End User, 2022-2032
Figure 87: MEA Osteonecrosis Treatment Market Y-o-Y Growth (%) Projections by End User, 2022-2032
Figure 88: MEA Osteonecrosis Treatment Market Attractiveness by Drug Type, 2022-2032
Figure 89: MEA Osteonecrosis Treatment Market Attractiveness by End User, 2022-2032
Figure 90: MEA Osteonecrosis Treatment Market Attractiveness by Country, 2022-2032
Need specific information?
Request CustomizationExplore Healthcare Insights
View Reports