

- Market Size (2026)
- USD 700.0 Mn
- Forecast (2036)
- USD 1700.0 Mn
- CAGR (2026 to 2036)
- 9.3%
How big is Packaging Artwork Management Software Market in 2026?
Sales in the packaging artwork management software market are projected to grow at 9.3% CAGR through 2036. Market size rises from USD 650.0 million in 2025 to USD 700.0 million in 2026 and is expected to reach USD 1,700.0 million by 2036.
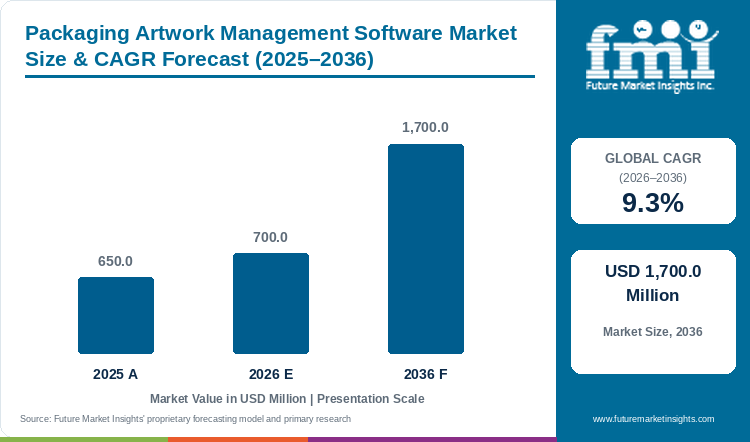
As per recently updated analysis by FMI, the global packaging artwork management software market was valued at USD 650.0 million in 2025 and is projected to grow from USD 700.0 million in 2026 to USD 1,700.0 million by 2036, at 9.3% CAGR from 2026 to 2036. Software led the component category with 72.0% share in 2026, as recurring review, proofing and audit work remains inside the platform. In September 2025, Esko introduced WebCenter Go with automated checks covering allergens, barcodes and FDA formatting.[1] This widens access for growing brands handling several pack versions. Loftware reported in July 2025 that Lakeview Farms reduced launch times by 50% and manual processes by more than 90% after artwork workflow automation.[2] The result links adoption with shorter review and fewer handoffs. The U.S. FDA estimated annual relabeling costs of USD 66 million to USD 154 million under its proposed front-of-package nutrition rule.[3] Such relabeling activity creates repeated artwork comparison, approval and release work.
Key Market Trends & Insights
- By component, software led the market with 72.0% share in 2026, supported by recurring artwork review and retained version history.
- By deployment mode, cloud-based platforms accounted for 64.0% in 2026, as brand teams, agencies, printers and regulatory reviewers requires access to the same current file.
- By application, food and beverage represented the leading 25.0% share in 2026, owing to repeated changes in ingredients, allergens, nutrition panels and product claims.
- By enterprise size, large enterprises held 61.0% share in 2026, with multi-country portfolios creating more pack sizes, language versions and approval stages.
- By end user, manufacturers accounted for 52.0% of demand in 2026, since manufacturers release the print-ready specification and carry the cost of an older file reaching production.
Regional Highlights
- Fastest-growing profiled country: Japan (8.4% CAGR, 2026 to 2036).
- The United States (7.8%) and Switzerland (7.6%) follow, while the United Kingdom records the lowest profiled CAGR at 7.3% through 2036.
Market Size & Forecast
Table 1: Market Size and Forecast for the Packaging Artwork Management Software Market (USD million), 2025 to 2036
| Metric | Value |
|---|---|
| 2025 Market Size | USD 650.0 million |
| Estimated Market Size in 2026 | USD 700.0 million |
| Projected Market Size by 2036 | USD 1,700.0 million |
| CAGR, 2026 to 2036 | 9.3% |
| Added Revenue, 2026 to 2036 | USD 1,000.0 million |
| Market Expansion Multiple | 2.43x |
Artwork volume, rather than the number of software users alone, forms the stronger demand denominator for this market. One product change can move across several sizes, countries and print files, due to which the same approved information creates several review events. Orion completed 8,000 artwork projects during its first year using the Loftware platform.[4] Mariani Packing Company later centralized more than 100 international SKUs, along with approvals, certifications and revision history.[5] These figures indicate that demand expands when more SKUs and artwork projects are placed inside one controlled process. However, every integration requires product records, approval roles and system connections to be defined before recurring work can move into the platform. The market opportunity is therefore supported by high artwork workload, while qualification and implementation limits the addressable demand among smaller or less structured manufacturers.
Artwork Workload and Compliance Indicators
Packaging artwork management software receives repeat demand when regulated content changes across a wider SKU base. Every revision requires comparison, approval and release, due to which artwork projects continue after the first platform installation. The following indicators show artwork workload, operating improvement and compliance activity supporting the market forecast.
Table 2: Artwork Workload and Compliance Indicators for the Packaging Artwork Management Software Market (projects, SKUs, percentages, and USD million), mixed reporting years from 2025 to 2026
| Indicator | Data Point | Why It Matters | Source |
|---|---|---|---|
| Artwork project volume | 8,000 projects in the first year | Shows recurring project volume that supports workflow, proofing and version-control demand. | [4] |
| International SKU coverage | More than 100 SKUs | A wider SKU base creates repeated language, pack-size and approval work. | [5] |
| Launch-time improvement | 50% reduction | Connects software use with faster movement from artwork review to release. | [2] |
| Manual-process reduction | More than 90% | Indicates the amount of email, file and approval work that can move into one platform. | [2] |
| Annual relabeling cost | USD 66 million to USD 154 million | Shows the scale of packaging change created by one proposed labeling rule. | [3] |
Source numbers correspond with the report bibliography. Mixed years are retained because company operating results and regulatory cost estimates were reported in different periods.
Analyst Perspective
“Regulated manufacturers will prefer artwork platforms that keep approved content, visual proofing and release control inside one record. Suppliers reducing review time while retaining ownership of every pack change will receive higher preference across regulated applications.”
- Nandini Roy Choudhury, Principal Consultant, Future Market Insights.
How is the packaging artwork management software market segmented?
The report states that packaging artwork management software market is segmented by component, deployment mode, application, enterprise size, end user, and region. In 2026, software is projected at 72.0%, cloud-based deployment at 64.0%, food and beverage at 25.0%, large enterprises at 61.0%, and manufacturers at 52.0%.
- By component: Software and Services.
- By deployment mode: Cloud-based and On-premises.
- By application: Food and Beverage, Pharmaceuticals, Consumer Goods, Retail, Cosmetics and Personal Care, and Other.
- By enterprise size: Large Enterprises and Small and Medium Enterprises.
- By end user: Manufacturers, Packaging Suppliers, Marketing Agencies, and Other.
- By region: North America, Latin America, Western Europe, Eastern Europe, East Asia, South Asia and Pacific, and Middle East and Africa.
Why does software account for a notable component share?
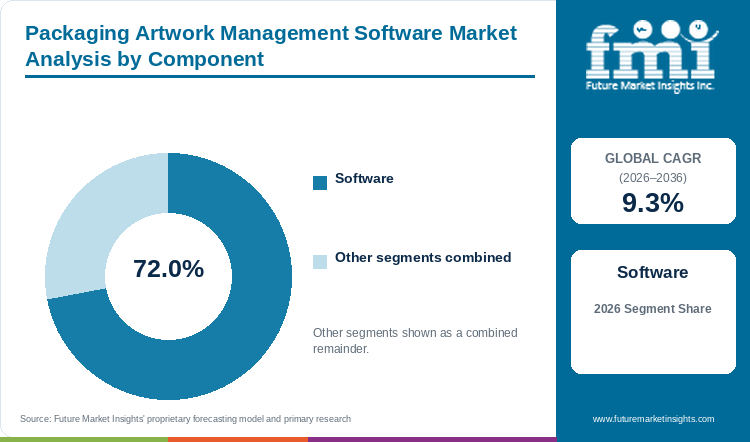
Based on component, software is projected to account for 72.0% in 2026, supported by repeat workflow and audit needs.
Table 3: Component Share for the Packaging Artwork Management Software Market (percentage share), 2026
| Component | Share (2026) |
|---|---|
| Software | 72.0% |
| Other Segments Combined | 28.0%* |
| Total | 100.0% |
*Calculated as the balance remaining after deducting the leading segment's reported share from 100.0%.
Table 4: Component Leadership and Market Growth for the Packaging Artwork Management Software Market (segment and CAGR percentage), 2026 to 2036
| Metric | Value |
|---|---|
| Global CAGR (2026 to 2036) | 9.3% |
| Leading Segment | Software |
In the report, software is the main component used for keeping packaging copy, graphics, comments, approval status and released files in one record. Manufacturers are increasingly preferring software as one packaging workflow can be used for several products and the earlier version remains available for review. In July 2026, Esko published WebCenter 26.07 documentation with packaging-content and artwork-comparison functions.[6] Addition of packaging content beside artwork comparison allows reviewers to check approved text and visual changes in the same screen, which in turn reduces repeated movement between systems. Owing to recurring packaging changes and audit requirement, software is projected to account for 72.0% of component revenue in 2026. Increasing use of proofing, comparison and controlled approval functions is anticipated to support the software segment growth.
- Based on component, software is projected to account for 72.0% in 2026, supported by repeat workflow and audit needs.
- Preference for the leading subsegment is supported by repeat review, wider application and retained version history.
What supports cloud-based tools as the preferred deployment mode?
By deployment mode, cloud-based platforms are estimated to hold 64.0% in 2026, owing to distributed review and simpler access.
According to the report, cloud-based packaging artwork management software allows brand teams, agencies, printers and regulatory reviewers to open the current packaging project without local installation. This deployment is increasingly used by manufacturers having outside suppliers and regional review teams, as every reviewer requires the same artwork version. In February 2026, Eurostat reported that 53% of EU enterprises used paid cloud computing services in 2025, reflecting broader adoption of shared digital systems across business operations.[7] Reduction in manual work shows the operating benefit of moving comments, changes and approval status into one shared platform. Due to distributed packaging review and easier supplier access, cloud-based platforms are estimated to hold 64.0% of deployment revenue in 2026. These factors are expected to drive cloud-based packaging artwork management software demand.
- By deployment mode, cloud-based platforms are estimated to hold 64.0% in 2026, owing to distributed review and simpler access.
- Preference for the leading subsegment is supported by repeat review, wider application and retained version history.
How is food and beverage gaining use within applications?
In 2026, food and beverage is expected to lead application with 25.0% share, driven by repeated label and SKU changes.
Food and beverage packaging carries ingredients, allergens, nutrition data, product claims, barcodes and language content. A change in one approved information can affect several pack sizes and product variants, due to which food manufacturers requires comparison of old and revised artwork before printing. In January 2025, the U.S. FDA issued updated food allergen guidance, noting that undeclared allergens from packaging and labeling discrepancies remain the primary cause of food recalls in the United States.[8] This regulatory focus indicates why packages require rigorous content and layout validation whenever recipe or supplier information is modified. Owing to repeated nutrition changes, wider SKU range and high use of printed claims, food and beverage is expected to hold 25.0% application share in 2026. Increasing regulated content on food packs is anticipated to support the segment revenue growth.
- In 2026, food and beverage is expected to lead application with 25.0% share, driven by repeated label and SKU changes.
- Preference for the leading subsegment is supported by repeat review, wider application and retained version history.
Why are large enterprises selecting controlled artwork platforms?
Large enterprises are set to lead enterprise size with 61.0% share in 2026, underpinned by portfolio and market complexity.
Report data suggests large enterprises manage brand, legal, regulatory, quality, agencies and printers across a wider product portfolio. These companies requires a common artwork workflow as one approved content can be used in several products, countries and pack sizes. In 2025, GS1 US documented that major enterprise consumer brands are transitioning packaging lines to 2D barcodes under Sunrise 2027, requiring brand owners to coordinate dual on-pack codes and structured digital product records across active portfolios.[9] Such high artwork volume requires common templates, defined reviewers and retained version history, which is difficult to manage through separate files and email. Owing to wider product portfolios and multi-country packaging activity, large enterprises are projected to hold 61.0% share in 2026. Increasing connection of artwork platforms with SAP and regulatory information systems is expected to keep large enterprises prominent in the market.
- Large enterprises are set to lead enterprise size with 61.0% share in 2026, underpinned by portfolio and market complexity.
- Preference for the leading subsegment is supported by repeat review, wider application and retained version history.
Which conditions keep manufacturers central among end users?
Manufacturers are projected to hold 52.0% of end user demand in 2026, reinforced by direct ownership of released packaging specifications.
Manufacturers are the main end users that release packaging specifications and carry the cost when an older artwork file reaches the printer. Due to this, the approved status is required to remain attached with the print-ready artwork until the file enters production. In November 2025, Esko published WebCenter 25.11 release notes with automated quality and packaging-content review functions.[10] Automated review helps manufacturers check regulated copy and artwork differences before approved files move into prepress, print, ERP or PLM systems. Owing to direct ownership of released packaging and printing cost, manufacturers are projected to hold 52.0% share in 2026. Increasing use of automated checks before print is expected to support manufacturers share in the packaging artwork management software market.
- Manufacturers are projected to hold 52.0% share in 2026, supported by direct ownership of released packaging specifications.
- Preference for the leading subsegment is supported by repeat review, wider application and retained version history.
What are the drivers, restraints, and opportunities in the packaging artwork management software market?
In the packaging artwork management software market, the key driver is regulatory change, the key restraint is integration complexity, and the key opportunity is structured content reuse.
- Driver: Repeated packaging and labeling changes expand demand for controlled review, proofing and release workflows.
- Restraint: Connections with ERP, PLM, DAM, print and identity systems can extend implementation and validation work.
- Opportunity: Structured content and automated checks can reduce repeated review across related products and markets.
Regulatory Change Creates Review Volume
Packaging warnings, recycling instructions and nutrition panels are changed when national labeling and packaging regulations are revised. One approved change can require new artwork for several products, pack sizes and languages. UK guidance updated in August 2026 requires large producers to report packaging data every six months and retain required data for seven years.[11] Manufacturers therefore requires packaging statements and disposal instructions to remain connected with the records used for reporting. Packaging artwork management software keeps the approved artwork version, reviewer comments and release date in one project. Increasing regulatory reporting and repeated packaging changes is expected to drive the packaging artwork management software market growth.
Integration Extends Implementation Work
Packaging artwork platforms depends on product data, user roles, workflow stages and links with ERP, PLM, DAM and print systems. In 2025, Karomi ManageArtworks highlighted that integrating packaging artwork automation across enterprise ERP, PLM, PIM, and quality systems requires complex data mapping and cross-departmental validation.[12] Moving multiple business units into one unified platform requires organizations to define product records, approvers, access rights and approved source information. Apart from software cost, integration and validation work can extend the implementation period for manufacturers having different systems across business units. High integration requirement and unclear ownership of packaging data may hamper the packaging artwork management software market growth.
Structured Content Supports Reuse
Structured content keeps approved text, symbols and regulatory information separate from one fixed artwork file. The same approved information can therefore be placed in different packaging sizes, language versions and digital product records without entering the text again. In July 2026, the European Commission made the Digital Product Passport Registry operational with QR-linked product information and unique registration identifiers.[13] Connection of physical products with digital information is increasing the need to maintain the same approved content on the pack and in the linked record. Artwork software providers can add reusable content, QR review and digital record connection in order to cater this requirement. Expansion of digital product information is expected to create new avenues in the packaging artwork management software market.
Which country CAGRs are profiled in the packaging artwork management software market?
Table 5: Country CAGR Comparison for the Packaging Artwork Management Software Market (CAGR percentage), 2026 to 2036
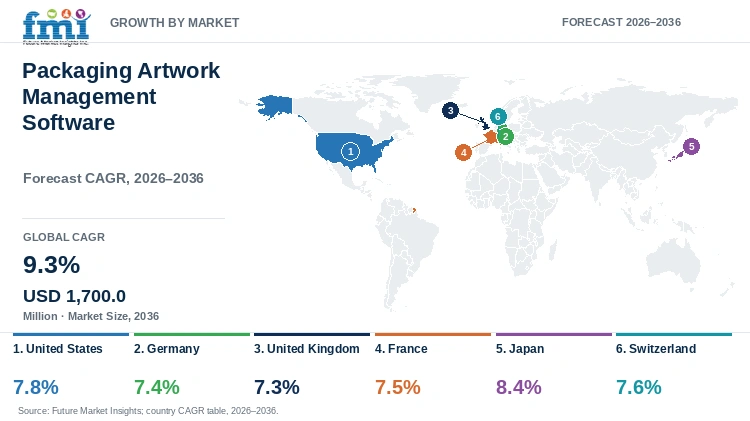
| Country | CAGR |
|---|---|
| United States | 7.8% |
| Germany | 7.4% |
| United Kingdom | 7.3% |
| France | 7.5% |
| Japan | 8.4% |
| Switzerland | 7.6% |
How do country-level CAGRs compare in the packaging artwork management software market?
As noted in the report, country demand remains positive through 2036, whereas artwork work differs between nutrition labeling, producer reporting, packaging conformity, localization and printing controls. Japan and the United States retain stronger expansion outlooks, while Western European markets show steady demand from regulated packaging changes.
- United States demand follows proposed nutrition-label changes and large packaged-food portfolios.
- Germany links packaging conformity with producer-registration records.
- United Kingdom demand follows six-month producer reporting and recyclability assessment requirements.
- France connects artwork revisions with PPWR conformity and material restrictions.
- Japan requires Japanese-language labels and continues reviewing digital labeling tools.
- Switzerland combines EU trade alignment with national food-contact printing controls.
Full report country CAGRs cover North America, Latin America, Western Europe, Eastern Europe, East Asia, South Asia and Pacific, and Middle East and Africa.
Country-wise Analysis
- As per the analysis from FMI, the United States packaging artwork management software sector is projected to record 7.8% CAGR through 2036. In May 2026, California's CalRecycle published permanent regulations under the Plastic Pollution Prevention and Packaging Producer Responsibility Act (SB 54), establishing mandatory packaging producer compliance across retail brands.[14] Brand owners will need to identify affected products and revise approved packaging specifications to meet state reporting deadlines. Comparison tools can review the required panels between versions, while controlled approval records retains the decision path before files reach printers. Increasing number of affected SKUs is expected to support demand for packaging artwork management software in the United States.
- Germany is estimated to post 7.4% CAGR over the forecast period, influenced by packaging registration and EU conformity requirements. Zentrale Stelle Verpackungsregister states that PPWR and Germany implementing law took effect on August 12, 2026, while registration, system participation and data reporting remains under the revised producer structure.[15] The public producer register is updated daily and displays registered companies, brands and packaging information. Artwork teams are required to keep recycling statements and regulated pack elements aligned with the responsible company. This requirement for audit trail and regional content ownership is anticipated to support German market growth.
- Packaging artwork management software demand in the United Kingdom is forecast to rise at 7.3% CAGR through 2036. In June 2025, the UK Department for Environment, Food and Rural Affairs (Defra) and PackUK published the 2025 Extended Producer Responsibility base fees across packaging materials, establishing disposal costs that drive brand owners to track packaging composition within artwork records.[16] Packaging claims and disposal instructions are required to remain consistent with these supporting records. A controlled platform routes revisions through compliance, packaging, brand and external suppliers, especially when one material change affects several packs. Expansion of producer reporting is likely to propel the United Kingdom market growth.
- France packaging artwork management software outlook is anticipated to advance at 7.5% CAGR through 2036. French customs confirmed that Regulation (EU) 2025/40 applied from August 12, 2026 and packaging must be recyclable, while combined lead, cadmium, mercury and chromium VI is capped at 100 mg/kg.[17] Transitional periods for later labeling provisions separates immediate conformity work from future artwork revisions. Packaging teams requires a record of why the file changed and which products use the same material declaration. These conditions are expected to support controlled artwork review in France.
- Adoption of packaging artwork management software in Japan is estimated to expand at 8.4% CAGR through 2036. Japan Consumer Affairs Agency states that food labeling must be in Japanese and its 2026 consumer material lists eight mandatory allergen items with another 20 items recommended for disclosure.[18] Local artwork therefore combines ingredients, allergens, nutrition information, origin and product identity with the approved source data. Software allows companies to assign Japanese review responsibility and compare revised files before release. Rising localization volume and formal content ownership is expected to drive the Japan market growth.
- Between 2026 and 2036, the Switzerland market is expected to progress at 7.6% CAGR. Swiss authorities reported in July 2025 that the country seeks harmonization with EU packaging rules and retains a 75% minimum recycling target for glass, PET and aluminium beverage packaging, while BPA has been banned in food-contact printing inks since 2025.[19] These rules create changes in artwork and packaging specification. Demand for systems that separate Swiss content while retaining shared brand elements is likely to support the market growth.
Who are the notable companies in the packaging artwork management software market?
Esko, SGK, Loftware, Kallik, Perigord, Karomi ManageArtworks, Ennov, and Lascom are notable companies profiled in this market.
FMI research indicates packaging artwork management software market is moderately fragmented with presence of software vendors, packaging production companies and regulated-content providers. Esko, Loftware, Kallik and Karomi offers platforms for packaging content, proofing, comparison and approval. SGK and Perigord combines artwork technology with localization and packaging production services. Ennov and Lascom connects packaging records with quality documents and product lifecycle systems. Due to different requirement across food, pharmaceutical packaging and consumer products, one provider does not cover every customer in the same manner. Some of the key players are adding cloud releases, reusable content and system connections in order to cater the growing demand from manufacturers.
- Artwork and labeling platforms: Esko, Loftware, Kallik and Karomi ManageArtworks.
- Packaging production services: SGK and Perigord.
- Regulated content and PLM systems: Ennov and Lascom.
Competitive Benchmarking: Packaging Artwork Management Software Market
Table 6: Competitive Benchmarking for the Packaging Artwork Management Software Market (qualitative capability ratings), 2026
| Company | Workflow depth | Compliance fit | Current activity | Reach |
|---|---|---|---|---|
| Esko | High | High | High | High |
| SGK | High | High | Medium | High |
| Loftware | High | High | High | High |
| Kallik | High | High | High | High |
| Perigord | High | High | Medium | High |
| Karomi ManageArtworks | High | High | Medium | Medium |
| Ennov | Medium | High | Medium | High |
| Lascom | High | Medium | Medium | High |
High indicates broad documented capability, Medium indicates narrower documented breadth, and Low indicates limited public evidence. Ratings do not represent product quality or market share.
Key Developments in the Packaging Artwork Management Software Market
- In September 2025, Esko launched WebCenter Go with workflow templates, proofing, version comparison and automated compliance checks.
- In July 2025, Loftware reported that Lakeview Farms reduced launch times by 50% and manual processes by more than 90%.
- In 2025, Loftware reported that Orion completed 8,000 artwork projects during its first year using the platform.
- In January 2025, the FDA proposed front-of-package nutrition labeling with annual relabeling costs estimated from USD 66 million to USD 154 million.
Key Players in the Packaging Artwork Management Software Market
Artwork and Labeling Software Providers
- Esko
- Loftware
- Kallik
- Karomi ManageArtworks
Packaging Artwork Service Providers
- SGK
- Perigord
Content, Quality, and Product Lifecycle Providers
- Ennov
- Lascom
Packaging Artwork Management Software Market - Report Scope
Table 7: Report Scope for the Packaging Artwork Management Software Market (coverage fields and definitions), 2026 to 2036
| Coverage field | Report scope |
|---|---|
| Market breakdown | Component, deployment mode, application, enterprise size, end user, and region. |
| Quantitative units | USD million. |
| Market definition | Supplier revenue from software and related services used to create, review, approve, control, compare, and release packaging artwork. General design software without artwork workflow is excluded. |
| Regions covered | North America; Latin America; Western Europe; Eastern Europe; East Asia; South Asia and Pacific; Middle East and Africa. |
| Countries covered | United States, Germany, United Kingdom, France, Japan, Switzerland, and additional countries in the full report. |
| Key companies profiled | Esko, SGK, Loftware, Kallik, Perigord, Karomi ManageArtworks, Ennov, and Lascom. |
| Forecast period | 2026 to 2036. |
| Approach | The report covers supplier activity, platform functions, deployment, applications, company roles, and country adoption within the stated boundary. |
Packaging Artwork Management Software Market - Research Methodology
Table 8: Research Methodology for the Packaging Artwork Management Software Market (research methods and approach), 2026 edition
| Method | Approach |
|---|---|
| Primary Research | Analysts gathered input from manufacturers, service providers, technology developers, distributors, end users, procurement teams and subject-matter experts. Interviews covers purchasing decision, product evaluation, pricing, adoption barriers and approval requirement. |
| Desk Research | Desk research covered government statistics, regulatory publications, industry associations, technical literature, standards, company filings, product information and official company announcements. |
| Market Sizing and Forecasting | The market model combined the 2025 baseline with segment structure, pricing indicators, adoption levels, company participation and country demand. Forecast assumptions considered regulation, technology use, purchasing cycles and implementation barriers. |
| Data Validation | Estimates were checked against public data, company activity, industry developments and primary-research findings. Adjacent categories, overlapping revenue and activities outside the defined market were excluded. |
Packaging Artwork Management Software Market by Segments
Component
- Software
- Services
Deployment Mode
- Cloud-based
- On-premises
Application
- Food and Beverage
- Pharmaceuticals
- Consumer Goods
- Retail
- Cosmetics and Personal Care
- Other
Enterprise Size
- Large Enterprises
- Small and Medium Enterprises
End User
- Manufacturers
- Packaging Suppliers
- Marketing Agencies
- Other
Packaging Artwork Management Software Market by Region
- North America
- United States
- Canada
- Latin America
- Brazil
- Mexico
- Argentina
- Chile
- Western Europe
- Germany
- France
- United Kingdom
- Italy
- Spain
- Benelux
- Nordics
- Eastern Europe
- Poland
- Czech Republic
- Romania
- Hungary
- East Asia
- Japan
- South Korea
- South Asia and Pacific
- ASEAN
- Australia and New Zealand
- Middle East and Africa
- GCC Countries
- South Africa
- Türkiye
- Israel
Research Sources and Bibliography
- [1] Esko. (2025, September 23). Esko launches new WebCenter Go to help emerging brands streamline packaging artwork and ensure compliance. https://www.esko.com/en/company/news/esko-launches-new-webcenter-go-to-help-emerging-brands-streamline-packaging-artwork-and-ensure-compliance
- [2] Loftware. (2025, July 8). How Lakeview Farms moved from chaos to calm by automating artwork management.
- [3] U.S. Food and Drug Administration. (2025). Food labeling: Front-of-package nutrition information, preliminary regulatory impact analysis. https://www.fda.gov/media/185202/download
- [4] Loftware. (2025). Orion Corporation completes 8,000 artwork projects in first year with Loftware.
- [5] Loftware. (2026). Mariani Packing Company modernizes artwork management and accelerates collaboration with Loftware.
- [6] Esko. (2026, July 27). WebCenter 26.07 release documentation.
- [7] Eurostat. (2026, February 3). 53% of EU enterprises used paid cloud computing services in 2025. https://ec.europa.eu/eurostat/web/products-eurostat-news/w/ddn-20260203-1
- [8] U.S. Food and Drug Administration. (2025, January 6). Food allergen labeling: Questions and answers regarding food allergens and the Food Allergen Labeling and Consumer Protection Act.
- [9] GS1 US. (2025). Sunrise 2027: Transitioning to 2D barcodes on packaging.
- [10] Esko. (2025, November 4). WebCenter 25.11 release notes.
- [11] Department for Environment, Food and Rural Affairs and PackUK. (2026, August 25). Extended producer responsibility for packaging. https://www.gov.uk/government/collections/extended-producer-responsibility-for-packaging
- [12] Karomi ManageArtworks. (2025). Integrating packaging artwork automation with enterprise ERP, PLM, and QMS platforms.
- [13] European Commission. (2026, July 20). Digital Product Passport Registry is now live.
- [14] California Department of Resources Recycling and Recovery (CalRecycle). (2026, May 1). SB 54 Plastic Pollution Prevention and Packaging Producer Responsibility Act implementation regulations.
- [15] Zentrale Stelle Verpackungsregister. (2026, August 12). PPWR and German Packaging Law Implementation Act: What changed.
- [16] Department for Environment, Food and Rural Affairs and PackUK. (2025, June 30). Extended producer responsibility for packaging: 2025 base fees.
- [17] Direction générale des douanes et droits indirects. (2026, August 10). Entrée en vigueur du nouveau règlement relatif aux emballages.
- [18] Consumer Affairs Agency, Japan. (2026). For informed food choices: Food labeling and allergen disclosure requirements.
- [19] Federal Office for the Environment, Switzerland. (2025, July 30). Packaging; Federal Food Safety and Veterinary Office. (2025). Packaging and food contact materials.
Only the four most authoritative bibliography entries display direct URLs. All other entries retain the verified APA 7 source details without showing a raw URL.
This Report Answers
- What is Packaging Artwork Management Software Market worth during 2026?
- What value is Packaging Artwork Management Software Market projected by 2036?
- Which component holds a notable Packaging Artwork Management Software Market share?
- Which deployment mode holds a notable market share during 2026?
- Which country has a notable Packaging Artwork Management Software Market outlook?
- Which companies are notable in Packaging Artwork Management Software Market today?
Frequently Asked Questions
How large is the Packaging Artwork Management Software Market in 2026?
Future Market Insights estimates that the packaging artwork management software market is valued at USD 700.0 million in 2026 and is projected to reach USD 1,700.0 million by 2036.
What CAGR is projected for the market over the forecast period?
The packaging artwork management software market is projected to grow at 9.3% CAGR from 2026 to 2036.
Which component leads the market in 2026?
Software is projected to hold 72.0% of component revenue in 2026, supported by recurring workflow, proofing and audit requirement.
Which deployment mode holds a leading share in 2026?
Cloud-based deployment is estimated to account for 64.0% of deployment revenue in 2026 owing to distributed review and controlled supplier access.
Which country has a notable growth outlook during the assessment period?
As per FMI analysis, Japan is predicted to register 8.4% CAGR from 2026 to 2036, supported by Japanese-language labeling and formal control of localized product information.
Who are the key players in the market?
Key participants include Esko, SGK, Loftware, Kallik, Perigord, Karomi ManageArtworks, Ennov and Lascom.
Preview the report firsthand - request a free sample
Get SampleGet the brochure for pricing and purchase details.
Get PDFTable of Content
- Key Takeaways
- Market Size and CAGR
- Top Growth Driver
- Fastest Growing Segment
- Leading Region
- Key Companies
- Emerging Opportunities
- Executive Summary
- Global Market Outlook
- Demand-side Trends
- Supply-side Trends
- Technology Roadmap Analysis
- Analysis and Recommendations
- Analyst Perspective (What is happening? Why now? What should investors know?)
- Key Questions Answered
- How large is the market?
- What is the CAGR?
- What are key trends?
- Which region dominates?
- Who are the leaders?
- Market Overview
- Market Coverage / Taxonomy
- Market Definition / Scope / Limitations
- Research Methodology
- Chapter Orientation
- Analytical Lens and Working Hypotheses
- Market Structure, Signals, and Trend Drivers
- Benchmarking and Cross-market Comparability
- Market Sizing, Forecasting, and Opportunity Mapping
- Research Design and Evidence Framework
- Desk Research Programme (Secondary Evidence)
- Expert Input and Fieldwork (Primary Evidence)
- Tooling, Models, and Reference Databases
- Data Engineering and Model Build
- Quality Assurance and Audit Trail
- Market Background
- Market Dynamics (Drivers, Restraints, Opportunity, Trends)
- Scenario Forecast (Optimistic, Likely, Conservative)
- Impact Analysis
- AI Impact
- Sustainability Impact
- Regulatory Impact
- Technology Impact
- Consumer / Buyer Analysis
- Purchase Drivers
- Adoption Barriers
- Buyer Journey
- Opportunity Map Analysis
- Product Life Cycle Analysis
- Supply Chain Analysis
- Investment Feasibility Matrix
- Value Chain Analysis
- PESTLE and Porter's Analysis
- Regulatory Landscape
- Regional Parent Market Outlook
- Production and Consumption Statistics
- Import and Export Statistics
- Global Market Analysis and Forecast, 2021 to 2036
- Historical Market Size Value (USD Million) Analysis, 2021 to 2025
- Current and Future Market Size Value (USD Million) Projections, 2026 to 2036
- Y-o-Y Growth Trend Analysis
- Absolute $ Opportunity Analysis
- Global Market Pricing Analysis, 2021 to 2036
- Global Market Analysis and Forecast, By Component, 2021 to 2036
- Introduction / Key Findings
- Historical Market Size Value (USD Million) Analysis By Component, 2021 to 2025
- Current and Future Market Size Value (USD Million) Analysis and Forecast By Component, 2026 to 2036
- Software
- Services
- Y-o-Y Growth Trend Analysis By Component, 2021 to 2025
- Absolute $ Opportunity Analysis By Component, 2026 to 2036
- Global Market Analysis and Forecast, By Deployment Mode, 2021 to 2036
- Introduction / Key Findings
- Historical Market Size Value (USD Million) Analysis By Deployment Mode, 2021 to 2025
- Current and Future Market Size Value (USD Million) Analysis and Forecast By Deployment Mode, 2026 to 2036
- Cloud-based
- On-premises
- Y-o-Y Growth Trend Analysis By Deployment Mode, 2021 to 2025
- Absolute $ Opportunity Analysis By Deployment Mode, 2026 to 2036
- Global Market Analysis and Forecast, By Application, 2021 to 2036
- Introduction / Key Findings
- Historical Market Size Value (USD Million) Analysis By Application, 2021 to 2025
- Current and Future Market Size Value (USD Million) Analysis and Forecast By Application, 2026 to 2036
- Food and Beverage
- Pharmaceuticals
- Consumer Goods
- Retail
- Cosmetics and Personal Care
- Other
- Y-o-Y Growth Trend Analysis By Application, 2021 to 2025
- Absolute $ Opportunity Analysis By Application, 2026 to 2036
- Global Market Analysis and Forecast, By Enterprise Size, 2021 to 2036
- Introduction / Key Findings
- Historical Market Size Value (USD Million) Analysis By Enterprise Size, 2021 to 2025
- Current and Future Market Size Value (USD Million) Analysis and Forecast By Enterprise Size, 2026 to 2036
- Large Enterprises
- Small and Medium Enterprises
- Y-o-Y Growth Trend Analysis By Enterprise Size, 2021 to 2025
- Absolute $ Opportunity Analysis By Enterprise Size, 2026 to 2036
- Global Market Analysis and Forecast, By End User, 2021 to 2036
- Introduction / Key Findings
- Historical Market Size Value (USD Million) Analysis By End User, 2021 to 2025
- Current and Future Market Size Value (USD Million) Analysis and Forecast By End User, 2026 to 2036
- Manufacturers
- Packaging Suppliers
- Marketing Agencies
- Other
- Y-o-Y Growth Trend Analysis By End User, 2021 to 2025
- Absolute $ Opportunity Analysis By End User, 2026 to 2036
- Global Market Analysis and Forecast, By Region, 2021 to 2036
- Introduction
- Historical Market Size Value (USD Million) Analysis By Region, 2021 to 2025
- Current Market Size Value (USD Million) Analysis and Forecast By Region, 2026 to 2036
- North America
- Latin America
- Western Europe
- Eastern Europe
- East Asia
- South Asia and Pacific
- Middle East and Africa
- Market Attractiveness Analysis By Region
- North America Market Analysis and Forecast, By Country, 2021 to 2036
- Historical Market Size Value (USD Million) Trend Analysis By Market Taxonomy, 2021 to 2025
- Market Size Value (USD Million) Forecast By Market Taxonomy, 2026 to 2036
- By Country
- United States
- Canada
- By Component
- By Deployment Mode
- By Application
- By Enterprise Size
- By End User
- By Country
- Market Attractiveness Analysis
- By Country
- By Component
- By Deployment Mode
- By Application
- By Enterprise Size
- By End User
- Key Takeaways
- Latin America Market Analysis and Forecast, By Country
- Historical Market Size Value (USD Million) Trend Analysis By Market Taxonomy, 2021 to 2025
- Market Size Value (USD Million) Forecast By Market Taxonomy, 2026 to 2036
- By Country
- Brazil
- Mexico
- Argentina
- Chile
- By Component
- By Deployment Mode
- By Application
- By Enterprise Size
- By End User
- By Country
- Market Attractiveness Analysis
- By Country
- By Component
- By Deployment Mode
- By Application
- By Enterprise Size
- By End User
- Key Takeaways
- Western Europe Market Analysis and Forecast, By Country
- Historical Market Size Value (USD Million) Trend Analysis By Market Taxonomy, 2021 to 2025
- Market Size Value (USD Million) Forecast By Market Taxonomy, 2026 to 2036
- By Country
- Germany
- France
- United Kingdom
- Italy
- Spain
- Benelux
- Nordics
- By Component
- By Deployment Mode
- By Application
- By Enterprise Size
- By End User
- By Country
- Market Attractiveness Analysis
- By Country
- By Component
- By Deployment Mode
- By Application
- By Enterprise Size
- By End User
- Key Takeaways
- Eastern Europe Market Analysis and Forecast, By Country
- Historical Market Size Value (USD Million) Trend Analysis By Market Taxonomy, 2021 to 2025
- Market Size Value (USD Million) Forecast By Market Taxonomy, 2026 to 2036
- By Country
- Poland
- Czech Republic
- Romania
- Hungary
- By Component
- By Deployment Mode
- By Application
- By Enterprise Size
- By End User
- By Country
- Market Attractiveness Analysis
- By Country
- By Component
- By Deployment Mode
- By Application
- By Enterprise Size
- By End User
- Key Takeaways
- East Asia Market Analysis and Forecast, By Country
- Historical Market Size Value (USD Million) Trend Analysis By Market Taxonomy, 2021 to 2025
- Market Size Value (USD Million) Forecast By Market Taxonomy, 2026 to 2036
- By Country
- Japan
- South Korea
- By Component
- By Deployment Mode
- By Application
- By Enterprise Size
- By End User
- By Country
- Market Attractiveness Analysis
- By Country
- By Component
- By Deployment Mode
- By Application
- By Enterprise Size
- By End User
- Key Takeaways
- South Asia and Pacific Market Analysis and Forecast, By Country
- Historical Market Size Value (USD Million) Trend Analysis By Market Taxonomy, 2021 to 2025
- Market Size Value (USD Million) Forecast By Market Taxonomy, 2026 to 2036
- By Country
- ASEAN
- Australia and New Zealand
- By Component
- By Deployment Mode
- By Application
- By Enterprise Size
- By End User
- By Country
- Market Attractiveness Analysis
- By Country
- By Component
- By Deployment Mode
- By Application
- By Enterprise Size
- By End User
- Key Takeaways
- Middle East and Africa Market Analysis and Forecast, By Country
- Historical Market Size Value (USD Million) Trend Analysis By Market Taxonomy, 2021 to 2025
- Market Size Value (USD Million) Forecast By Market Taxonomy, 2026 to 2036
- By Country
- GCC Countries
- South Africa
- Türkiye
- Israel
- By Component
- By Deployment Mode
- By Application
- By Enterprise Size
- By End User
- By Country
- Market Attractiveness Analysis
- By Country
- By Component
- By Deployment Mode
- By Application
- By Enterprise Size
- By End User
- Key Takeaways
- Key Countries Market Analysis
- United States
- Pricing Analysis
- Market Share Analysis, 2025
- By Component
- By Deployment Mode
- By Application
- By Enterprise Size
- By End User
- Canada
- Pricing Analysis
- Market Share Analysis, 2025
- By Component
- By Deployment Mode
- By Application
- By Enterprise Size
- By End User
- Mexico
- Pricing Analysis
- Market Share Analysis, 2025
- By Component
- By Deployment Mode
- By Application
- By Enterprise Size
- By End User
- Brazil
- Pricing Analysis
- Market Share Analysis, 2025
- By Component
- By Deployment Mode
- By Application
- By Enterprise Size
- By End User
- Chile
- Pricing Analysis
- Market Share Analysis, 2025
- By Component
- By Deployment Mode
- By Application
- By Enterprise Size
- By End User
- Germany
- Pricing Analysis
- Market Share Analysis, 2025
- By Component
- By Deployment Mode
- By Application
- By Enterprise Size
- By End User
- United Kingdom
- Pricing Analysis
- Market Share Analysis, 2025
- By Component
- By Deployment Mode
- By Application
- By Enterprise Size
- By End User
- Italy
- Pricing Analysis
- Market Share Analysis, 2025
- By Component
- By Deployment Mode
- By Application
- By Enterprise Size
- By End User
- Spain
- Pricing Analysis
- Market Share Analysis, 2025
- By Component
- By Deployment Mode
- By Application
- By Enterprise Size
- By End User
- France
- Pricing Analysis
- Market Share Analysis, 2025
- By Component
- By Deployment Mode
- By Application
- By Enterprise Size
- By End User
- ASEAN
- Pricing Analysis
- Market Share Analysis, 2025
- By Component
- By Deployment Mode
- By Application
- By Enterprise Size
- By End User
- Australia and New Zealand
- Pricing Analysis
- Market Share Analysis, 2025
- By Component
- By Deployment Mode
- By Application
- By Enterprise Size
- By End User
- Japan
- Pricing Analysis
- Market Share Analysis, 2025
- By Component
- By Deployment Mode
- By Application
- By Enterprise Size
- By End User
- South Korea
- Pricing Analysis
- Market Share Analysis, 2025
- By Component
- By Deployment Mode
- By Application
- By Enterprise Size
- By End User
- Poland
- Pricing Analysis
- Market Share Analysis, 2025
- By Component
- By Deployment Mode
- By Application
- By Enterprise Size
- By End User
- Hungary
- Pricing Analysis
- Market Share Analysis, 2025
- By Component
- By Deployment Mode
- By Application
- By Enterprise Size
- By End User
- Türkiye
- Pricing Analysis
- Market Share Analysis, 2025
- By Component
- By Deployment Mode
- By Application
- By Enterprise Size
- By End User
- South Africa
- Pricing Analysis
- Market Share Analysis, 2025
- By Component
- By Deployment Mode
- By Application
- By Enterprise Size
- By End User
- Switzerland
- Pricing Analysis
- Market Share Analysis, 2025
- By Component
- By Deployment Mode
- By Application
- By Enterprise Size
- By End User
- United States
- Market Structure Analysis
- Competition Dashboard
- Competition Benchmarking
- Market Share Analysis of Top Players
- By Regional
- By Component
- By Deployment Mode
- By Application
- By Enterprise Size
- By End User
- Emerging Startups
- Innovation Benchmarking
- Competition Analysis
- Competition Deep Dive
- Esko
- Overview
- Product Portfolio
- Profitability by Market Segments
- Sales Footprint
- Strategy Overview
- Marketing Strategy
- Product Strategy
- Channel Strategy
- SGK
- Loftware
- Kallik
- Perigord
- Karomi ManageArtworks
- Ennov
- Lascom
- Esko
- Case Studies
- Success Stories
- Recent Developments
- Competition Deep Dive
- Assumptions & Acronyms Used


