This site uses cookies, including third-party cookies, that help us to provide and improve our services.

Privacy Policy
- Global Locations -
Headquarters
Future Market Insights, Inc.
Christiana Corporate, 200 Continental Drive, Suite 401, Newark, Delaware - 19713, United States
T: +1-845-579-5705
MEA
Market Access DMCC

1602-6 Jumeirah Bay X2 Tower, Plot No: JLT-PH2-X2A,

Jumeirah Lakes Towers, Dubai,

United Arab Emirates

Americas
Future Market Insights
616 Corporate Way, Suite 2-9018,
Valley Cottage, NY 10989,
United States
T: +1-347-918-3531
Europe
Future Market Insights
3rd Floor, 207 Regent Street,
London W1B 3HH
United Kingdom
T: + 44 (0) 20 8123 9659
D: +44 (0) 20 3287 4268
APAC
Future Market Insights
Office No. 401-A, 4th Floor,
VANTAGE 9, S.No. 36/1/1,
Baner, Pune 411045 India

Palliative Care Market

Palliative Care increasing amid rising prevalence of Key Chronic Disorders

Palliative Care Market By Service Type, End-Use & Region | Forecast 2022 to 2032

Palliative Care Market Snapshot (2022 to 2032)

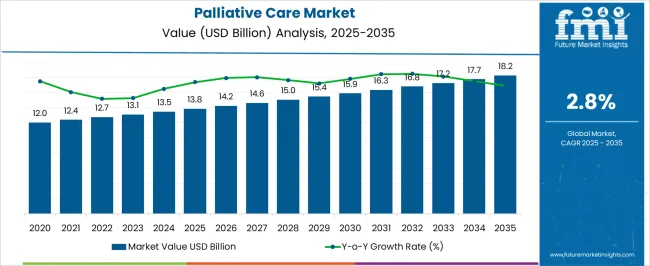
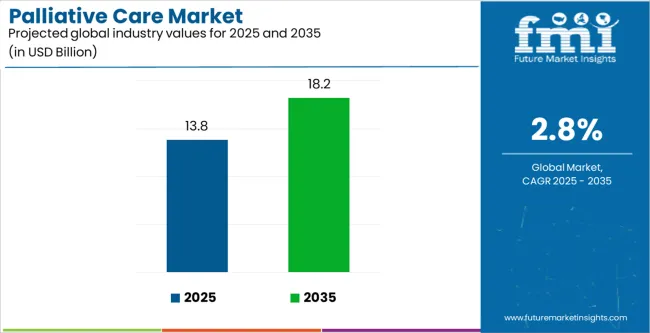
The global palliative care market size is expected to be valued at US$ 13,087.9 Million in 2022. Palliative care is provided to patients suffering from diseases such as cancer, congestive heart failure (CHF), CNS disorders, chronic pulmonary obstructive disease (COPD), and others, providing symptomatic relief for nausea & vomiting, diarrhoea, pain & anxiety, loss of appetite and many more. The overall demand for Palliative Care is projected to grow at a CAGR of 7.3% between 2022 and 2032, totaling around US$ 28,518.5 Million by 2032.

Data Points

Key Statistics

Palliative Care Market Value 2022

US$ 13,087.9 Million

Palliative Care Market Projected Value (2032)

US$ 28,518.5 Million

Palliative Care Market CAGR (2022 to 2032)

7.3%

Customize this Report

Let us know your requirement to get
100% FREE customization

Palliative Care Demand Analysis (2016 to 2021) Vs Market Outlook (2022 to 2032)

From 2016 to 2021, sales witnessed significant growth, registering a CAGR of 8.7%. The global market for palliative care flourished and is expected to flourish over the forecast period due to increasing awareness about the physical, social, and psychological needs of patients with life-threatening diseases and their families.

International Association for Hospice and Palliative Care (IAHPC) have listed 32 essential medicines for hospice and palliative care, including analgesics, antiemetic, etc. Palliative care concentrates on furnishing patients with the alleviation of the side effects, stress, and worry of a genuine sickness irrespective of the diagnosis.

The objective is to enhance personal satisfaction for both the patient and the family. Palliative care is given by a group of doctors, specialists, medical caretakers, and different masters, who cooperate with a patient's different specialists to give an additional layer of help. It is fitting at any age and at any phase in a genuine ailment and can be furnished alongside remedial treatment.

The World Health Organization (WHO) defines palliative care as an approach to improve the quality of life of patients and their families who are facing difficulties related to a fatal illness by providing treatment for relieving the symptoms of an underlying disease/disorder. Whereas, Hospice care is a specific type of palliative care procedure to help terminally ill patients to make their final months/days of life soothing and less painful. The overall demand for palliative care is projected to grow at a CAGR of 7.3% between 2022 and 2032, totaling around US$ 28,518.5 Million by 2032.

Which Drivers Underpin Palliative Care Industry Expansion?

Increasing incidence of life-threatening diseases Likely to Augment Palliative Care Sales

The increasing incidence of life-threatening diseases such as cancer, cardiovascular and infectious diseases is anticipated to be the major growth driver for the global palliative care market. Other factors responsible for the rise in the global palliative care market can be the growing number of palliative care centers worldwide, extending application for homecare, increasing the number of qualified physicians for hospice & palliative care, expanding aging demographics, etc.

In the current scenario, the palliative centers and medical care or long-term care centers are majorly focused on overall palliative care procedures that enhance healthcare quality in three critical ways: successfully soothes physical symptoms, fortifies patient-family-doctor correspondence and basic leadership and guarantees very much planned care crosswise over healthcare services & medical care or home care settings.

Sabyasachi Ghosh
Sabyasachi Ghosh
Principal Consultant
LinkedIn
Talk to Analyst

Find your sweet spots for generating winning opportunities in this market.

Talk to Analyst

Which Factors are Limiting the Growth of the Palliative Care Market?

High Cost of Treatment to Impede the Growth

The high cost of the treatment can be a major restraint for the global palliative care market. Less expansion of medical care facilities for old age group people in the Asia Pacific and Middle East region, reimbursement scenarios,s and less private or public funding to hospital facilities and other medical care centers act as a global restraint to the overall palliative care market.

Region-wise Insights

Will North America Continue Dominance in the Global Palliative Care Market?

Rising Market Competition to Boost the Market Growth in North America

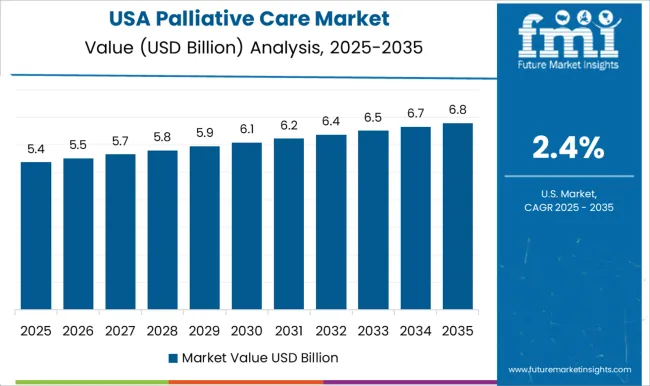
The North America palliative care market is expected to accumulate a market share of 41.2% in 2022. North America is dominating and contributing the leading shares to the Palliative Care market in terms of revenue and is expected to register significant growth over a forecast period due to the increasing market competition.

Furthermore, the growth is because of good reimbursement and insurance coverage for palliative care services. Countries like Mexico in the Latin American region have more palliative care centers for children.

How Big is the Palliative Care Market in Europe?

Rising Research and Development to Boost Market Growth in Europe

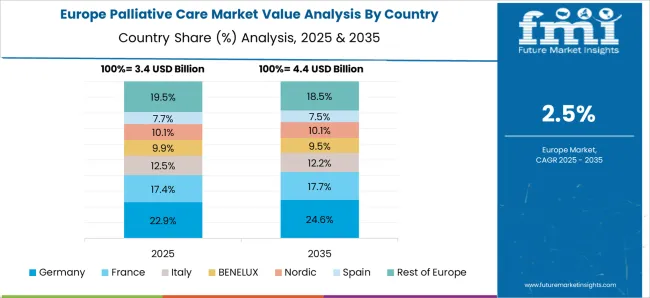
The European region is anticipated to hold a market share of 34.6%. Extensive research and studies have taken place in the European market. The adoption of multiple models with palliative multidisciplinary teams will spur new revenue streams in Europe palliative care market in near future.

MarketNage
Become a MarketNgage Insider

A unified Market Research Subscription Platform, built for today's disparate research needs.

Start-ups For Palliative Care Market

Some key start-ups in the Palliative Care market include-

  • Homage is a Singaporean start-up that provides home palliative care solutions. The start-up connects experienced healthcare professionals with patients dealing with life-threatening conditions. These professionals support patients to live with dignity in the comfort of their homes. Homage’s palliative services include nursing care, complex nursing procedures, night care, and respite care. The start-up also provides care for cancer, arthritis, Parkinson’s, stroke, and hypertension-afflicted patients.
  • Uphold Health is a USA-based start-up that offers dedicated care and telehealth solutions for end-of-life planning. The start-up helps patients understand future care options, find the right resources or services, and provide advanced care planning. Moreover, Uphold provides support for paperwork, including do not resuscitate (DNR) forms, physician orders for life-sustaining treatment (POLST) forms, and advanced directives.
  • Virtue Health is a USA-based start-up that develops digital therapeutics for age-related disorders. The start-up combines virtual reality and wearable headsets to offer an immersive therapeutic platform. The digital pain management platform offers a range of guided programs for different health-related issues and personalizes the experience for each patient. The interactive experience helps palliative patients by reducing pain, stress, and anxiety.

Who are the Leading Players in the Palliative Care Market?

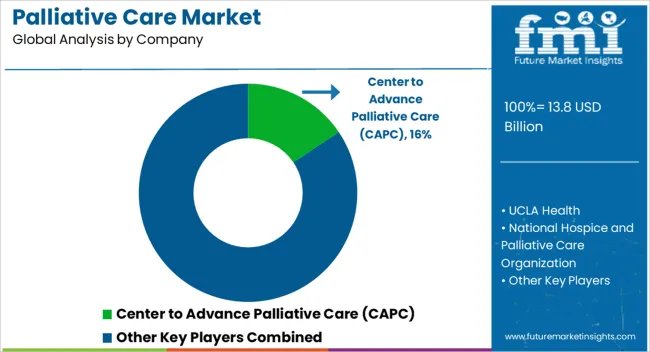
Prominent players in the Palliative Care market are Center to Advance Palliative Care (CAPC), UCLA Health, National Hospice and Palliative Care Organization, VITAS Healthcare, CHI Franciscan, University of Washington (UW Medical Center & UW Medicine), Seymour Health, KEHPCA (Kenya Hospices and Palliative Care Association) and various other regional players.

  • SymPhysis Medical is already working with two of the top five cancer care centers in the USA. This work includes a clinical study that commenced in November 2021, along with human factors usability studies which will provide insights into how patients will interact with the device. The team will quickly follow the rollout in the USA by seeking the CE Mark in the EU

Report Scope

Report Attribute

Details

Growth Rate

CAGR of 7.3% from 2022 to 2032

Market Value in 2022

US$ 13,087.9 Million

Market Value in 2032

US$ 28,518.5 Million

Base Year for Estimation

2021

Historical Data

2016 to 2021

Forecast Period

2022 to 2032

Quantitative Units

Revenue in US$ Million and CAGR from 2022 to 2032

Report Coverage

Revenue Forecast, Company Ranking, Competitive Landscape, Growth Factors, Trends, and Pricing Analysis

Segments Covered

  • End User Type
  • Service Type
  • Region

Regions Covered

  • North America
  • Latin America
  • Europe
  • East Asia
  • South Asia
  • Oceania
  • Middle East and Africa (MEA)

Key Countries Profiled

  • USA
  • Canada
  • Brazil
  • Mexico
  • Germany
  • United Kingdom
  • France
  • Spain
  • Italy
  • China
  • Japan
  • South Korea
  • India
  • Malaysia
  • Singapore
  • Thailand
  • Australia
  • New Zealand
  • GCC Countries
  • South Africa
  • Israel

Key Companies Profiled

  • Center to Advance Palliative Care (CAPC)
  • UCLA Health
  • National Hospice and Palliative Care Organization
  • Vitas Healthcare Corporation
  • CHI Franciscan
  • University of Washington (UW Medical Center & UW Medicine)
  • Seymour Health
  • KEHPCA (Kenya Hospices and Palliative Care Association)
  • Sunrise Senior Living LLC

Customization & Pricing

Available upon Request

Key Segments Covered in the Palliative Care Industry Analysis

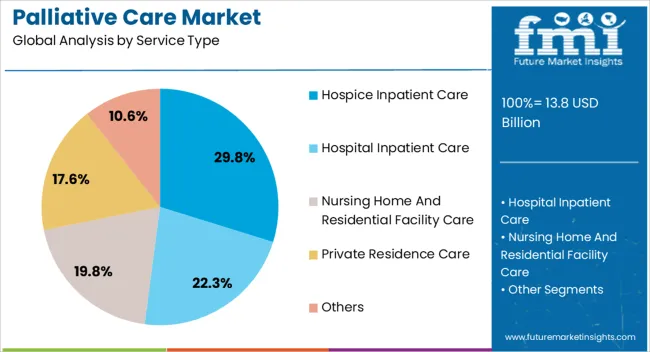
By Service Type:

  • Private Residence Care
  • Hospice Inpatient Care
  • Hospital Inpatient Care
  • Nursing Home and Residential Facility Care
  • Others

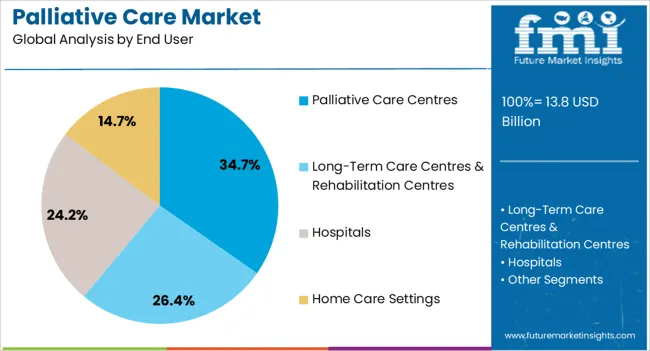
By End User:

  • Hospitals
  • Home Care Settings
  • Palliative Care Centers
  • Long-Term Care Centers & Rehabilitation Centers

By Region:

  • North America
  • Latin America
  • Europe
  • East Asia
  • South Asia
  • Oceania
  • Middle East and Africa(MEA)

Frequently Asked Questions

As of 2022, the Palliative Care market is slated to reach a valuation of US$ 13,087.9 Million

From 2022 to 2032, sales of Palliative Care are expected to grow at a 7.3% CAGR

By 2032, Future Market Insights expects the Palliative Care market to reach US$ 28,518.5 Million.

Table of Content

1. Executive Summary | Palliative Care Market

    1.1. Global Market Outlook

    1.2. Demand-side Trends

    1.3. Supply-side Trends

    1.4. Technology Roadmap Analysis

    1.5. Analysis and Recommendations

2. Market Overview

    2.1. Market Coverage / Taxonomy

    2.2. Market Definition / Scope / Limitations

3. Market Background

    3.1. Market Dynamics

        3.1.1. Drivers

        3.1.2. Restraints

        3.1.3. Opportunity

        3.1.4. Trends

    3.2. Scenario Forecast

        3.2.1. Demand in Optimistic Scenario

        3.2.2. Demand in Likely Scenario

        3.2.3. Demand in Conservative Scenario

    3.3. Opportunity Map Analysis

    3.4. Investment Feasibility Matrix

    3.5. PESTLE and Porter’s Analysis

    3.6. Regulatory Landscape

        3.6.1. By Key Regions

        3.6.2. By Key Countries

    3.7. Regional Parent Market Outlook

4. Global Market Analysis 2016 to 2021 and Forecast, 2022 to 2032

    4.1. Historical Market Size Value (US$ Million) Analysis, 2016 to 2021

    4.2. Current and Future Market Size Value (US$ Million) Projections, 2022 to 2032

        4.2.1. Y-o-Y Growth Trend Analysis

        4.2.2. Absolute $ Opportunity Analysis

5. Global Market Analysis 2016 to 2021 and Forecast 2022 to 2032, By Service Type

    5.1. Introduction / Key Findings

    5.2. Historical Market Size Value (US$ Million) Analysis By Service Type, 2016 to 2021

    5.3. Current and Future Market Size Value (US$ Million) Analysis and Forecast By Service Type, 2022 to 2032

        5.3.1. Private residence care

        5.3.2. Hospice inpatient care

        5.3.3. Hospital inpatient care

        5.3.4. Nursing home and Residential Facility Care

        5.3.5. Others

    5.4. Y-o-Y Growth Trend Analysis By Service Type, 2016 to 2021

    5.5. Absolute $ Opportunity Analysis By Service Type, 2022 to 2032

6. Global Market Analysis 2016 to 2021 and Forecast 2022 to 2032, By End User Type

    6.1. Introduction / Key Findings

    6.2. Historical Market Size Value (US$ Million) Analysis By End User Type, 2016 to 2021

    6.3. Current and Future Market Size Value (US$ Million) Analysis and Forecast By End User Type, 2022 to 2032

        6.3.1. Hospitals

        6.3.2. Home Care Settings

        6.3.3. Centers

        6.3.4. Long Term Care Centers & Rehabilitation Centers

    6.4. Y-o-Y Growth Trend Analysis By End User Type, 2016 to 2021

    6.5. Absolute $ Opportunity Analysis By End User Type, 2022 to 2032

7. Global Market Analysis 2016 to 2021 and Forecast 2022 to 2032, By Region

    7.1. Introduction

    7.2. Historical Market Size Value (US$ Million) Analysis By Region, 2016 to 2021

    7.3. Current Market Size Value (US$ Million) Analysis and Forecast By Region, 2022 to 2032

        7.3.1. North America

        7.3.2. Latin America

        7.3.3. Europe

        7.3.4. South Asia

        7.3.5. East Asia

        7.3.6. Oceania

        7.3.7. Middle East and Africa(MEA)

    7.4. Market Attractiveness Analysis By Region

8. North America Market Analysis 2016 to 2021 and Forecast 2022 to 2032, By Country

    8.1. Historical Market Size Value (US$ Million) Trend Analysis By Market Taxonomy, 2016 to 2021

    8.2. Market Size Value (US$ Million) Forecast By Market Taxonomy, 2022 to 2032

        8.2.1. By Country

            8.2.1.1. USA

            8.2.1.2. Canada

        8.2.2. By Service Type

        8.2.3. By End User Type

    8.3. Market Attractiveness Analysis

        8.3.1. By Country

        8.3.2. By Service Type

        8.3.3. By End User Type

    8.4. Key Takeaways

9. Latin America Market Analysis 2016 to 2021 and Forecast 2022 to 2032, By Country

    9.1. Historical Market Size Value (US$ Million) Trend Analysis By Market Taxonomy, 2016 to 2021

    9.2. Market Size Value (US$ Million) Forecast By Market Taxonomy, 2022 to 2032

        9.2.1. By Country

            9.2.1.1. Brazil

            9.2.1.2. Mexico

            9.2.1.3. Rest of Latin America

        9.2.2. By Service Type

        9.2.3. By End User Type

    9.3. Market Attractiveness Analysis

        9.3.1. By Country

        9.3.2. By Service Type

        9.3.3. By End User Type

    9.4. Key Takeaways

10. Europe Market Analysis 2016 to 2021 and Forecast 2022 to 2032, By Country

    10.1. Historical Market Size Value (US$ Million) Trend Analysis By Market Taxonomy, 2016 to 2021

    10.2. Market Size Value (US$ Million) Forecast By Market Taxonomy, 2022 to 2032

        10.2.1. By Country

            10.2.1.1. Germany

            10.2.1.2. United Kingdom

            10.2.1.3. France

            10.2.1.4. Spain

            10.2.1.5. Italy

            10.2.1.6. Rest of Europe

        10.2.2. By Service Type

        10.2.3. By End User Type

    10.3. Market Attractiveness Analysis

        10.3.1. By Country

        10.3.2. By Service Type

        10.3.3. By End User Type

    10.4. Key Takeaways

11. South Asia Market Analysis 2016 to 2021 and Forecast 2022 to 2032, By Country

    11.1. Historical Market Size Value (US$ Million) Trend Analysis By Market Taxonomy, 2016 to 2021

    11.2. Market Size Value (US$ Million) Forecast By Market Taxonomy, 2022 to 2032

        11.2.1. By Country

            11.2.1.1. India

            11.2.1.2. Malaysia

            11.2.1.3. Singapore

            11.2.1.4. Thailand

            11.2.1.5. Rest of South Asia

        11.2.2. By Service Type

        11.2.3. By End User Type

    11.3. Market Attractiveness Analysis

        11.3.1. By Country

        11.3.2. By Service Type

        11.3.3. By End User Type

    11.4. Key Takeaways

12. East Asia Market Analysis 2016 to 2021 and Forecast 2022 to 2032, By Country

    12.1. Historical Market Size Value (US$ Million) Trend Analysis By Market Taxonomy, 2016 to 2021

    12.2. Market Size Value (US$ Million) Forecast By Market Taxonomy, 2022 to 2032

        12.2.1. By Country

            12.2.1.1. China

            12.2.1.2. Japan

            12.2.1.3. South Korea

        12.2.2. By Service Type

        12.2.3. By End User Type

    12.3. Market Attractiveness Analysis

        12.3.1. By Country

        12.3.2. By Service Type

        12.3.3. By End User Type

    12.4. Key Takeaways

13. Oceania Market Analysis 2016 to 2021 and Forecast 2022 to 2032, By Country

    13.1. Historical Market Size Value (US$ Million) Trend Analysis By Market Taxonomy, 2016 to 2021

    13.2. Market Size Value (US$ Million) Forecast By Market Taxonomy, 2022 to 2032

        13.2.1. By Country

            13.2.1.1. Australia

            13.2.1.2. New Zealand

        13.2.2. By Service Type

        13.2.3. By End User Type

    13.3. Market Attractiveness Analysis

        13.3.1. By Country

        13.3.2. By Service Type

        13.3.3. By End User Type

    13.4. Key Takeaways

14. MEA Market Analysis 2016 to 2021 and Forecast 2022 to 2032, By Country

    14.1. Historical Market Size Value (US$ Million) Trend Analysis By Market Taxonomy, 2016 to 2021

    14.2. Market Size Value (US$ Million) Forecast By Market Taxonomy, 2022 to 2032

        14.2.1. By Country

            14.2.1.1. GCC Countries

            14.2.1.2. South Africa

            14.2.1.3. Israel

            14.2.1.4. Rest of Middle East and Africa(MEA)

        14.2.2. By Service Type

        14.2.3. By End User Type

    14.3. Market Attractiveness Analysis

        14.3.1. By Country

        14.3.2. By Service Type

        14.3.3. By End User Type

    14.4. Key Takeaways

15. Key Countries Market Analysis

    15.1. USA

        15.1.1. Pricing Analysis

        15.1.2. Market Share Analysis, 2021

            15.1.2.1. By Service Type

            15.1.2.2. By End User Type

    15.2. Canada

        15.2.1. Pricing Analysis

        15.2.2. Market Share Analysis, 2021

            15.2.2.1. By Service Type

            15.2.2.2. By End User Type

    15.3. Brazil

        15.3.1. Pricing Analysis

        15.3.2. Market Share Analysis, 2021

            15.3.2.1. By Service Type

            15.3.2.2. By End User Type

    15.4. Mexico

        15.4.1. Pricing Analysis

        15.4.2. Market Share Analysis, 2021

            15.4.2.1. By Service Type

            15.4.2.2. By End User Type

    15.5. Germany

        15.5.1. Pricing Analysis

        15.5.2. Market Share Analysis, 2021

            15.5.2.1. By Service Type

            15.5.2.2. By End User Type

    15.6. United Kingdom

        15.6.1. Pricing Analysis

        15.6.2. Market Share Analysis, 2021

            15.6.2.1. By Service Type

            15.6.2.2. By End User Type

    15.7. France

        15.7.1. Pricing Analysis

        15.7.2. Market Share Analysis, 2021

            15.7.2.1. By Service Type

            15.7.2.2. By End User Type

    15.8. Spain

        15.8.1. Pricing Analysis

        15.8.2. Market Share Analysis, 2021

            15.8.2.1. By Service Type

            15.8.2.2. By End User Type

    15.9. Italy

        15.9.1. Pricing Analysis

        15.9.2. Market Share Analysis, 2021

            15.9.2.1. By Service Type

            15.9.2.2. By End User Type

    15.10. India

        15.10.1. Pricing Analysis

        15.10.2. Market Share Analysis, 2021

            15.10.2.1. By Service Type

            15.10.2.2. By End User Type

    15.11. Malaysia

        15.11.1. Pricing Analysis

        15.11.2. Market Share Analysis, 2021

            15.11.2.1. By Service Type

            15.11.2.2. By End User Type

    15.12. Singapore

        15.12.1. Pricing Analysis

        15.12.2. Market Share Analysis, 2021

            15.12.2.1. By Service Type

            15.12.2.2. By End User Type

    15.13. Thailand

        15.13.1. Pricing Analysis

        15.13.2. Market Share Analysis, 2021

            15.13.2.1. By Service Type

            15.13.2.2. By End User Type

    15.14. China

        15.14.1. Pricing Analysis

        15.14.2. Market Share Analysis, 2021

            15.14.2.1. By Service Type

            15.14.2.2. By End User Type

    15.15. Japan

        15.15.1. Pricing Analysis

        15.15.2. Market Share Analysis, 2021

            15.15.2.1. By Service Type

            15.15.2.2. By End User Type

    15.16. South Korea

        15.16.1. Pricing Analysis

        15.16.2. Market Share Analysis, 2021

            15.16.2.1. By Service Type

            15.16.2.2. By End User Type

    15.17. Australia

        15.17.1. Pricing Analysis

        15.17.2. Market Share Analysis, 2021

            15.17.2.1. By Service Type

            15.17.2.2. By End User Type

    15.18. New Zealand

        15.18.1. Pricing Analysis

        15.18.2. Market Share Analysis, 2021

            15.18.2.1. By Service Type

            15.18.2.2. By End User Type

    15.19. GCC Countries

        15.19.1. Pricing Analysis

        15.19.2. Market Share Analysis, 2021

            15.19.2.1. By Service Type

            15.19.2.2. By End User Type

    15.20. South Africa

        15.20.1. Pricing Analysis

        15.20.2. Market Share Analysis, 2021

            15.20.2.1. By Service Type

            15.20.2.2. By End User Type

    15.21. Israel

        15.21.1. Pricing Analysis

        15.21.2. Market Share Analysis, 2021

            15.21.2.1. By Service Type

            15.21.2.2. By End User Type

16. Market Structure Analysis

    16.1. Competition Dashboard

    16.2. Competition Benchmarking

    16.3. Market Share Analysis of Top Players

        16.3.1. By Regional

        16.3.2. By Service Type

        16.3.3. By End User Type

17. Competition Analysis

    17.1. Competition Deep Dive

        17.1.1. Center to Advance (CAPC)

            17.1.1.1. Overview

            17.1.1.2. Product Portfolio

            17.1.1.3. Profitability by Market Segments

            17.1.1.4. Sales Footprint

            17.1.1.5. Strategy Overview

                17.1.1.5.1. Marketing Strategy

        17.1.2. UCLA Health

            17.1.2.1. Overview

            17.1.2.2. Product Portfolio

            17.1.2.3. Profitability by Market Segments

            17.1.2.4. Sales Footprint

            17.1.2.5. Strategy Overview

                17.1.2.5.1. Marketing Strategy

        17.1.3. National Hospice and Organization

            17.1.3.1. Overview

            17.1.3.2. Product Portfolio

            17.1.3.3. Profitability by Market Segments

            17.1.3.4. Sales Footprint

            17.1.3.5. Strategy Overview

                17.1.3.5.1. Marketing Strategy

        17.1.4. VITAS Healthcare

            17.1.4.1. Overview

            17.1.4.2. Product Portfolio

            17.1.4.3. Profitability by Market Segments

            17.1.4.4. Sales Footprint

            17.1.4.5. Strategy Overview

                17.1.4.5.1. Marketing Strategy

        17.1.5. CHI Franciscan

            17.1.5.1. Overview

            17.1.5.2. Product Portfolio

            17.1.5.3. Profitability by Market Segments

            17.1.5.4. Sales Footprint

            17.1.5.5. Strategy Overview

                17.1.5.5.1. Marketing Strategy

        17.1.6. University of Washington (UW Medical Center & UW Medicine)

            17.1.6.1. Overview

            17.1.6.2. Product Portfolio

            17.1.6.3. Profitability by Market Segments

            17.1.6.4. Sales Footprint

            17.1.6.5. Strategy Overview

                17.1.6.5.1. Marketing Strategy

        17.1.7. Seymour Health

            17.1.7.1. Overview

            17.1.7.2. Product Portfolio

            17.1.7.3. Profitability by Market Segments

            17.1.7.4. Sales Footprint

            17.1.7.5. Strategy Overview

                17.1.7.5.1. Marketing Strategy

        17.1.8. KEHPCA (Kenya Hospices and Association)

            17.1.8.1. Overview

            17.1.8.2. Product Portfolio

            17.1.8.3. Profitability by Market Segments

            17.1.8.4. Sales Footprint

            17.1.8.5. Strategy Overview

                17.1.8.5.1. Marketing Strategy

        17.1.9. Vitas Healthcare Corporation

            17.1.9.1. Overview

            17.1.9.2. Product Portfolio

            17.1.9.3. Profitability by Market Segments

            17.1.9.4. Sales Footprint

            17.1.9.5. Strategy Overview

                17.1.9.5.1. Marketing Strategy

        17.1.10. Sunrise Senior Living LLC

            17.1.10.1. Overview

            17.1.10.2. Product Portfolio

            17.1.10.3. Profitability by Market Segments

            17.1.10.4. Sales Footprint

            17.1.10.5. Strategy Overview

                17.1.10.5.1. Marketing Strategy

18. Assumptions & Acronyms Used

19. Research Methodology
Customize this Report

Let us know your requirement to get
100% FREE customization

List of Tables

Table 1: Global Market Value (US$ Million) Forecast by Region, 2016 to 2032

Table 2: Global Market Value (US$ Million) Forecast by Service Type, 2016 to 2032

Table 3: Global Market Value (US$ Million) Forecast by End User Type, 2016 to 2032

Table 4: North America Market Value (US$ Million) Forecast by Country, 2016 to 2032

Table 5: North America Market Value (US$ Million) Forecast by Service Type, 2016 to 2032

Table 6: North America Market Value (US$ Million) Forecast by End User Type, 2016 to 2032

Table 7: Latin America Market Value (US$ Million) Forecast by Country, 2016 to 2032

Table 8: Latin America Market Value (US$ Million) Forecast by Service Type, 2016 to 2032

Table 9: Latin America Market Value (US$ Million) Forecast by End User Type, 2016 to 2032

Table 10: Europe Market Value (US$ Million) Forecast by Country, 2016 to 2032

Table 11: Europe Market Value (US$ Million) Forecast by Service Type, 2016 to 2032

Table 12: Europe Market Value (US$ Million) Forecast by End User Type, 2016 to 2032

Table 13: South Asia Market Value (US$ Million) Forecast by Country, 2016 to 2032

Table 14: South Asia Market Value (US$ Million) Forecast by Service Type, 2016 to 2032

Table 15: South Asia Market Value (US$ Million) Forecast by End User Type, 2016 to 2032

Table 16: East Asia Market Value (US$ Million) Forecast by Country, 2016 to 2032

Table 17: East Asia Market Value (US$ Million) Forecast by Service Type, 2016 to 2032

Table 18: East Asia Market Value (US$ Million) Forecast by End User Type, 2016 to 2032

Table 19: Oceania Market Value (US$ Million) Forecast by Country, 2016 to 2032

Table 20: Oceania Market Value (US$ Million) Forecast by Service Type, 2016 to 2032

Table 21: Oceania Market Value (US$ Million) Forecast by End User Type, 2016 to 2032

Table 22: MEA Market Value (US$ Million) Forecast by Country, 2016 to 2032

Table 23: MEA Market Value (US$ Million) Forecast by Service Type, 2016 to 2032

Table 24: MEA Market Value (US$ Million) Forecast by End User Type, 2016 to 2032
Sabyasachi Ghosh
Principal Consultant
LinkedIn
Talk to Analyst

Find your sweet spots for generating winning opportunities in this market.

Talk to Analyst

List of Charts

Figure 1: Global Market Value (US$ Million) by Service Type, 2022 to 2032

Figure 2: Global Market Value (US$ Million) by End User Type, 2022 to 2032

Figure 3: Global Market Value (US$ Million) by Region, 2022 to 2032

Figure 4: Global Market Value (US$ Million) Analysis by Region, 2016 to 2032

Figure 5: Global Market Value Share (%) and BPS Analysis by Region, 2022 to 2032

Figure 6: Global Market Y-o-Y Growth (%) Projections by Region, 2022 to 2032

Figure 7: Global Market Value (US$ Million) Analysis by Service Type, 2016 to 2032

Figure 8: Global Market Value Share (%) and BPS Analysis by Service Type, 2022 to 2032

Figure 9: Global Market Y-o-Y Growth (%) Projections by Service Type, 2022 to 2032

Figure 10: Global Market Value (US$ Million) Analysis by End User Type, 2016 to 2032

Figure 11: Global Market Value Share (%) and BPS Analysis by End User Type, 2022 to 2032

Figure 12: Global Market Y-o-Y Growth (%) Projections by End User Type, 2022 to 2032

Figure 13: Global Market Attractiveness by Service Type, 2022 to 2032

Figure 14: Global Market Attractiveness by End User Type, 2022 to 2032

Figure 15: Global Market Attractiveness by Region, 2022 to 2032

Figure 16: North America Market Value (US$ Million) by Service Type, 2022 to 2032

Figure 17: North America Market Value (US$ Million) by End User Type, 2022 to 2032

Figure 18: North America Market Value (US$ Million) by Country, 2022 to 2032

Figure 19: North America Market Value (US$ Million) Analysis by Country, 2016 to 2032

Figure 20: North America Market Value Share (%) and BPS Analysis by Country, 2022 to 2032

Figure 21: North America Market Y-o-Y Growth (%) Projections by Country, 2022 to 2032

Figure 22: North America Market Value (US$ Million) Analysis by Service Type, 2016 to 2032

Figure 23: North America Market Value Share (%) and BPS Analysis by Service Type, 2022 to 2032

Figure 24: North America Market Y-o-Y Growth (%) Projections by Service Type, 2022 to 2032

Figure 25: North America Market Value (US$ Million) Analysis by End User Type, 2016 to 2032

Figure 26: North America Market Value Share (%) and BPS Analysis by End User Type, 2022 to 2032

Figure 27: North America Market Y-o-Y Growth (%) Projections by End User Type, 2022 to 2032

Figure 28: North America Market Attractiveness by Service Type, 2022 to 2032

Figure 29: North America Market Attractiveness by End User Type, 2022 to 2032

Figure 30: North America Market Attractiveness by Country, 2022 to 2032

Figure 31: Latin America Market Value (US$ Million) by Service Type, 2022 to 2032

Figure 32: Latin America Market Value (US$ Million) by End User Type, 2022 to 2032

Figure 33: Latin America Market Value (US$ Million) by Country, 2022 to 2032

Figure 34: Latin America Market Value (US$ Million) Analysis by Country, 2016 to 2032

Figure 35: Latin America Market Value Share (%) and BPS Analysis by Country, 2022 to 2032

Figure 36: Latin America Market Y-o-Y Growth (%) Projections by Country, 2022 to 2032

Figure 37: Latin America Market Value (US$ Million) Analysis by Service Type, 2016 to 2032

Figure 38: Latin America Market Value Share (%) and BPS Analysis by Service Type, 2022 to 2032

Figure 39: Latin America Market Y-o-Y Growth (%) Projections by Service Type, 2022 to 2032

Figure 40: Latin America Market Value (US$ Million) Analysis by End User Type, 2016 to 2032

Figure 41: Latin America Market Value Share (%) and BPS Analysis by End User Type, 2022 to 2032

Figure 42: Latin America Market Y-o-Y Growth (%) Projections by End User Type, 2022 to 2032

Figure 43: Latin America Market Attractiveness by Service Type, 2022 to 2032

Figure 44: Latin America Market Attractiveness by End User Type, 2022 to 2032

Figure 45: Latin America Market Attractiveness by Country, 2022 to 2032

Figure 46: Europe Market Value (US$ Million) by Service Type, 2022 to 2032

Figure 47: Europe Market Value (US$ Million) by End User Type, 2022 to 2032

Figure 48: Europe Market Value (US$ Million) by Country, 2022 to 2032

Figure 49: Europe Market Value (US$ Million) Analysis by Country, 2016 to 2032

Figure 50: Europe Market Value Share (%) and BPS Analysis by Country, 2022 to 2032

Figure 51: Europe Market Y-o-Y Growth (%) Projections by Country, 2022 to 2032

Figure 52: Europe Market Value (US$ Million) Analysis by Service Type, 2016 to 2032

Figure 53: Europe Market Value Share (%) and BPS Analysis by Service Type, 2022 to 2032

Figure 54: Europe Market Y-o-Y Growth (%) Projections by Service Type, 2022 to 2032

Figure 55: Europe Market Value (US$ Million) Analysis by End User Type, 2016 to 2032

Figure 56: Europe Market Value Share (%) and BPS Analysis by End User Type, 2022 to 2032

Figure 57: Europe Market Y-o-Y Growth (%) Projections by End User Type, 2022 to 2032

Figure 58: Europe Market Attractiveness by Service Type, 2022 to 2032

Figure 59: Europe Market Attractiveness by End User Type, 2022 to 2032

Figure 60: Europe Market Attractiveness by Country, 2022 to 2032

Figure 61: South Asia Market Value (US$ Million) by Service Type, 2022 to 2032

Figure 62: South Asia Market Value (US$ Million) by End User Type, 2022 to 2032

Figure 63: South Asia Market Value (US$ Million) by Country, 2022 to 2032

Figure 64: South Asia Market Value (US$ Million) Analysis by Country, 2016 to 2032

Figure 65: South Asia Market Value Share (%) and BPS Analysis by Country, 2022 to 2032

Figure 66: South Asia Market Y-o-Y Growth (%) Projections by Country, 2022 to 2032

Figure 67: South Asia Market Value (US$ Million) Analysis by Service Type, 2016 to 2032

Figure 68: South Asia Market Value Share (%) and BPS Analysis by Service Type, 2022 to 2032

Figure 69: South Asia Market Y-o-Y Growth (%) Projections by Service Type, 2022 to 2032

Figure 70: South Asia Market Value (US$ Million) Analysis by End User Type, 2016 to 2032

Figure 71: South Asia Market Value Share (%) and BPS Analysis by End User Type, 2022 to 2032

Figure 72: South Asia Market Y-o-Y Growth (%) Projections by End User Type, 2022 to 2032

Figure 73: South Asia Market Attractiveness by Service Type, 2022 to 2032

Figure 74: South Asia Market Attractiveness by End User Type, 2022 to 2032

Figure 75: South Asia Market Attractiveness by Country, 2022 to 2032

Figure 76: East Asia Market Value (US$ Million) by Service Type, 2022 to 2032

Figure 77: East Asia Market Value (US$ Million) by End User Type, 2022 to 2032

Figure 78: East Asia Market Value (US$ Million) by Country, 2022 to 2032

Figure 79: East Asia Market Value (US$ Million) Analysis by Country, 2016 to 2032

Figure 80: East Asia Market Value Share (%) and BPS Analysis by Country, 2022 to 2032

Figure 81: East Asia Market Y-o-Y Growth (%) Projections by Country, 2022 to 2032

Figure 82: East Asia Market Value (US$ Million) Analysis by Service Type, 2016 to 2032

Figure 83: East Asia Market Value Share (%) and BPS Analysis by Service Type, 2022 to 2032

Figure 84: East Asia Market Y-o-Y Growth (%) Projections by Service Type, 2022 to 2032

Figure 85: East Asia Market Value (US$ Million) Analysis by End User Type, 2016 to 2032

Figure 86: East Asia Market Value Share (%) and BPS Analysis by End User Type, 2022 to 2032

Figure 87: East Asia Market Y-o-Y Growth (%) Projections by End User Type, 2022 to 2032

Figure 88: East Asia Market Attractiveness by Service Type, 2022 to 2032

Figure 89: East Asia Market Attractiveness by End User Type, 2022 to 2032

Figure 90: East Asia Market Attractiveness by Country, 2022 to 2032

Figure 91: Oceania Market Value (US$ Million) by Service Type, 2022 to 2032

Figure 92: Oceania Market Value (US$ Million) by End User Type, 2022 to 2032

Figure 93: Oceania Market Value (US$ Million) by Country, 2022 to 2032

Figure 94: Oceania Market Value (US$ Million) Analysis by Country, 2016 to 2032

Figure 95: Oceania Market Value Share (%) and BPS Analysis by Country, 2022 to 2032

Figure 96: Oceania Market Y-o-Y Growth (%) Projections by Country, 2022 to 2032

Figure 97: Oceania Market Value (US$ Million) Analysis by Service Type, 2016 to 2032

Figure 98: Oceania Market Value Share (%) and BPS Analysis by Service Type, 2022 to 2032

Figure 99: Oceania Market Y-o-Y Growth (%) Projections by Service Type, 2022 to 2032

Figure 100: Oceania Market Value (US$ Million) Analysis by End User Type, 2016 to 2032

Figure 101: Oceania Market Value Share (%) and BPS Analysis by End User Type, 2022 to 2032

Figure 102: Oceania Market Y-o-Y Growth (%) Projections by End User Type, 2022 to 2032

Figure 103: Oceania Market Attractiveness by Service Type, 2022 to 2032

Figure 104: Oceania Market Attractiveness by End User Type, 2022 to 2032

Figure 105: Oceania Market Attractiveness by Country, 2022 to 2032

Figure 106: MEA Market Value (US$ Million) by Service Type, 2022 to 2032

Figure 107: MEA Market Value (US$ Million) by End User Type, 2022 to 2032

Figure 108: MEA Market Value (US$ Million) by Country, 2022 to 2032

Figure 109: MEA Market Value (US$ Million) Analysis by Country, 2016 to 2032

Figure 110: MEA Market Value Share (%) and BPS Analysis by Country, 2022 to 2032

Figure 111: MEA Market Y-o-Y Growth (%) Projections by Country, 2022 to 2032

Figure 112: MEA Market Value (US$ Million) Analysis by Service Type, 2016 to 2032

Figure 113: MEA Market Value Share (%) and BPS Analysis by Service Type, 2022 to 2032

Figure 114: MEA Market Y-o-Y Growth (%) Projections by Service Type, 2022 to 2032

Figure 115: MEA Market Value (US$ Million) Analysis by End User Type, 2016 to 2032

Figure 116: MEA Market Value Share (%) and BPS Analysis by End User Type, 2022 to 2032

Figure 117: MEA Market Y-o-Y Growth (%) Projections by End User Type, 2022 to 2032

Figure 118: MEA Market Attractiveness by Service Type, 2022 to 2032

Figure 119: MEA Market Attractiveness by End User Type, 2022 to 2032

Figure 120: MEA Market Attractiveness by Country, 2022 to 2032

Need specific information?

Request Customization

Explore Healthcare Insights

View Reports

Recommendations

Healthcare

Urgent Care Market

Published : March 2019

Healthcare

Critical Care Diagnostics Market

Published : December 2016

Healthcare

Vision Care Market

Published : December 2021

Healthcare

Diabetes Care Devices Market

Published : January 1970

Google translate

Palliative Care Market