

- Market Size (2026)
- USD 5.2 Bn
- Forecast (2036)
- USD 11.5 Bn
- CAGR (2026 to 2036)
- 8.3%
How big is the patient-specific surgical implants market in 2026?
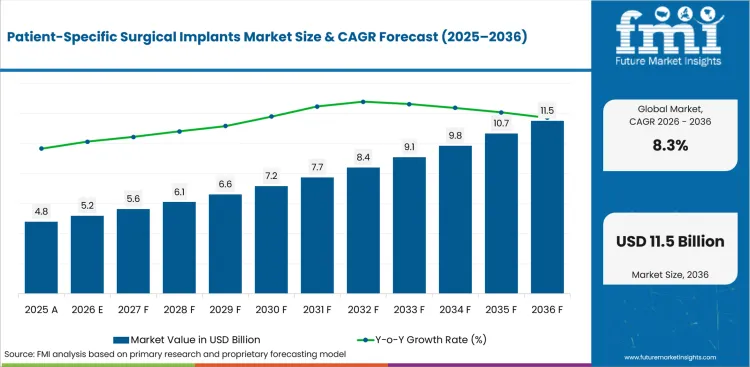
USD 5.2 billion in 2026 and USD 11.5 billion by 2036 at an 8.3% CAGR.
The patient-specific surgical implants market is expected to grow from USD 4.8 billion in 2025 to USD 11.5 billion by 2036 at an 8.3% CAGR due to complex reconstruction demand and hospital movement toward controlled digital case planning. Orthopedic implants are estimated to hold 46.0% share in 2026 and 3D printing is projected to hold 42.0% share as companies prioritize fit accuracy and traceable production.
Regulatory proof and hospital spending both shape the commercial path for patient-matched implants. FDA issued patient-matched orthopedic guide guidance in May 2026, giving suppliers clearer expectations for design inputs and validation information. CMS reported in January 2026 that USA hospital expenditures grew 8.9% to USD 1634.7 billion in 2024. FDA also stated in March 2025 that it receives over 2 million medical device reports each year, reinforcing the need for controlled records after unique implants reach clinical use.
| Metric | Value |
|---|---|
| 2026 Market Size | USD 5.2 billion |
| 2036 Market Size | USD 11.5 billion |
| Forecast CAGR (2026-2036) | 8.3% |
| Leading Implant Type | Orthopedic Implants |
| Orthopedic Implants Share (2026) | 46.0% |
| Leading Technology | 3D Printing |
| 3D Printing Share (2026) | 42.0% |
| Fastest-growing Country | China |
| China CAGR by 2036 | 9.2% |
Summary of the Patient-Specific Surgical Implants Market
| Market Signal | Commercial Impact |
|---|---|
| Demand and Growth Drivers | Demand for patient-specific surgical implants is increasing as personalized reconstruction procedures rely on anatomy-matched implant design, advanced imaging workflows, and validated manufacturing processes.
|
| Product and Segment View | Orthopedic implants, 3D printing technologies, reconstructive surgery applications, and hospital-based procurement lead their respective market segments.
|
| Geography and Growth Outlook | North America maintains market leadership while Asia continues to expand through hospital modernization and growing additive manufacturing capabilities.
|
| Competitive Landscape | Competition increasingly focuses on surgical planning expertise, validated production workflows, regulatory compliance, and close collaboration with healthcare providers.
|
| Analyst Perspective | Patient-specific surgical implants are evolving into integrated clinical workflow solutions where design validation, imaging accuracy, and manufacturing discipline determine supplier selection.
|
Which factors support expansion in the patient-specific surgical implants market?
Controlled patient-matched workflows support market value as hospitals move complex reconstruction cases away from intraoperative improvisation.
- Revenue is expected to improve as patient-matched cranial and maxillofacial cases shift from manual contouring toward pre-planned implant delivery.
- Supplier pricing reflects imaging review and engineer-led design work plus material validation before the implant reaches surgery.
- Hospital trust increases when suppliers maintain surgeon approval records and connect the final implant back to the original DICOM dataset.
- Adjacent 3D printed medical devices demand supports the same case-planning ecosystem used by patient-specific implant providers.
Why is the patient-specific surgical implants market growing?
Demand is rising because complex reconstruction cases need implant geometry that standard plates and cages cannot provide reliably.
Patient-specific implants gain commercial ground when defect geometry and surgeon approval remain connected in one controlled record. FDA cleared the VSP PEEK Cranial Implant under K231834 in April 2024, and the clearance summary identifies an individually designed implant intended to correct cranial bone defects. That evidence matters because hospitals can see a regulated example of imaging-to-implant documentation. The same logic supports 3D printed medical implants suppliers that serve cranial and orthopedic reconstruction.
How is the patient-specific surgical implants market segmented?
The patient-specific surgical implants industry is segmented by implant type, technology, application, end user and region.
- Orthopedic Implants are projected to hold 46.0% share in 2026 due to spine and trauma reconstruction requirements.
- 3D Printing is expected to account for 42.0% share in 2026 owing to titanium lattice and custom PEEK production needs.
- Reconstructive Surgery is estimated to represent 48.0% share in 2026 because cranial and maxillofacial defects require anatomy-matched repair.
- Hospitals are projected to account for 63.0% share in 2026 supported by integrated imaging and surgical planning workflows.
Which implant type category holds a notable share in the patient-specific surgical implants market?
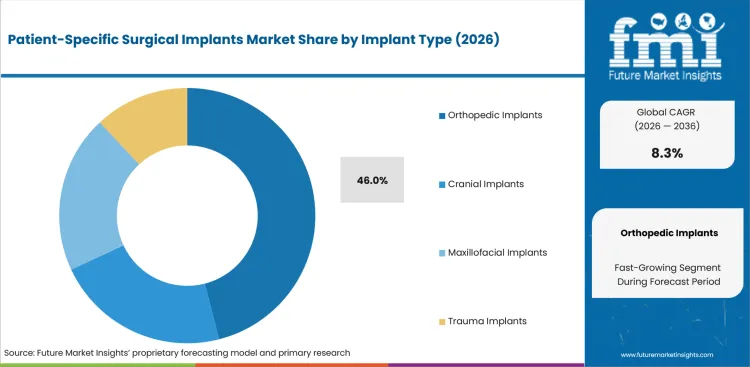
- Orthopedic Implants are projected to account for 46.0% share in 2026 due to revision spine and trauma reconstruction needs.
- Cranial and Maxillofacial Implants gain relevance in cases that require accurate contour restoration after trauma or tumor removal.
How does the technology segment perform in the patient-specific surgical implants market?
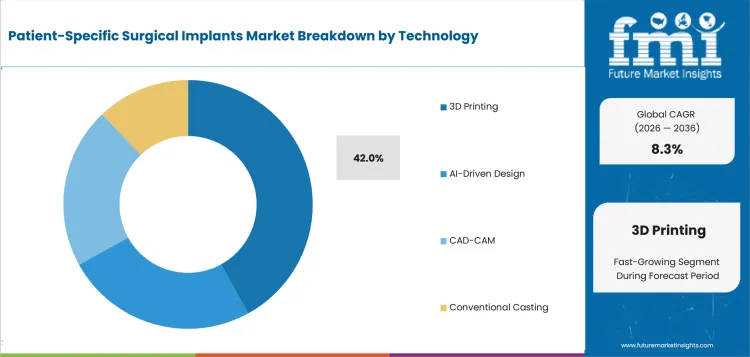
- 3D Printing is estimated to hold 42.0% share in 2026 because additive production supports porous titanium and complex PEEK shapes.
- CAD/CAM remains important for milled PEEK and preoperative planning workflows that support 3D printed surgical models before implant approval.
What drives demand across application options in the patient-specific surgical implants market?
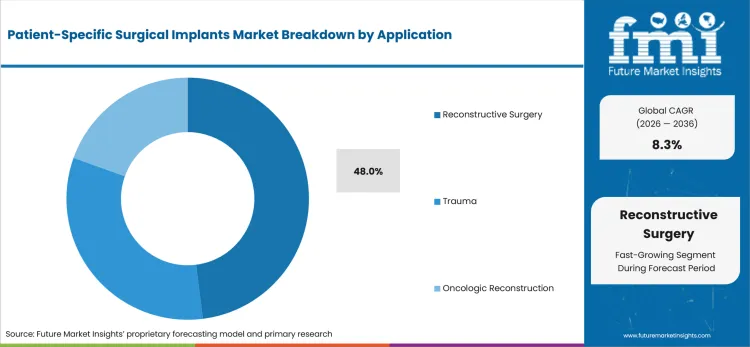
- Reconstructive Surgery is forecast to represent 48.0% share in 2026 owing to cranial closure and facial defect repair.
- Trauma applications benefit from anatomy-matched implants when surgeons need faster fit decisions for complex bone loss.
How are buyers selecting across end user options in the patient-specific surgical implants market?
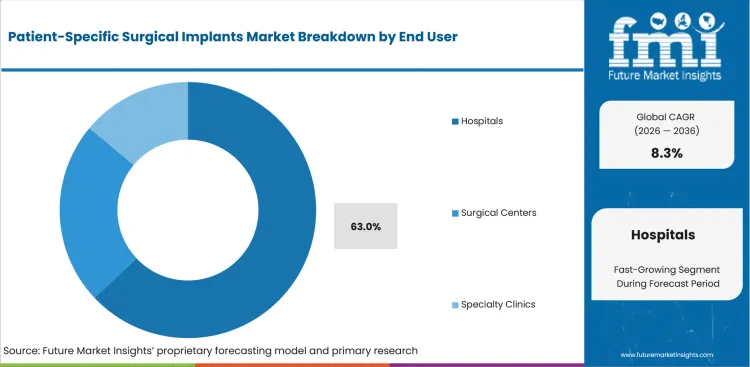
- Hospitals are expected to hold 63.0% share in 2026 due to control over imaging and final procurement approval.
- Surgical centers remain selective because custom implants need extra planning records and reliable delivery before the procedure date.
What are the driver, restraints, and opportunities in the patient-specific surgical implants market?
CT-based design and 3D printing support growth while documentation burden and reimbursement pressure limit faster adoption.
- Driver: Complex defect reconstruction is expected to raise demand for implants designed from CT or MRI data.
- Restraint: Documentation burden is projected to limit smaller suppliers that cannot support complete design and validation records.
- Opportunity: Integrated providers can expand by combining imaging review and engineering support with material choice and sterile delivery.
CT-Based Defect Matching Demand Outlook
Demand is shaped by trauma and neurosurgery cases that require accurate defect restoration before the operating room schedule tightens. CDC reported in April 2026 that the United States recorded 68663 TBI-related deaths in 2023. This indicates a continuing clinical need for cranial reconstruction pathways where patient-matched implants can reduce manual shaping during surgery.
PEEK and Titanium Workflow Choice
Material choice has become a practical supplier-selection issue due to surgeon comparisons of imaging follow-up and load requirements before design approval. Materialise added custom-made PEEK implants to its CMF portfolio in February 2026. This official launch gives European surgeons a single workflow that supports both titanium and PEEK patient-specific reconstructions.
Documentation and Lead-Time Pressure
The main restraint is controlled release of a unique device for one named patient. FDA stated in March 2025 that it receives over 2 million medical device reports each year. That surveillance scale reinforces why hospitals ask patient-specific implant suppliers for traceable design files and material records plus complaint handling and post-market responsibility before approval.
Which countries are growing fastest in the patient-specific surgical implants market?
China 9.2% CAGR, India 9.0% CAGR, South Korea 8.7% CAGR, United States 8.2% CAGR, Japan 8.1% CAGR, Germany 8.0% CAGR, United Kingdom 7.8% CAGR, and France 7.7% CAGR through 2036.
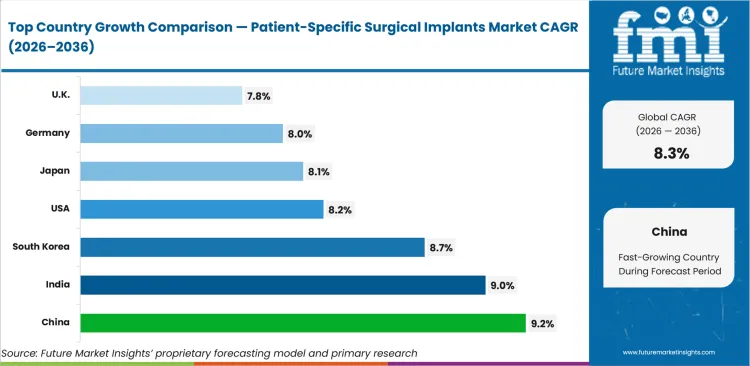
| Country | CAGR |
|---|---|
| China | 9.2% |
| India | 9.0% |
| South Korea | 8.7% |
| United States | 8.2% |
| Japan | 8.1% |
| Germany | 8.0% |
| United Kingdom | 7.8% |
| France | 7.7% |
Source: Future Market Insights, 2026.
How do country-level CAGRs compare in the patient-specific surgical implants market?
China shows the highest stated CAGR while France records the most cautious expansion outlook among profiled markets.
- China is forecast to record 9.2% CAGR by 2036 as local additive manufacturing and specialty hospital capacity broaden.
- India is forecast to record 9.0% CAGR by 2036 owing to private hospital adoption and local design-service participation.
- South Korea is forecast to record 8.7% CAGR by 2036 supported by export-ready medtech suppliers and USA clearance activity.
- United States is forecast to record 8.2% CAGR by 2036 reinforced by FDA-cleared examples and large specialty surgery capacity.
- Japan is forecast to record 8.1% CAGR by 2036 shaped by imaging depth and cautious regulatory review pathways.
- Germany is forecast to record 8.0% CAGR by 2036 supported by EU MDR discipline and domestic precision manufacturing capability.
- United Kingdom is forecast to record 7.8% CAGR by 2036 influenced by MHRA compliance rules and NHS procurement scrutiny.
- France is forecast to record 7.7% CAGR by 2036 guided by ANSM oversight and reimbursement evidence expectations.
How fast is the patient-specific surgical implants market growing in the United States?
An 8.2% CAGR through 2036 reflects FDA-cleared examples and large specialty surgery capacity across hospital networks.
Country Market Snapshot Table
| Parameter | Value |
|---|---|
| Market Size in 2025 (Value) | USD 1,586.0 million |
| Market Size in 2026 (Value) | USD 1,716.0 million |
| Market Forecast in 2036 (Value) | USD 3,773.9 million |
| CAGR (2026 to 2036) | 8.2% |
| Years Considered | 2021 to 2036 |
| Base Year | 2025 |
| Forecast Period | 2026 to 2036 |
| Units Considered | Value (USD million) |
| Leading Sub-Region | Northeast and California specialty surgery corridors |
United States Patient-Specific Surgical Implants Market Outlook
United States demand is shaped by visible FDA clearance pathways for patient-specific cranial and spine implants. Hospitals can review public 510(k) summaries before adding suppliers to value analysis processes.
Buyer choice usually starts with surgeons and imaging teams before moving into reimbursement and sterile logistics review. Suppliers with USA case support and post-market records gain a clearer route to repeat orders.
Key Growth Drivers
- FDA-cleared cranial workflows reduce procurement uncertainty for hospitals reviewing patient-specific implant suppliers. FDA listed K231834 for VSP PEEK Cranial Implant in April 2024, giving buyers a public clearance example.
- Hospital capacity supports repeat complex reconstruction demand across neurosurgery and orthopedic centers. AHA reported 6100 USA hospitals in February 2026, creating a broad addressable base for supplier qualification.
- Cranial trauma need supports demand for anatomy-matched reconstruction workflows. CDC reported 68663 TBI-related deaths in April 2026, reinforcing continued clinical need around cranial injury management.
- Spine and trauma reconstruction opportunities gain relevance as hospitals compare custom cages, spinal implants and devices, and fixation systems during case planning.
Key Restraints
- Reimbursement teams may challenge custom implant premiums when standard devices can meet the clinical requirement.
- FDA submission and post-market records raise supplier workload before hospitals approve broader contracting. FDA stated in March 2025 that it receives over 2 million medical device reports each year.
- Smaller design shops encounter a harder sales process if sterile release and complaint handling controls are not documented.
What makes United States unique
The United States is distinct because public FDA summaries give hospitals a visible review trail for patient-specific devices.
Key Companies
- 3D Systems
- Stryker
- DePuy Synthes
- KLS Martin L.P.
- Meticuly
- CGBio
Sales & Marketing Channels
- Direct hospital sales
- Surgeon case-planning teams
- GPO and value analysis committees
- Regulatory dossier review
- Specialty distributor support
- Clinical education programs
Country Segment Breakdown Table
| Segment | Sub-Segments |
|---|---|
| By Implant Type | Cranial Implants · Orthopedic Implants · Maxillofacial Implants · Trauma Implants |
| By Technology | AI-Driven Design · 3D Printing · CAD/CAM · Conventional Casting |
| By Application | Reconstructive Surgery · Trauma · Oncologic Reconstruction |
| By End User | Hospitals · Surgical Centers · Specialty Clinics |
| Key Sub-Regions Covered, Surgical Corridors | Northeast · California · Texas · Midwest academic centers · Florida specialty hospitals |
Frequently Asked Questions
How fast is United States patient-specific surgical implants market growing?
United States is expected to grow at 8.2% CAGR from 2026 to 2036, guided by local surgical and supplier conditions.
Who leads United States patient-specific surgical implants market?
3D Systems, Stryker, DePuy Synthes, KLS Martin, Meticuly, and CGBio compete through cleared products and case-support workflows.
What is driving adoption in United States patient-specific surgical implants market?
FDA-cleared cranial and titanium mesh examples support supplier qualification across complex hospital reconstruction programs.
What is the patient-specific surgical implants market outlook in the United Kingdom?
A 7.8% CAGR through 2036 reflects NHS specialist surgery demand and tighter compliance expectations under MHRA rules.
Country Market Snapshot Table
| Parameter | Value |
|---|---|
| Market Size in 2025 (Value) | USD 313.5 million |
| Market Size in 2026 (Value) | USD 338.0 million |
| Market Forecast in 2036 (Value) | USD 716.3 million |
| CAGR (2026 to 2036) | 7.8% |
| Years Considered | 2021 to 2036 |
| Base Year | 2025 |
| Forecast Period | 2026 to 2036 |
| Units Considered | Value (USD million) |
| Leading Sub-Region | London and Midlands specialist hospital corridors |
United Kingdom Patient-Specific Surgical Implants Market Outlook
United Kingdom demand is influenced by consultant-led specialist surgery and NHS procurement scrutiny. Custom implant use becomes credible when suppliers can prove clinical value and local compliance.
The channel setting favors companies that support UK responsible person obligations and hospital value review. Overseas suppliers need local representation before custom devices can move smoothly into clinical use.
Key Growth Drivers
- Imaging capacity supports CT-based implant design across specialist NHS pathways. NHS England reported 50.0 million imaging tests in January 2026 for the year to September 2025, supporting digital planning readiness.
- Hospital procedure volume keeps reconstruction demand visible in admitted care settings. NHS England reported Hospital Admitted Patient Care Activity in September 2025 for the 2024 to 2025 period, supporting procedure-level planning visibility.
- MHRA custom-made guidance gives overseas suppliers a clearer compliance route. GOV.UK updated the custom-made device guidance in June 2025, reinforcing local documentation expectations.
- Specialist craniofacial and orthopedic teams can use patient-specific implants when procurement sees fit accuracy and case timing benefits.
Key Restraints
- NHS budget pressure limits routine use when standard plates or cages can satisfy clinical requirements.
- Post-market surveillance obligations increase compliance workload for device suppliers in Great Britain. GOV.UK stated in 2025 that new medical device measures apply from 16 June 2025.
- Trust-level value analysis can slow supplier entry when clinical evidence and local service capacity remain incomplete.
What makes United Kingdom unique
The United Kingdom combines consultant-led specialist surgery with centralized procurement checks across NHS hospitals.
Key Companies
- Materialise
- Stryker UK
- Johnson & Johnson MedTech UK
- KLS Martin UK
- Osteotec
- Renishaw
Sales & Marketing Channels
- NHS trust procurement
- Consultant surgeon referral
- UK responsible person route
- Specialist distributor access
- Hospital value analysis review
- Clinical education workshops
Country Segment Breakdown Table
| Segment | Sub-Segments |
|---|---|
| By Implant Type | Cranial Implants · Orthopedic Implants · Maxillofacial Implants · Trauma Implants |
| By Technology | AI-Driven Design · 3D Printing · CAD/CAM · Conventional Casting |
| By Application | Reconstructive Surgery · Trauma · Oncologic Reconstruction |
| By End User | Hospitals · Surgical Centers · Specialty Clinics |
| Key Sub-Regions Covered, Surgical Corridors | London · Midlands · Manchester · Cambridge · Oxford · Glasgow referral links |
Frequently Asked Questions
How fast is United Kingdom patient-specific surgical implants market growing?
United Kingdom is expected to grow at 7.8% CAGR from 2026 to 2036, guided by local surgical and supplier conditions.
Who leads United Kingdom patient-specific surgical implants market?
Materialise, Stryker UK, Johnson & Johnson MedTech UK, KLS Martin UK, Osteotec, and Renishaw compete through specialist channels.
What is driving adoption in United Kingdom patient-specific surgical implants market?
Specialist imaging capacity and MHRA compliance rules support controlled patient-specific implant adoption in the United Kingdom.
How is Germany performing in the patient-specific surgical implants market?
An 8.0% CAGR through 2036 reflects EU MDR discipline and domestic engineering depth in medical technology corridors.
Country Market Snapshot Table
| Parameter | Value |
|---|---|
| Market Size in 2025 (Value) | USD 481.5 million |
| Market Size in 2026 (Value) | USD 520.0 million |
| Market Forecast in 2036 (Value) | USD 1,122.6 million |
| CAGR (2026 to 2036) | 8.0% |
| Years Considered | 2021 to 2036 |
| Base Year | 2025 |
| Forecast Period | 2026 to 2036 |
| Units Considered | Value (USD million) |
| Leading Sub-Region | Bavaria and Baden-Wuerttemberg medical technology corridors |
Germany Patient-Specific Surgical Implants Market Outlook
Germany demand is shaped by university hospital case complexity and local precision manufacturing depth. The market favors suppliers that combine surgeon planning support with validated production processes.
EU MDR obligations make documentation and post-market responsibility part of the sale. German buyers are expected to prefer firms that control design transfer and production release inside a quality system.
Key Growth Drivers
- Hospital procedure density supports repeat demand for complex reconstruction. Destatis reported 2023 hospital patient movement data in November 2024, giving buyers a national view of inpatient treatment scale.
- Regulatory clarity supports structured supplier qualification across high-risk implants. BfArM states that devices are classified under MDR rules into classes I, IIa, IIb, and III.
- KLS Martin gives Germany a local patient-specific implant supplier base. Its IPS Implants offering combines planning and implant production for craniomaxillofacial reconstruction.
- Orthopedic personalization gains relevance as hospitals compare patient-specific implants against orthopedic trauma devices and standard fixation systems.
Key Restraints
- MDR conformity work can slow low-volume implant release when design files need extra review.
- EUDAMED obligations raise registration discipline across medical devices. BfArM stated that EUDAMED use becomes mandatory from 28 May 2026 for device and certificate registration.
- Hospital budget controls can restrain custom implant use when standard implants satisfy routine clinical cases.
What makes Germany unique
Germany is distinct because domestic precision manufacturing aligns closely with university hospital reconstruction capability.
Key Companies
- KLS Martin Group
- Materialise
- Stryker GmbH
- Johnson & Johnson MedTech Germany
- Xilloc
- joimax
Sales & Marketing Channels
- University hospital surgeon networks
- Direct OEM case planning
- EU MDR documentation review
- Distributor and agent channels
- Hospital tender systems
- Clinical workshop programs
Country Segment Breakdown Table
| Segment | Sub-Segments |
|---|---|
| By Implant Type | Cranial Implants · Orthopedic Implants · Maxillofacial Implants · Trauma Implants |
| By Technology | AI-Driven Design · 3D Printing · CAD/CAM · Conventional Casting |
| By Application | Reconstructive Surgery · Trauma · Oncologic Reconstruction |
| By End User | Hospitals · Surgical Centers · Specialty Clinics |
| Key Sub-Regions Covered, Surgical Corridors | Bavaria · Baden-Wuerttemberg · North Rhine-Westphalia · Berlin · Hamburg · Hesse |
Frequently Asked Questions
How fast is Germany patient-specific surgical implants market growing?
Germany is expected to grow at 8.0% CAGR from 2026 to 2036, guided by local surgical and supplier conditions.
Who leads Germany patient-specific surgical implants market?
KLS Martin Group, Materialise, Stryker GmbH, Johnson & Johnson MedTech Germany, Xilloc, and joimax serve specialist channels.
What is driving adoption in Germany patient-specific surgical implants market?
EU MDR documentation and domestic engineering capacity support controlled growth in Germany patient-specific surgical implants.
What supports patient-specific surgical implants growth in France?
A 7.7% CAGR through 2036 reflects university hospital demand and reimbursement discipline across regulated implant pathways.
Country Market Snapshot Table
| Parameter | Value |
|---|---|
| Market Size in 2025 (Value) | USD 265.6 million |
| Market Size in 2026 (Value) | USD 286.0 million |
| Market Forecast in 2036 (Value) | USD 600.5 million |
| CAGR (2026 to 2036) | 7.7% |
| Years Considered | 2021 to 2036 |
| Base Year | 2025 |
| Forecast Period | 2026 to 2036 |
| Units Considered | Value (USD million) |
| Leading Sub-Region | Ile-de-France and Rhone-Alpes university hospital corridors |
France Patient-Specific Surgical Implants Market Outlook
France demand is strongest in university hospital and oncology reconstruction settings where defect fit is central to the surgical plan. Suppliers must explain clinical value before premium custom implants gain wider use.
ANSM oversight and HAS pathway expectations make documentation central to supplier qualification. Companies that support reimbursement evidence and surgeon planning are better placed for repeat hospital orders.
Key Growth Drivers
- Custom-made device oversight supports traceable patient-specific implant activity. ANSM stated in 2025 that French manufacturers of class I and custom-made devices must submit compulsory activity declarations.
- Reimbursement pathway clarity supports hospital evaluation of implantable devices. HAS states that implantable and class III medical devices require special handling in France medical device pathways.
- Oncology and trauma reconstruction create a credible use pool in university hospitals that handle complex cranial and maxillofacial cases.
- Material choice benefits from European suppliers offering titanium and PEEK workflows for cranio-maxillofacial reconstruction.
Key Restraints
- Reimbursement review can slow adoption when clinical value over standard devices remains uncertain.
- ANSM guidance on Article 59 derogation stated in February 2025 that custom-made devices require a specific statement under MDR Annex XIII.
- Hospital procurement may delay premium implants when public budgets favor routine orthopedic and cranial fixation devices.
What makes France unique
France is distinct because patient-specific implant value must satisfy clinical governance and reimbursement evidence expectations.
Key Companies
- Materialise
- Stryker France
- Johnson & Johnson MedTech France
- KLS Martin France
- Amplitude Surgical
- Xilloc
Sales & Marketing Channels
- Hospital purchasing groups
- Specialist surgeon referral
- Reimbursement evidence dossiers
- EU authorized representative channels
- Distributor support
- Clinical congress education
Country Segment Breakdown Table
| Segment | Sub-Segments |
|---|---|
| By Implant Type | Cranial Implants · Orthopedic Implants · Maxillofacial Implants · Trauma Implants |
| By Technology | AI-Driven Design · 3D Printing · CAD/CAM · Conventional Casting |
| By Application | Reconstructive Surgery · Trauma · Oncologic Reconstruction |
| By End User | Hospitals · Surgical Centers · Specialty Clinics |
| Key Sub-Regions Covered, Surgical Corridors | Ile-de-France · Auvergne-Rhone-Alpes · Provence-Alpes-Cote d Azur · Nouvelle-Aquitaine · Occitanie |
Frequently Asked Questions
How fast is France patient-specific surgical implants market growing?
France is expected to grow at 7.7% CAGR from 2026 to 2036, guided by local surgical and supplier conditions.
Who leads France patient-specific surgical implants market?
Materialise, Stryker France, Johnson & Johnson MedTech France, KLS Martin France, Amplitude Surgical, and Xilloc compete through hospital access.
What is driving adoption in France patient-specific surgical implants market?
ANSM oversight and university hospital reconstruction needs support careful adoption of patient-specific surgical implants in France.
How is the patient-specific surgical implants forecast developing in Japan?
An 8.1% CAGR through 2036 reflects imaging depth and a cautious route through PMDA product review.
Country Market Snapshot Table
| Parameter | Value |
|---|---|
| Market Size in 2025 (Value) | USD 360.8 million |
| Market Size in 2026 (Value) | USD 390.0 million |
| Market Forecast in 2036 (Value) | USD 849.8 million |
| CAGR (2026 to 2036) | 8.1% |
| Years Considered | 2021 to 2036 |
| Base Year | 2025 |
| Forecast Period | 2026 to 2036 |
| Units Considered | Value (USD million) |
| Leading Sub-Region | Tokyo and Kansai specialty hospital corridors |
Japan Patient-Specific Surgical Implants Market Outlook
Japan demand is supported by specialty surgery capability and high imaging availability. Buyers require local documentation and regulatory support before adopting patient-specific implant suppliers.
The Japanese market favors careful deployment over fast experimentation in hospital implant workflows. Companies with Japanese service partners and hospital education programs are better positioned than offshore design-only suppliers.
Key Growth Drivers
- Diagnostic infrastructure supports CT-based planning for patient-matched implants. OECD reported in November 2025 that Japan had 184 CT, MRI, and PET units per million population.
- Hospital capacity supports complex surgical care across aging-related orthopedic and cranial reconstruction needs. OECD reported in November 2025 that Japan had 12.5 hospital beds per 1,000 population.
- PMDA review discipline favors suppliers that provide local technical files and safety evidence for medical devices needing MHLW approval.
- Spine and cranial use cases gain relevance as surgeons compare patient-specific implants against spinal devices in complex procedures.
Key Restraints
- Local approval timelines increase the cost of entry for suppliers without Japanese regulatory support.
- Road trauma volume is lower than many Asian markets. Japan recorded 2,547 traffic deaths in 2025, according to National Police Agency reporting shown in January 2026.
- Hospitals may avoid new suppliers when local-language documentation and case service are not reliable.
What makes Japan unique
Japan is distinct because high imaging availability is balanced by cautious device review and local service expectations.
Key Companies
- Teijin Nakashima Medical
- Kyocera Medical
- Stryker Japan
- Johnson & Johnson MedTech Japan
- Materialise Japan
- Hoya Technosurgical
Sales & Marketing Channels
- Local regulatory partner route
- Direct specialist hospital engagement
- Distributor-led hospital access
- Surgeon education programs
- Academic clinical collaboration
- Technical file localization
Country Segment Breakdown Table
| Segment | Sub-Segments |
|---|---|
| By Implant Type | Cranial Implants · Orthopedic Implants · Maxillofacial Implants · Trauma Implants |
| By Technology | AI-Driven Design · 3D Printing · CAD/CAM · Conventional Casting |
| By Application | Reconstructive Surgery · Trauma · Oncologic Reconstruction |
| By End User | Hospitals · Surgical Centers · Specialty Clinics |
| Key Sub-Regions Covered, Surgical Corridors | Tokyo · Osaka · Kanagawa · Aichi · Fukuoka · Hokkaido referral centers |
Frequently Asked Questions
How fast is Japan patient-specific surgical implants market growing?
Japan is expected to grow at 8.1% CAGR from 2026 to 2036, guided by local surgical and supplier conditions.
Who leads Japan patient-specific surgical implants market?
Teijin Nakashima Medical, Kyocera Medical, Stryker Japan, Johnson & Johnson MedTech Japan, Materialise Japan, and Hoya Technosurgical serve specialist channels.
What is driving adoption in Japan patient-specific surgical implants market?
Imaging depth and local review discipline support cautious adoption of patient-specific surgical implants in Japan.
What is shaping patient-specific surgical implants demand in China?
A 9.2% CAGR through 2036 reflects local manufacturing scale and specialty hospital demand across major urban clusters.
Country Market Snapshot Table
| Parameter | Value |
|---|---|
| Market Size in 2025 (Value) | USD 595.2 million |
| Market Size in 2026 (Value) | USD 650.0 million |
| Market Forecast in 2036 (Value) | USD 1,567.3 million |
| CAGR (2026 to 2036) | 9.2% |
| Years Considered | 2021 to 2036 |
| Base Year | 2025 |
| Forecast Period | 2026 to 2036 |
| Units Considered | Value (USD million) |
| Leading Sub-Region | Yangtze River Delta and Greater Bay Area hospital clusters |
China Patient-Specific Surgical Implants Market Outlook
China demand is propelled by hospital expansion and domestic additive manufacturing capacity. Top-tier hospitals are more likely to use complex patient-specific implants than price-sensitive routine facilities.
Local suppliers can gain share when regulatory registration and production capacity support faster design-to-delivery cycles. Global suppliers need clearer material or clinical advantages to defend premium prices.
Key Growth Drivers
- Hospital scale supports repeat reconstruction opportunities across large urban systems. China Daily cited the National Health Commission in December 2025 showing 38,700 hospitals by the end of 2024.
- High-end medical device policy supports local supplier development. NMPA issued measures in October 2025 supporting whole life-cycle regulation and development of high-end medical devices.
- Domestic additive manufacturing capability supports orthopedic and craniofacial implant production near major hospital clusters.
- Bone reconstruction demand benefits when hospitals compare patient-specific implants against bone fixation plates in complex trauma cases.
Key Restraints
- Volume-based procurement can pressure premium implant prices across public hospital buying routes.
- NMPA released the revised Good Manufacturing Practice for Medical Devices in December 2025, and the new GMP takes effect on 1 November 2026.
- Provincial registration and hospital access differences can slow adoption outside tier-one urban centers.
What makes China unique
China is distinct because fast hospital demand meets local additive manufacturing scale and tight price discipline.
Key Companies
- AK Medical
- Chunli Medical
- WEGO Orthopaedic
- MicroPort Orthopedics
- Xi an Bright Laser Technologies
- Medprin Regenerative Medical Technologies
Sales & Marketing Channels
- Public hospital tender routes
- Provincial distributor networks
- Local manufacturing partnerships
- Surgeon training centers
- NMPA registration support
- Tier-one hospital pilot cases
Country Segment Breakdown Table
| Segment | Sub-Segments |
|---|---|
| By Implant Type | Cranial Implants · Orthopedic Implants · Maxillofacial Implants · Trauma Implants |
| By Technology | AI-Driven Design · 3D Printing · CAD/CAM · Conventional Casting |
| By Application | Reconstructive Surgery · Trauma · Oncologic Reconstruction |
| By End User | Hospitals · Surgical Centers · Specialty Clinics |
| Key Sub-Regions Covered, Surgical Corridors | Yangtze River Delta · Greater Bay Area · Beijing-Tianjin-Hebei · Chengdu-Chongqing · Wuhan medical corridor |
Frequently Asked Questions
How fast is China patient-specific surgical implants market growing?
China is expected to grow at 9.2% CAGR from 2026 to 2036, guided by local surgical and supplier conditions.
Who leads China patient-specific surgical implants market?
AK Medical, Chunli Medical, WEGO Orthopaedic, MicroPort Orthopedics, Bright Laser Technologies, and Medprin compete through local channels.
What is driving adoption in China patient-specific surgical implants market?
Hospital scale and local additive manufacturing capacity support China patient-specific surgical implants growth.
How does South Korea compare in the patient-specific surgical implants market?
An 8.7% CAGR through 2036 reflects export-ready suppliers and strong digital hospital infrastructure.
Country Market Snapshot Table
| Parameter | Value |
|---|---|
| Market Size in 2025 (Value) | USD 225.4 million |
| Market Size in 2026 (Value) | USD 245.0 million |
| Market Forecast in 2036 (Value) | USD 564.2 million |
| CAGR (2026 to 2036) | 8.7% |
| Years Considered | 2021 to 2036 |
| Base Year | 2025 |
| Forecast Period | 2026 to 2036 |
| Units Considered | Value (USD million) |
| Leading Sub-Region | Seoul Capital Area and Daegu medical device corridors |
South Korea Patient-Specific Surgical Implants Market Outlook
South Korea demand is shaped by medtech suppliers that use global clearances to build credibility beyond the domestic market. Hospitals value quick titanium design support and reliable engineering communication.
The market is also an export story because domestic volume is smaller than China or Japan. Suppliers with FDA clearances can use Korea-based manufacturing to serve USA and European demand.
Key Growth Drivers
- FDA-cleared Korean products improve buyer confidence in local patient-specific implant suppliers. FDA listed CGBio EASYMADE-TI under K252251 in April 2026 for patient-specific titanium cranial reconstruction.
- Hospital equipment capacity supports digital case planning. OECD reported in November 2025 that Korea had 87 CT, MRI, and PET units per million population.
- Domestic hospital capacity supports specialty surgical care. OECD reported in November 2025 that Korea had 12.6 hospital beds per 1,000 population.
- Export orientation encourages stronger documentation discipline and validated production records for patient-specific implant suppliers.
Key Restraints
- Domestic volume remains smaller than China or Japan and therefore limits local scale without overseas sales.
- MFDS noted in a September 2025 IMDRF update that long-term follow-up for implantable medical devices has a legal basis effective 31 January 2025.
- Premium implants face budget checks when hospitals can use standard cranial or maxillofacial plates.
What makes South Korea unique
South Korea is distinct because patient-specific implant suppliers can use domestic engineering as an export platform.
Key Companies
- CGBio
- Meticuly
- Jeil Medical
- L&K Biomed
- Corentec
- Osteonic
Sales & Marketing Channels
- Direct specialist hospital engagement
- Overseas regulatory clearance strategy
- Distributor partnerships
- Surgeon education programs
- Academic hospital pilots
- Export sales channels
Country Segment Breakdown Table
| Segment | Sub-Segments |
|---|---|
| By Implant Type | Cranial Implants · Orthopedic Implants · Maxillofacial Implants · Trauma Implants |
| By Technology | AI-Driven Design · 3D Printing · CAD/CAM · Conventional Casting |
| By Application | Reconstructive Surgery · Trauma · Oncologic Reconstruction |
| By End User | Hospitals · Surgical Centers · Specialty Clinics |
| Key Sub-Regions Covered, Surgical Corridors | Seoul Capital Area · Daegu-Gyeongbuk · Busan · Daejeon · Incheon medical clusters |
Frequently Asked Questions
How fast is South Korea patient-specific surgical implants market growing?
South Korea is expected to grow at 8.7% CAGR from 2026 to 2036, guided by local surgical and supplier conditions.
Who leads South Korea patient-specific surgical implants market?
CGBio, Meticuly, Jeil Medical, L&K Biomed, Corentec, and Osteonic compete through domestic and export pathways.
What is driving adoption in South Korea patient-specific surgical implants market?
FDA clearance activity and dense hospital infrastructure support South Korea patient-specific surgical implants growth.
What supports patient-specific surgical implants growth in India?
A 9.0% CAGR through 2036 reflects private tertiary hospital adoption and local patient-specific design participation.
Country Market Snapshot Table
| Parameter | Value |
|---|---|
| Market Size in 2025 (Value) | USD 167.0 million |
| Market Size in 2026 (Value) | USD 182.0 million |
| Market Forecast in 2036 (Value) | USD 430.9 million |
| CAGR (2026 to 2036) | 9.0% |
| Years Considered | 2021 to 2036 |
| Base Year | 2025 |
| Forecast Period | 2026 to 2036 |
| Units Considered | Value (USD million) |
| Leading Sub-Region | Mumbai, Pune, Bengaluru, Hyderabad, and Delhi NCR corridors |
India Patient-Specific Surgical Implants Market Outlook
India demand is shaped by private tertiary hospitals and local design bureaus serving cranial, maxillofacial, and orthopedic cases. Affordability remains central because many complex procedures include out-of-pocket exposure.
Suppliers need to balance low-cost engineering with credible regulatory and quality records. Companies with local surgeon relationships can convert complex cases faster than import-only channels.
Key Growth Drivers
- Trauma burden creates a visible need for reconstruction capacity. The Ministry of Road Transport and Highways reported in December 2025 that India recorded road accident fatalities across all states for calendar year 2024.
- Formal device regulation improves buyer confidence over time. CDSCO states that all medical devices in India are regulated under the Drugs and Cosmetics Act and Medical Devices Rules 2017.
- Local patient-specific implant providers reduce case design cost and improve surgeon communication in private hospital networks.
- Personalized surgical planning gains relevance as Indian hospitals compare implant workflows against 3D bioprinting and medical 3D printing services.
Key Restraints
- Out-of-pocket payment limits patient access when custom implants carry a premium over standard plates.
- Road Accidents in India 2024 reported 64772 fatalities on national highways, showing trauma demand remains high but payer capacity stays uneven.
- Regulatory classification uncertainty can slow new 3D printed implant formats when clinical and quality documentation remains incomplete.
What makes India unique
India is distinct because high clinical need requires affordable design and credible regulatory assurance.
Key Companies
- Lucid Implants
- Anatomiz3D
- Graft3D Healthcare
- Meril Life Sciences
- Stryker India
- Johnson & Johnson MedTech India
Sales & Marketing Channels
- Private hospital direct sales
- Surgeon referral networks
- Local 3D printing bureaus
- Academic institute partnerships
- Tender-based public supply
- Distributor-led access
Country Segment Breakdown Table
| Segment | Sub-Segments |
|---|---|
| By Implant Type | Cranial Implants · Orthopedic Implants · Maxillofacial Implants · Trauma Implants |
| By Technology | AI-Driven Design · 3D Printing · CAD/CAM · Conventional Casting |
| By Application | Reconstructive Surgery · Trauma · Oncologic Reconstruction |
| By End User | Hospitals · Surgical Centers · Specialty Clinics |
| Key Sub-Regions Covered, Surgical Corridors | Mumbai · Pune · Bengaluru · Hyderabad · Delhi NCR · Chennai specialty corridors |
Frequently Asked Questions
How fast is India patient-specific surgical implants market growing?
India is expected to grow at 9.0% CAGR from 2026 to 2036, guided by local surgical and supplier conditions.
Who leads India patient-specific surgical implants market?
Lucid Implants, Anatomiz3D, Graft3D Healthcare, Meril Life Sciences, Stryker India, and Johnson & Johnson MedTech India serve local channels.
What is driving adoption in India patient-specific surgical implants market?
Private tertiary hospitals and local patient-specific implant providers support controlled growth in India.
Who are the leading companies in the patient-specific surgical implants market?
Stryker, DePuy Synthes, Materialise, 3D Systems, KLS Martin, Xilloc, Meticuly, and CGBio are profiled in the market.
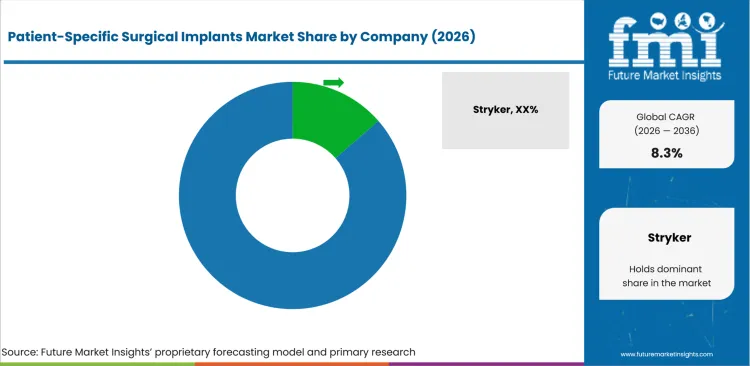
- Competition is organized around case-planning depth and validated materials plus surgeon support and regulatory documentation.
- Integrated implant OEMs benefit from established surgical relationships and adjacent fixation portfolios in cranial and orthopedic procedures.
- Digital planning specialists gain share when hospitals want one partner for segmentation and record-controlled production.
- Focused patient-specific manufacturers compete by faster engineer review and narrow expertise in craniofacial implant cases.
Competitive advantage in patient-specific surgical implants comes from workflow control across imaging review, implant design and production release plus shipment timing. 3D Systems strengthened this position after FDA cleared VSP PEEK Cranial Implant in April 2024. Suppliers in adjacent smart implants categories face similar proof requirements when hospitals ask for quality system evidence.
Established companies hold an advantage because surgeons already trust their fixation systems and hospital buyers understand their service routes. Stryker offers PEEK Customized Implants for cranial and craniofacial skeleton voids. DePuy Synthes offers TRUMATCH CMF PEEK milled implants built from high-resolution CT scans. These portfolios connect patient-specific design with known CMF procedure support.
Specialist firms are better positioned when surgeon collaboration matters more than catalog breadth. KLS Martin emphasizes planning and implant production inside its IPS Implants workflow. Xilloc designs patient-specific CMF implants and surgical aids for cranial reconstruction, mandibular reconstruction, and orbital floor repair. Meticuly and CGBio show how newer suppliers can gain credibility through FDA-cleared patient-specific titanium implants.
How do top patient-specific surgical implants companies compare?
3D Systems and Materialise score well on digital workflow depth while Stryker and DePuy Synthes hold stronger hospital portfolio access.
| Company | Regulatory Depth | Implant Portfolio | Surgeon Case Support | Channel Reach | Geographic Footprint |
|---|---|---|---|---|---|
| Stryker | Strong | Very Strong | Strong | Very Strong | Global |
| DePuy Synthes | Strong | Very Strong | Strong | Very Strong | Global |
| Materialise | Strong | Strong | Very Strong | Strong | Europe and United States |
| 3D Systems | Very Strong | Strong | Very Strong | Strong | United States and Europe |
| KLS Martin | Strong | Strong | Very Strong | Strong | Europe and North America |
| Xilloc | Moderate | Strong | Very Strong | Moderate | Europe |
| Meticuly | Very Strong | Strong | Strong | Moderate | Asia and United States |
| CGBio | Very Strong | Strong | Moderate | Moderate | South Korea and United States |
| Lucid Implants | Moderate | Strong | Strong | Moderate | India |
| AK Medical | Strong | Very Strong | Moderate | Strong | China and export markets |
Source: Future Market Insights competitive analysis, 2026.
Who are the key players in the patient-specific surgical implants market?
Stryker, DePuy Synthes, Materialise, 3D Systems, and KLS Martin are listed with focused patient-specific suppliers.
Key global companies leading the patient-specific surgical implants market include:
- Stryker
- DePuy Synthes
- Materialise
- 3D Systems
- KLS Martin
- Xilloc
- Meticuly
- CGBio
- Lucid Implants
- AK Medical
Key Developments in Patient-Specific Surgical Implants Market
- In April 2024, 3D Systems received FDA 510(k) clearance for VSP PEEK Cranial Implant and strengthened a regulated path for additively manufactured PEEK cranioplasty.
- In February 2026, Materialise added custom-made PEEK implants to its CMF portfolio and gave surgeons a titanium-or-PEEK choice inside one digital workflow.
- In April 2026, CGBio secured FDA 510(k) clearance for EASYMADE-TI and improved export credibility for Korean patient-specific titanium cranial implants.
Key Players in the Patient-Specific Surgical Implants Market
Integrated Implant OEMs
- Stryker
- DePuy Synthes
- KLS Martin
- AK Medical
- MicroPort Orthopedics
Digital Planning Specialists
- Materialise
- 3D Systems
- Anatomiz3D
- Graft3D Healthcare
- Xilloc
Focused Patient-Specific Implant Manufacturers
- Meticuly
- CGBio
- Lucid Implants
- Osteopore
- Jeil Medical
Patient-Specific Surgical Implants Market - Report Scope
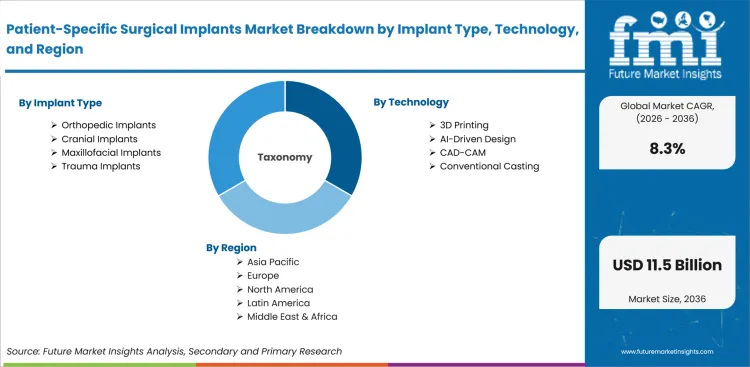
| Parameter | Details |
|---|---|
| Forecast period | 2026 to 2036 |
| Historical period | 2021 to 2025 |
| Quantitative unit | Revenue in USD million |
| By implant type | Cranial implants, orthopedic implants, maxillofacial implants, trauma implants |
| By technology | AI-driven design, 3D printing, CAD/CAM, conventional casting |
| By application | Reconstructive surgery, trauma, oncologic reconstruction |
| By end user | Hospitals, surgical centers, specialty clinics |
| Regions covered | North America, Europe, East Asia, Middle East, and Rest of World |
| Countries covered | United States, United Kingdom, Germany, France, Japan, China, South Korea, India |
| Key companies profiled | Stryker, DePuy Synthes, Materialise, 3D Systems, KLS Martin, Xilloc, Meticuly, CGBio, Lucid Implants, AK Medical |
| Approach | Hybrid bottom-up and top-down methodology using verified product evidence, country demand signals, technology adoption rates, and supplier portfolio checks |
Source: Future Market Insights, 2026.
Patient-Specific Surgical Implants Market - Scope & Definition
| Attribute | Detail |
|---|---|
| Market Definition | Implantable devices designed for one patient using imaging data, surgical planning data, or anatomy-matched engineering files. |
| Functions Covered | Defect restoration, load support, cranial closure, maxillofacial reconstruction, and patient-specific orthopedic stabilization. |
| Applications Covered | Cranial reconstruction, spine and joint reconstruction, trauma repair, maxillofacial reconstruction, and oncologic defect closure. |
| End-Use Industries | Hospitals, surgical centers, specialty clinics, implant OEMs, additive manufacturing service providers, and surgical planning providers. |
| Grades Covered | Titanium, PEEK, PMMA, porous metal structures, milled implants, and printed implantable devices where approved. |
| Inclusions | Patient-specific cranial implants, orthopedic implants, maxillofacial implants, trauma implants, AI-driven design, 3D printing, CAD/CAM, and conventional casting. |
| Exclusions | Mass-produced implants selected only by size, non-implant surgical guides, anatomical models, external prosthetics, dental crowns, and software sold without an implantable device. |
Patient-Specific Surgical Implants Market - Research Methodology
| Method | Description |
|---|---|
| Primary Research | FMI analyst interviews with implant OEMs, hospital procurement teams, surgeon case-planning groups, additive manufacturing providers, and specialty distributors across major markets. |
| Desk Research | Review of FDA clearances, regulator guidance, national healthcare data, official company pages, and compliance sources covering patient-specific implants. |
| Market Sizing & Forecasting | Hybrid bottom-up and top-down approach using verified product scope, 2025 parent implant demand, technology use rates, country readiness, and supplier portfolio evidence. |
| Data Validation | Cross-verification using regulatory clearances, company portfolios, hospital infrastructure signals, country-level demand indicators, and FMI analyst checks against supplied market values. |
Patient-Specific Surgical Implants Market Breakdown by Implant Type, Technology, Application, End User, and Region
Patient-Specific Surgical Implants Market Segmented by Implant Type
- Cranial Implants
- Orthopedic Implants
- Maxillofacial Implants
- Trauma Implants
Patient-Specific Surgical Implants Market Segmented by Technology
- AI-Driven Design
- 3D Printing
- CAD/CAM
- Conventional Casting
Patient-Specific Surgical Implants Market Segmented by Application
- Reconstructive Surgery
- Trauma
- Oncologic Reconstruction
Patient-Specific Surgical Implants Market Segmented by End User
- Hospitals
- Surgical Centers
- Specialty Clinics
Patient-Specific Surgical Implants Market by Region
- North America
- Europe
- East Asia
- Middle East
- Rest of World
Research Sources and Bibliography
- USA Food and Drug Administration. (2023, May 12). 3D printing of medical devices. USA Food and Drug Administration.
- USA Food and Drug Administration. (2024, April 4). K231834: VSP PEEK Cranial Implant. USA Food and Drug Administration.
- USA Food and Drug Administration. (2025, March 27). Medical Device Reporting: How to report medical device problems. USA Food and Drug Administration.
- USA Food and Drug Administration. (2026, May 6). Patient-matched guides for orthopedic implants. USA Food and Drug Administration.
- Centers for Medicare & Medicaid Services. (2026, January 14). National health expenditure data: NHE fact sheet. CMS.
- Centers for Disease Control and Prevention. (2026, April 27). TBI data. CDC.
- American Hospital Association. (2026, February 5). Fast facts on USA hospitals, 2026. AHA.
- Medicines and Healthcare products Regulatory Agency. (2025, June 16). Custom-made medical devices in Great Britain. GOV.UK.
- NHS England. (2026, January 22). Diagnostic Imaging Dataset statistical release. NHS England.
- NHS England Digital. (2025, September 25). Hospital Admitted Patient Care Activity, 2024-25. NHS England Digital.
- Bundesinstitut fuer Arzneimittel und Medizinprodukte. (2026). Medical devices: Regulatory framework. BfArM.
- Federal Statistical Office of Germany. (2024, November 7). Patients discharged from hospital after inpatient treatment. Destatis.
- European Commission. (2025). Custom-made devices. European Commission Public Health.
- Agence nationale de securite du medicament et des produits de sante. (2025). Monitoring medical devices and other products. ANSM.
- Haute Autorite de Sante. (2025). Pathway of medical devices in France. HAS.
- Pharmaceuticals and Medical Devices Agency. (2026). Regulations and approval or certification of medical devices. PMDA.
- Organisation for Economic Co-operation and Development. (2025, November 13). Health at a Glance 2025: Japan. OECD.
- Organisation for Economic Co-operation and Development. (2025, November 13). Health at a Glance 2025: Korea. OECD.
- National Police Agency of Japan. (2026, January 6). Traffic Bureau overview. NPA.
- National Medical Products Administration. (2025, October 14). Measures to optimize whole life-cycle regulation in support of innovative development of high-end medical devices. NMPA.
- National Health Commission of the PRC. (2025, December 4). 2024 statistical bulletin on the development of healthcare in China. National Health Commission.
- Ministry of Food and Drug Safety. (2025, September). Regulatory update on medical devices in the Republic of Korea. MFDS.
- Central Drugs Standard Control Organization. (2026). Medical device and diagnostics. CDSCO.
- Ministry of Road Transport and Highways. (2025, December 10). State-wise details of fatalities due to road accidents for calendar year 2020 to 2024. Government of India.
- Ministry of Road Transport and Highways. (2025). Road Accidents in India 2024. Government of India.
- 3D Systems. (2024, April 15). 3D Systems announces FDA clearance for world’s first 3D-printed PEEK cranial implants. 3D Systems.
- Materialise NV. (2026, February 17). Materialise expands CMF portfolio with custom-made PEEK implants. Materialise.
- CGBio Co., Ltd. (2026, April 9). K252251: EASYMADE-TI 510(k) summary. USA Food and Drug Administration.
- Meticuly Co., Ltd. (2024, June 18). Meticuly announces FDA 510(k) clearance for patient-specific titanium maxillofacial mesh implant. Meticuly.
- KLS Martin Group. (2026). Individual Patient Solutions. KLS Martin.
- Stryker. (2026). PEEK customized implant. Stryker.
- Johnson & Johnson MedTech. (2026). TRUMATCH CMF PEEK milled implants. Johnson & Johnson MedTech.
- Xilloc Medical B.V. (2026). Patient-specific CMF implants and surgical aids. Xilloc.
- Lucid Implants. (2026). Patient-specific implant solutions. Lucid Implants.
- Anatomiz3D Medtech. (2026). Patient-specific 3D planning and implant services. Anatomiz3D.
- AK Medical Holdings Limited. (2026). Additive manufacturing orthopedic implant capabilities. AK Medical.
This bibliography is provided for reader reference and uses regulatory and government sources plus company and official product references tied to the market scope.
This Report Answers
- Market size estimates for 2026 and forecasts through 2036 for the patient-specific surgical implants market.
- Analysis of implant type and technology plus application, end user and regional segmentation across the forecast period.
- Evaluation of demand drivers tied to CT-based planning and 3D printing plus material selection and hospital case review.
- Assessment of regulatory documentation and post-market record requirements that influence supplier qualification.
- Country-level growth analysis covering the United States, United Kingdom, Germany, France, Japan, China, South Korea and India.
- Review of local and regional companies that participate in patient-specific implant design and manufacturing or distribution.
- Competitive assessment of integrated implant OEMs and digital planning specialists plus focused patient-specific implant manufacturers.
- Evaluation of opportunities across cranial reconstruction and orthopedic revision plus maxillofacial repair and trauma-related implant use.
- Review of PEEK and titanium selection factors across imaging follow-up and strength requirements plus defect geometry.
- Delivery of market data and forecasts plus source-backed analysis and supporting segmentation in a reference-matched Word format.
Frequently Asked Questions
What is the growth prospect for patient-specific surgical implants?
Demand for patient-specific surgical implants is expected to rise as hospitals adopt anatomy-matched reconstruction workflows for complex cranial and orthopedic cases.
Which companies are expected to shape the patient-specific surgical implants market?
Stryker, DePuy Synthes, Materialise, 3D Systems, KLS Martin, Xilloc, Meticuly, and CGBio are expected to shape competition.
Why are hospitals investing in patient-specific surgical implants?
Hospitals are investing in patient-specific surgical implants to improve fit accuracy and reduce intraoperative shaping in complex reconstruction procedures.
Why is 3D printing important in patient-specific surgical implants?
3D printing supports porous titanium and custom PEEK geometries that are difficult to produce using standard manufacturing routes.
Which implant type is gaining attention in patient-specific surgical implants?
Orthopedic implants are gaining attention due to spine and trauma cases that need anatomy-matched support.
How do regulations influence patient-specific surgical implant launches?
Regulations influence launches by requiring documented design inputs and material controls plus validation records and post-market responsibility for patient-matched devices.
What role does imaging play in patient-specific surgical implants?
CT and MRI data define defect geometry and support surgeon approval before the implant moves into controlled production.
How do PEEK and titanium differ in patient-specific implant selection?
PEEK supports clearer imaging follow-up while titanium supports strength and porous structures for selected reconstruction cases.
Preview the report firsthand - request a free sample
Get SampleGet the brochure for pricing and purchase details.
Get PDFTable of Content
- Key Takeaways
- Market Size and CAGR
- Top Growth Driver
- Fastest Growing Segment
- Leading Region
- Key Companies
- Emerging Opportunities
- Executive Summary
- Global Market Outlook
- Demand-side Trends
- Supply-side Trends
- Technology Roadmap Analysis
- Analysis and Recommendations
- Analyst Perspective (What is happening? Why now? What should investors know?)
- Key Questions Answered
- How large is the market?
- What is the CAGR?
- What are key trends?
- Which region dominates?
- Who are the leaders?
- Market Overview
- Market Coverage / Taxonomy
- Market Definition / Scope / Limitations
- Research Methodology
- Chapter Orientation
- Analytical Lens and Working Hypotheses
- Market Structure, Signals, and Trend Drivers
- Benchmarking and Cross-market Comparability
- Market Sizing, Forecasting, and Opportunity Mapping
- Research Design and Evidence Framework
- Desk Research Programme (Secondary Evidence)
- Expert Input and Fieldwork (Primary Evidence)
- Tooling, Models, and Reference Databases
- Data Engineering and Model Build
- Quality Assurance and Audit Trail
- Market Background
- Market Dynamics (Drivers, Restraints, Opportunity, Trends)
- Scenario Forecast (Optimistic, Likely, Conservative)
- Impact Analysis
- AI Impact
- Sustainability Impact
- Regulatory Impact
- Technology Impact
- Consumer / Buyer Analysis
- Purchase Drivers
- Adoption Barriers
- Buyer Journey
- Opportunity Map Analysis
- Product Life Cycle Analysis
- Supply Chain Analysis
- Investment Feasibility Matrix
- Value Chain Analysis
- PESTLE and Porter's Analysis
- Regulatory Landscape
- Regional Parent Market Outlook
- Production and Consumption Statistics
- Import and Export Statistics
- Global Market Analysis and Forecast, 2021 to 2036
- Historical Market Size Value (USD Billion) & Volume (Unit) Analysis, 2021 to 2025
- Current and Future Market Size Value (USD Billion) & Volume (Unit) Projections, 2026 to 2036
- Y-o-Y Growth Trend Analysis
- Absolute $ Opportunity Analysis
- Global Market Pricing Analysis, 2021 to 2036
- Global Market Analysis and Forecast, By Implant Type, 2021 to 2036
- Introduction / Key Findings
- Historical Market Size Value (USD Billion) & Volume (Unit) Analysis By Implant Type, 2021 to 2025
- Current and Future Market Size Value (USD Billion) & Volume (Unit) Analysis and Forecast By Implant Type, 2026 to 2036
- Orthopedic Implants
- Cranial Implants
- Maxillofacial Implants
- Trauma Implants
- Orthopedic Implants
- Y-o-Y Growth Trend Analysis By Implant Type, 2021 to 2025
- Absolute $ Opportunity Analysis By Implant Type, 2026 to 2036
- Global Market Analysis and Forecast, By Technology, 2021 to 2036
- Introduction / Key Findings
- Historical Market Size Value (USD Billion) & Volume (Unit) Analysis By Technology, 2021 to 2025
- Current and Future Market Size Value (USD Billion) & Volume (Unit) Analysis and Forecast By Technology, 2026 to 2036
- 3D Printing
- AI-Driven Design
- CAD-CAM
- Conventional Casting
- 3D Printing
- Y-o-Y Growth Trend Analysis By Technology, 2021 to 2025
- Absolute $ Opportunity Analysis By Technology, 2026 to 2036
- Global Market Analysis and Forecast, By Application, 2021 to 2036
- Introduction / Key Findings
- Historical Market Size Value (USD Billion) & Volume (Unit) Analysis By Application, 2021 to 2025
- Current and Future Market Size Value (USD Billion) & Volume (Unit) Analysis and Forecast By Application, 2026 to 2036
- Reconstructive Surgery
- Trauma
- Oncologic Reconstruction
- Reconstructive Surgery
- Y-o-Y Growth Trend Analysis By Application, 2021 to 2025
- Absolute $ Opportunity Analysis By Application, 2026 to 2036
- Global Market Analysis and Forecast, By End User, 2021 to 2036
- Introduction / Key Findings
- Historical Market Size Value (USD Billion) & Volume (Unit) Analysis By End User, 2021 to 2025
- Current and Future Market Size Value (USD Billion) & Volume (Unit) Analysis and Forecast By End User, 2026 to 2036
- Hospitals
- Surgical Centers
- Specialty Clinics
- Hospitals
- Y-o-Y Growth Trend Analysis By End User, 2021 to 2025
- Absolute $ Opportunity Analysis By End User, 2026 to 2036
- Global Market Analysis and Forecast, By Region, 2021 to 2036
- Introduction
- Historical Market Size Value (USD Billion) & Volume (Unit) Analysis By Region, 2021 to 2025
- Current Market Size Value (USD Billion) & Volume (Unit) Analysis and Forecast By Region, 2026 to 2036
- North America
- Latin America
- Western Europe
- Eastern Europe
- East Asia
- South Asia and Pacific
- Middle East & Africa
- Market Attractiveness Analysis By Region
- North America Market Analysis and Forecast, By Country, 2021 to 2036
- Historical Market Size Value (USD Billion) & Volume (Unit) Trend Analysis By Market Taxonomy, 2021 to 2025
- Market Size Value (USD Billion) & Volume (Unit) Forecast By Market Taxonomy, 2026 to 2036
- By Country
- USA
- Canada
- Mexico
- By Implant Type
- By Technology
- By Application
- By End User
- By Country
- Market Attractiveness Analysis
- By Country
- By Implant Type
- By Technology
- By Application
- By End User
- Key Takeaways
- Latin America Market Analysis and Forecast, By Country
- Historical Market Size Value (USD Billion) & Volume (Unit) Trend Analysis By Market Taxonomy, 2021 to 2025
- Market Size Value (USD Billion) & Volume (Unit) Forecast By Market Taxonomy, 2026 to 2036
- By Country
- Brazil
- Chile
- Rest of Latin America
- By Implant Type
- By Technology
- By Application
- By End User
- By Country
- Market Attractiveness Analysis
- By Country
- By Implant Type
- By Technology
- By Application
- By End User
- Key Takeaways
- Western Europe Market Analysis and Forecast, By Country
- Historical Market Size Value (USD Billion) & Volume (Unit) Trend Analysis By Market Taxonomy, 2021 to 2025
- Market Size Value (USD Billion) & Volume (Unit) Forecast By Market Taxonomy, 2026 to 2036
- By Country
- Germany
- UK
- Italy
- Spain
- France
- Nordic
- BENELUX
- Rest of Western Europe
- By Implant Type
- By Technology
- By Application
- By End User
- By Country
- Market Attractiveness Analysis
- By Country
- By Implant Type
- By Technology
- By Application
- By End User
- Key Takeaways
- Eastern Europe Market Analysis and Forecast, By Country
- Historical Market Size Value (USD Billion) & Volume (Unit) Trend Analysis By Market Taxonomy, 2021 to 2025
- Market Size Value (USD Billion) & Volume (Unit) Forecast By Market Taxonomy, 2026 to 2036
- By Country
- Russia
- Poland
- Hungary
- Balkan & Baltic
- Rest of Eastern Europe
- By Implant Type
- By Technology
- By Application
- By End User
- By Country
- Market Attractiveness Analysis
- By Country
- By Implant Type
- By Technology
- By Application
- By End User
- Key Takeaways
- East Asia Market Analysis and Forecast, By Country
- Historical Market Size Value (USD Billion) & Volume (Unit) Trend Analysis By Market Taxonomy, 2021 to 2025
- Market Size Value (USD Billion) & Volume (Unit) Forecast By Market Taxonomy, 2026 to 2036
- By Country
- China
- Japan
- South Korea
- By Implant Type
- By Technology
- By Application
- By End User
- By Country
- Market Attractiveness Analysis
- By Country
- By Implant Type
- By Technology
- By Application
- By End User
- Key Takeaways
- South Asia and Pacific Market Analysis and Forecast, By Country
- Historical Market Size Value (USD Billion) & Volume (Unit) Trend Analysis By Market Taxonomy, 2021 to 2025
- Market Size Value (USD Billion) & Volume (Unit) Forecast By Market Taxonomy, 2026 to 2036
- By Country
- India
- ASEAN
- Australia & New Zealand
- Rest of South Asia and Pacific
- By Implant Type
- By Technology
- By Application
- By End User
- By Country
- Market Attractiveness Analysis
- By Country
- By Implant Type
- By Technology
- By Application
- By End User
- Key Takeaways
- Middle East & Africa Market Analysis and Forecast, By Country
- Historical Market Size Value (USD Billion) & Volume (Unit) Trend Analysis By Market Taxonomy, 2021 to 2025
- Market Size Value (USD Billion) & Volume (Unit) Forecast By Market Taxonomy, 2026 to 2036
- By Country
- Kingdom of Saudi Arabia
- Other GCC Countries
- Türkiye
- South Africa
- Other African Union
- Rest of Middle East & Africa
- By Implant Type
- By Technology
- By Application
- By End User
- By Country
- Market Attractiveness Analysis
- By Country
- By Implant Type
- By Technology
- By Application
- By End User
- Key Takeaways
- Key Countries Market Analysis
- USA
- Pricing Analysis
- Market Share Analysis, 2025
- By Implant Type
- By Technology
- By Application
- By End User
- Canada
- Pricing Analysis
- Market Share Analysis, 2025
- By Implant Type
- By Technology
- By Application
- By End User
- Mexico
- Pricing Analysis
- Market Share Analysis, 2025
- By Implant Type
- By Technology
- By Application
- By End User
- Brazil
- Pricing Analysis
- Market Share Analysis, 2025
- By Implant Type
- By Technology
- By Application
- By End User
- Chile
- Pricing Analysis
- Market Share Analysis, 2025
- By Implant Type
- By Technology
- By Application
- By End User
- Germany
- Pricing Analysis
- Market Share Analysis, 2025
- By Implant Type
- By Technology
- By Application
- By End User
- UK
- Pricing Analysis
- Market Share Analysis, 2025
- By Implant Type
- By Technology
- By Application
- By End User
- Italy
- Pricing Analysis
- Market Share Analysis, 2025
- By Implant Type
- By Technology
- By Application
- By End User
- Spain
- Pricing Analysis
- Market Share Analysis, 2025
- By Implant Type
- By Technology
- By Application
- By End User
- France
- Pricing Analysis
- Market Share Analysis, 2025
- By Implant Type
- By Technology
- By Application
- By End User
- India
- Pricing Analysis
- Market Share Analysis, 2025
- By Implant Type
- By Technology
- By Application
- By End User
- ASEAN
- Pricing Analysis
- Market Share Analysis, 2025
- By Implant Type
- By Technology
- By Application
- By End User
- Australia & New Zealand
- Pricing Analysis
- Market Share Analysis, 2025
- By Implant Type
- By Technology
- By Application
- By End User
- China
- Pricing Analysis
- Market Share Analysis, 2025
- By Implant Type
- By Technology
- By Application
- By End User
- Japan
- Pricing Analysis
- Market Share Analysis, 2025
- By Implant Type
- By Technology
- By Application
- By End User
- South Korea
- Pricing Analysis
- Market Share Analysis, 2025
- By Implant Type
- By Technology
- By Application
- By End User
- Russia
- Pricing Analysis
- Market Share Analysis, 2025
- By Implant Type
- By Technology
- By Application
- By End User
- Poland
- Pricing Analysis
- Market Share Analysis, 2025
- By Implant Type
- By Technology
- By Application
- By End User
- Hungary
- Pricing Analysis
- Market Share Analysis, 2025
- By Implant Type
- By Technology
- By Application
- By End User
- Kingdom of Saudi Arabia
- Pricing Analysis
- Market Share Analysis, 2025
- By Implant Type
- By Technology
- By Application
- By End User
- Türkiye
- Pricing Analysis
- Market Share Analysis, 2025
- By Implant Type
- By Technology
- By Application
- By End User
- South Africa
- Pricing Analysis
- Market Share Analysis, 2025
- By Implant Type
- By Technology
- By Application
- By End User
- USA
- Market Structure Analysis
- Competition Dashboard
- Competition Benchmarking
- Market Share Analysis of Top Players
- By Regional
- By Implant Type
- By Technology
- By Application
- By End User
- Emerging Startups
- Innovation Benchmarking
- Competition Analysis
- Competition Deep Dive
- Stryker
- Overview
- Product Portfolio
- Profitability by Market Segments (Product/Region/Sales Channel)
- Sales Footprint
- Strategy Overview
- Marketing Strategy
- Product Strategy
- Channel Strategy
- DePuy Synthes
- Materialise
- 3D Systems
- KLS Martin
- Xilloc
- Meticuly
- CGBio
- Lucid Implants
- AK Medical
- Stryker
- Case Studies
- Success Stories
- Recent Developments
- Competition Deep Dive
- Assumptions & Acronyms Used


