

- Market Size (2026)
- USD 4.90 Mn
- Forecast (2036)
- USD 10.40 Mn
- CAGR (2026 to 2036)
- 7.8%
How big is the Permeable Concrete Pavers Market in 2026?
USD 4.90 million in 2026 and USD 10.40 million by 2036 at a 7.8% CAGR.
Permeable paving is becoming more and more popular as commercial developers and municipalities employ it to control stormwater runoff and ease the strain on drainage systems. 62% of demand comes from new construction, and 46.6% comes from direct manufacturer sales. Because of their durability, ease of replacement, and drainage performance, interlocking concrete pavers hold a 38% market share.
India and China are estimated to expand at considerable rate as urban infrastructure and sponge-city programs raise surface-water planning needs. The United States, Germany and the United Kingdom are anticipated to expand through specification-led adoption where base design and inspection records shape approval. The USA Department of Transportation listed at least USD 1.5 billion for FY 2026 BUILD grants in December 2025, which reinforces public works demand for underground rainwater collection modules.
Municipal engineers and landscape contractors are projected to adopt permeable concrete pavers where paved areas must drain water without adding separate channels. Unilock issued a commercial specification for permeable concrete paver materials in September 2025, which shows how contractors now request joint aggregate and setting-bed details before installation. Developers comparing green building materials demand also use these records to reduce approval friction.
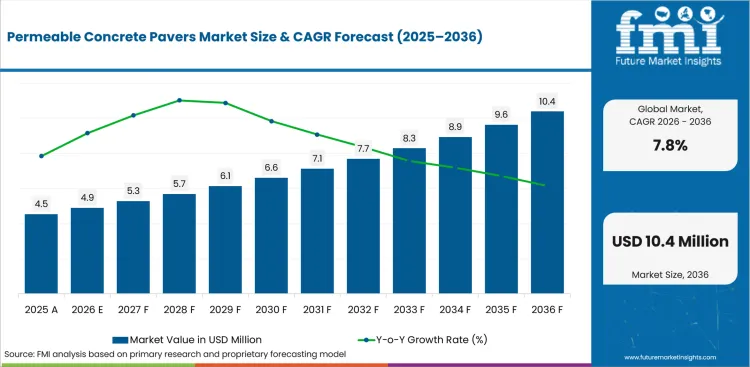
Summary of the Permeable Concrete Pavers Market
| Market Signal | Commercial Impact |
|---|---|
| Demand and Growth Drivers | Stormwater approval and project accountability are expected to push spending toward permeable concrete pavers. Documentation needs are projected to make contractors test sub-base details before repeat use.
|
| Product and Segment View | New construction and direct manufacturer channels are expected to lead their parent categories in 2026. Interlocking concrete pavers are forecast to remain the main product screen.
|
| Geography and Growth Outlook | India and China are projected to form the higher-growth tier due to urban drainage investment and faster project turnover. Established markets are expected to grow under specification-led adoption cycles.
|
| Competitive Landscape | Competition is moderately fragmented around regional manufacturing and jobsite support. Sourcing screens are expected to center on specification files and delivery ownership.
|
| Analyst Perspective | Permeable pavers gain edge when they reduce stormwater review while remaining easy for maintenance teams to service. The buying decision therefore exists between civil design, contractor execution and long-term surface upkeep.
|
How is the Permeable Concrete Pavers Market segmented?
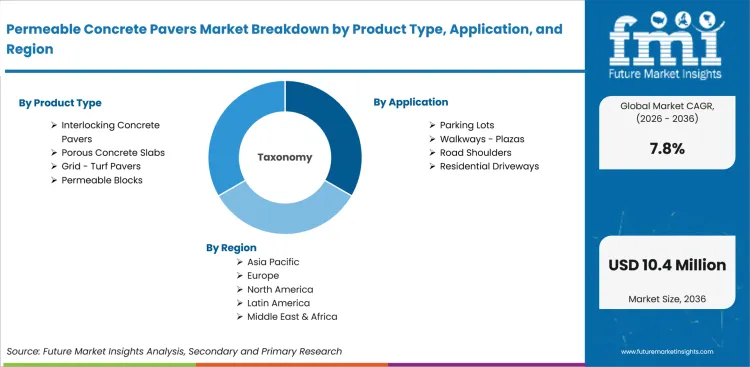
The permeable concrete pavers industry is segmented by product type, application, end use, installation type, sales channel and region.
The permeable concrete pavers market is segmented by product type, application, end use, installation type, sales channel and region. By product type, the market covers interlocking concrete pavers, porous concrete slabs, grid or turf pavers, and permeable blocks. By application, it covers parking lots, walkways or plazas, road shoulders, and residential driveways. By end use, it covers commercial, municipal infrastructure, residential, and industrial sites for project ownership review. By installation type, it covers new construction and retrofit or replacement for project planning and replacement decisions. By sales channel, it covers contractors, direct manufacturer routes, and building material dealers used in contractor sourcing. Regional coverage includes North America, Latin America, Europe, East Asia, South Asia and Pacific, and Middle East and Africa linked to construction aggregates demand.
How does new construction shape demand within the installation type category?
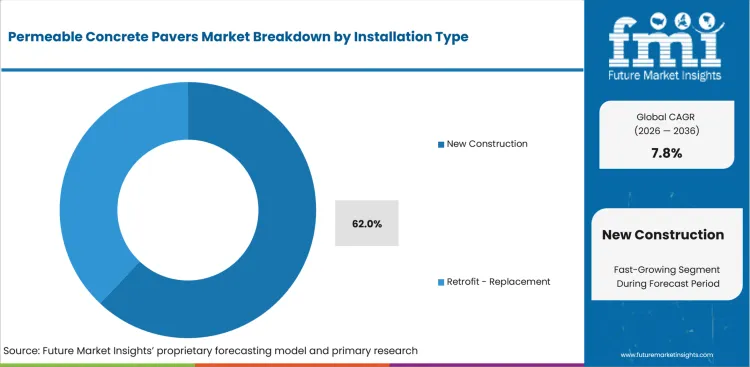
Site drainage decisions often enter the plan before pavement orders reach contractors on commercial and municipal projects. New construction projects give municipal engineers more control over base depth and surface slope. Early control helps permeable concrete pavers move into specifications before field crews request substitutions during installation planning.
- By installation type, new construction is projected to account for 62% share in 2026 driven by early drainage design and lower retrofit uncertainty. EPA's February 2026 green infrastructure page identifies permeable pavements as stormwater controls that reduce and treat runoff where it falls, which supports specification review before construction crews begin base preparation.
- New construction demand is expected to grow among developers owing to the need for drainage decisions inside site-plan review. Contractors comparing pavers equipment demand also need formats that install within scheduled hardscape windows, keep joint drainage clear and reduce later maintenance disputes between owners and field teams during final acceptance.
What supports direct manufacturer routes within the sales channel category?
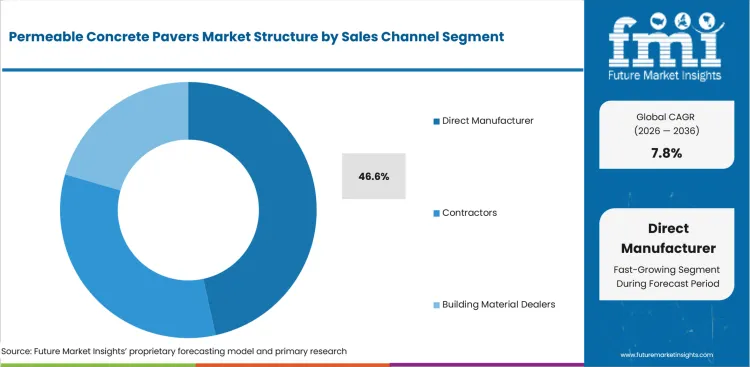
Channel control becomes visible once contractors ask who owns technical answers during installation and repeat ordering. Direct manufacturer routes reduce handoffs between quote review and field support during approval work and repeat project ordering. Project teams use those routes for clarification on colors, stock status and installation notes before approving recurring supply.
- By sales channel, direct manufacturer routes are estimated to hold 46.6% share in 2026 owing to specification control and fewer support handoffs. Oldcastle APG’s 2024 brand portfolio brochure identified Aqualine permeable pavers inside the Belgard range, which reinforces the value of product files during contractor review and municipal sign-off.
- Direct manufacturer routes are drawing attention from contractors shaped by the need for faster answers on batch availability and installation guidance. Building-material dealers remain useful in local replenishment, yet building materials demand shows why project teams still value manufacturer accountability for technical qualification. Color continuity and post-approval service ownership carry weight through closeout on repeat commercial projects.
How do interlocking concrete pavers influence product type selection?
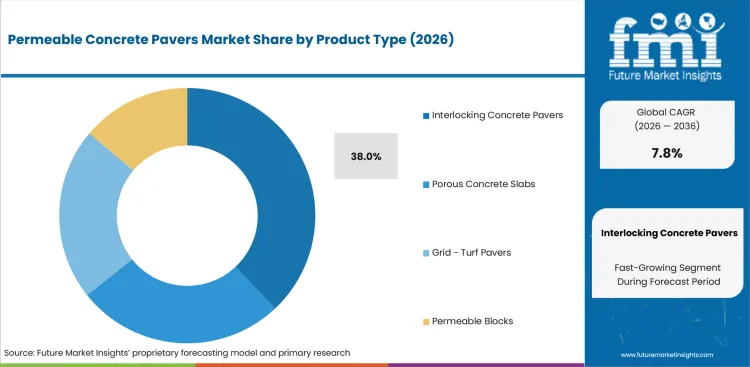
Interlocking units are reviewed as a pavement system instead of loose hardscape blocks during drainage specification work. Unilock’s September 2025 commercial specification identified permeable concrete pavers, joint aggregate and setting-bed aggregate as part of one section. The section structure mirrors how engineers evaluate base behavior and load transfer for load-bearing surfaces. Contractors also prefer formats that permit piece-by-piece replacement without breaking a full slab surface.
- Interlocking concrete pavers are forecast to represent 38% of product type demand in 2026 attributable to modular replacement and controlled joint drainage.
- Purchase activity for interlocking concrete pavers is anticipated to rise driven by maintenance access and segmental replacement needs. Contractors evaluating polymeric sand demand also consider joint behavior and sediment control before choosing a permeable paver system. Cleaning routines also influence parking-area, walkway and commercial hardscape decisions during formal handover reviews.
How do project teams evaluate commercial end use demand?
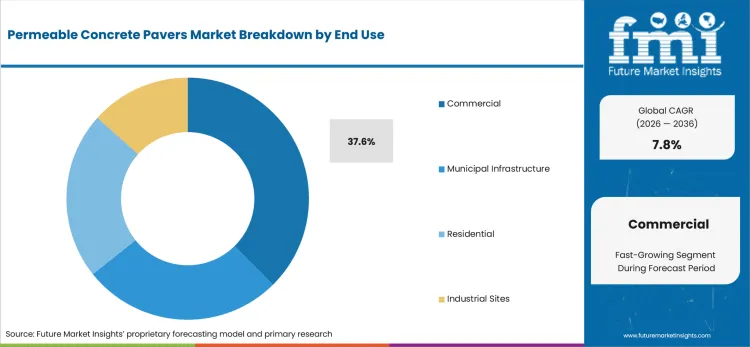
Commercial sites place drainage risk near parking operations and tenant access across parking and pedestrian surfaces. ONS reported in June 2026 that non-housing repair and maintenance grew 3.5% in the three months to April 2026. Repair activity supports paving products that reduce surface water and simplify localized replacement for occupied sites. Property managers still need documentation that connects the paver system to maintenance routines and liability exposure.
- Commercial end use is likely to capture 37.6% of end use demand in 2026 due to parking-area runoff and site maintenance needs.
- Sales of commercial permeable pavers are forecast to gain traction in retail and office sites reinforced by stormwater checks and tenant-access needs. Facility managers comparing asphalt pavers demand need products that keep paved areas serviceable during cleaning, repair and partial replacement work without disrupting parking or walkway access inside occupied properties.
What are the drivers, restraints, and opportunities in the Permeable Concrete Pavers Market?
Near-term purchases are being shaped by stormwater runoff rules and installation proof, alongside municipal retrofit access outlined below.
- Driver: Municipal drainage review is expected to push contractors toward permeable paver systems that combine surface finish and runoff control.
- Restraint: Adoption is anticipated to slow in projects that lack maintenance budgets and clear ownership for sediment control.
- Opportunity: Retrofit programs are projected to open account access for suppliers that package pavers, base guidance and cleaning instructions.
Municipal project teams are expected to raise interest in permeable concrete pavers where paved areas add runoff load to drains. The USA Department of Transportation issued a sustainable federal buildings policy in January 2025 that named permeable pavements among retrofit options for reducing stormwater runoff impacts. Policy language gives engineers a practical reason to request permeable surfaces during site repair or parking upgrades. Contractor selection then moves toward systems that include base design notes and maintenance guidance.
Budget pressure is likely to delay wider use where installation teams treat permeable pavers as ordinary blocks. The UK building materials commentary in May 2026 reported total construction output fell 2.0% in the three months to February 2026, which made project timing more cautious. Drainage benefits become harder to approve without lifecycle cost evidence and cleaning responsibility for municipal and property teams. Municipal accounts therefore require proof that sediment management stays manageable after installation inside routine maintenance planning.
Retrofit access is projected to convert cost hesitation into a specification route for hardscape producers. Unilock published commercial permeable paver cross sections in September 2025 that included base aggregate and underdrain details for design teams. Those files align with concrete paving equipment demand in projects that combine installation planning and maintenance records. Suppliers that package technical drawings with field training are expected to receive closer consideration in municipal and commercial accounts.
Which country CAGRs are profiled in the Permeable Concrete Pavers Market?
.webp "Top Country Growth Comparison Permeable Concrete Pavers Market Cagr (2026 2036)")
| Country | CAGR |
|---|---|
| United States | 6.9% |
| China | 9.1% |
| India | 10.1% |
| Germany | 6.5% |
| United Kingdom | 6.7% |
| Japan | 6.3% |
| South Korea | 7.67% |
Source: FMI's proprietary forecasting model and primary research
How do country-level CAGRs compare in the Permeable Concrete Pavers Market?
Country outlook separates infrastructure scale from specification discipline across the profiled forecast entries and regional procurement routes. India at 10.1% CAGR and China at 9.1% CAGR are estimated to form the higher-growth tier due to urban drainage work. South Korea at 7.7% CAGR are projected to reflect quicker channel formation. The United States at 6.9% CAGR and the United Kingdom at 6.7% CAGR are forecast to follow steady approval cycles. Germany at 6.5% CAGR and Japan at 6.3% CAGR are anticipated to rely on specification confidence and service continuity.
- Federal site guidance now treats permeable pavement as a runoff-reduction route for retrofit work on eligible federal facilities. United States demand is projected to grow at 6.9% CAGR through 2036 supported by public-site drainage upgrades and contractor qualification. The USA Census Bureau reported residential construction spending of USD 909.9 billion in April 2026. The housing base keeps driveway and walkway specifications visible beside municipal parking work and private development programs. Local stormwater rules push engineers to check sub-base details before moving permeable units into approved project specifications.
- Sponge-city work has made urban drainage a hardscape specification issue in dense Chinese districts. China’s permeable concrete pavers outlook is anticipated to advance at 9.1% CAGR over the assessment period driven by infrastructure investment and sponge-city project logic. National Bureau of Statistics of China reported fixed-asset investment of CNY 51,437.4 billion in 2024. The investment scale gives urban contractors a larger base for drainage-linked paving and public-space renewal.
- Urban missions are shifting drainage spending toward streetscape upgrades and waterlogging reduction in Indian cities. Permeable concrete pavers demand in India is forecast to rise at 10.1% CAGR over the forecast period attributable to AMRUT-linked drainage and streetscape work. Press Information Bureau reported AMRUT and AMRUT 2.0 projects worth about INR 2.79 lakh crore by June 2026. The sanctioned pipeline supports urban hardscape products that reduce waterlogging around parking and pedestrian areas.
- Civil engineering order books keep drainage surfaces tied to public works planning in Germany. Adoption of permeable concrete pavers in Germany is estimated to expand at 6.5% CAGR through 2036 owing to civil engineering order depth and strict specification review. Destatis placed the civil engineering stock-of-orders index at 157.0 in the first quarter of 2026. The order base supports infrastructure-related hardscape decisions even during weaker building activity and public works planning. German engineering offices still require product files that connect pavement behavior to drainage and maintenance.
- SuDS guidance keeps permeable paving inside planning conversations for UK commercial and public-space upgrade projects. The United Kingdom permeable concrete pavers sector is projected to record 6.7% CAGR during the assessment period reinforced by SuDS guidance and repair work. Office for National Statistics reported total construction output grew 1.6% in the three months to April 2026. Repair and maintenance activity helps permeable paving enter upgrades for commercial sites and public space. Planning teams also review SuDS standards before allowing surface water discharge routes in commercial and municipal applications.
- Enterprise land investment keeps paving choices linked to careful site planning in Japanese commercial districts. In Japan, permeable paver demand is predicted to advance at 6.3% CAGR through 2036 shaped by land investment planning and careful inspection routines. MLIT reported planned land investment by enterprises of JPY 3,775.8 billion for fiscal year 2025. The land investment plan keeps hardscape and site-preparation decisions tied to corporate real estate budgets. Local contractors still place high value on dimensional control and post-installation inspection records for dense project sites.
- Construction ordering rebounded sharply in South Korea during a period of dense urban project activity. South Korea is estimated to post 7.7% CAGR over the forecast period led by faster construction ordering and dense urban project cycles. Ministry of Data and Statistics recorded construction orders received rising 55.3% year on year in May 2026. The order rebound supports demand for hardscape products that fit fast approvals and local contractor networks. Compact cities also make drainage performance and field response visible soon after installation in public-space projects.
Who are the notable companies in the Permeable Concrete Pavers Market?
Oldcastle APG, Belgard, Unilock, Techo-Bloc, Pavestone, Hanover Architectural Products, Marshalls, Tobermore, Acker-Stone and Nicolock are the notable companies shaping thismarket
. 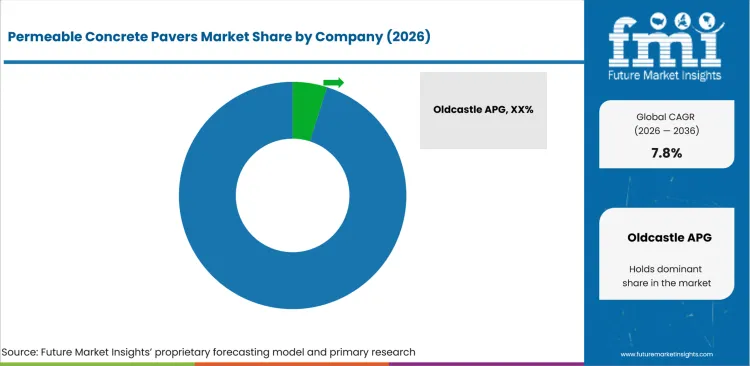
The competitive base is moderately fragmented due to regional manufacturing footprints and project-specific approval requirements. Established producers hold advantages in color range and dimensional consistency for contractor-led commercial projects. Smaller regional manufacturers compete where local delivery and field response outweigh national catalog breadth. Competition centers on specification support and surface finish consistency for drainage-sensitive paving projects and maintenance-sensitive commercial work. Project teams comparing protective building materials demand also apply similar screening to paving products that must defend performance after installation.
- Specification control gives Oldcastle APG and Belgard a clear role in permeable concrete paver selection. Contractors use these brands where regional manufacturing and broad paver ranges reduce ordering uncertainty. Their practical value lies in catalog support, dealer access and repeat project familiarity for commercial hardscape programs.
- Design education gives Unilock and Techo-Bloc a distinct route into contractor-led accounts before product selection. Unilock supports commercial design teams through permeable specifications and CEU resources for specification reviews. Techo-Bloc helps installers manage surface issues and maintenance questions before repeat ordering during homeowner handover. These roles reduce gaps between design intent and jobsite handling for contractors during approved project work.
- SuDS documentation separates Marshalls and Tobermore in UK-centered paving work during drainage approval reviews. Marshalls links Priora products to permeable drainage claims and pedestrian safety during project review. Tobermore provides Hydropave specification sheets and SuDS guidance for professional designers serving drainage-led projects. These companies fit projects requiring surface water arguments before final product selection in planning approvals.
- Regional project support gives Pavestone and Hanover Architectural Products clearer relevance in local hardscape accounts. Acker-Stone and Nicolock gain relevance where distributor proximity reduces response time during contractor scheduling. Pavestone and Hanover serve projects needing catalog breadth and design assistance for municipal sites. Acker-Stone and Nicolock fit accounts valuing shorter response loops during local delivery and replenishment planning.
Competitive Benchmarking: Permeable Concrete Pavers Market
| Company | Specification Fit | Installation Support | Channel Reach | Regional Service Fit |
|---|---|---|---|---|
| Oldcastle APG | High | Strong | Global | High |
| Belgard | High | Strong | Global | High |
| Unilock | High | Strong | Regional | High |
| Techo-Bloc | Medium | Strong | Regional | Medium |
| Pavestone | Medium | Medium | Regional | Medium |
| Hanover Architectural Products | High | Strong | Regional | High |
| Marshalls | High | Medium | Global | High |
| Tobermore | Strong | High | Regional | High |
| Acker-Stone | Medium | Medium | Regional | Strong |
| Nicolock | Medium | Medium | Regional | Strong |
Source: Future Market Insights competitive analysis, 2026. Ratings reflect relative portfolio relevance and workflow fit. Service capability and geographic reach shape the remaining comparison.
Key Developments in the Permeable Concrete Pavers Market
- In 2026, Techo-Bloc featured Saint-Oxford, Mika, and Pure pavers in its 2026 Landscape Catalog. Saint-Oxford combines brick-cobblestone styling with permeable design and stain resistance. Mika and Pure also extend the company’s permeable concrete paver portfolio for driveways and outdoor hardscape projects.
- In October 2025, Unilock released its Commercial Paver Name Transition Guide for 2026. The guide reorganized commercial paver naming by product finish and retained several permeable concrete paver formats, including Eco-Hex, Eco-Optiloc, Eco-Priora, and modular permeable sizes.
- In October 2024, wienerberger acquired Betonarna Lesonice s.r.o., a Czech concrete pavement manufacturer. The acquisition increased wienerberger’s concrete paver production capacity in Czechia and strengthened its position in infrastructure and residential paving applications..
Key Players in the Permeable Concrete Pavers Market
North American concrete paver producers
- Oldcastle APG
- Belgard
- Unilock
- Techo-Bloc
- Pavestone
- Hanover Architectural Products
- Acker-Stone
- Nicolock
European permeable paving suppliers
- Marshalls
- Tobermore
Permeable Concrete Pavers Market - Report Scope
| Coverage field | Report scope |
|---|---|
| Market breakdown | Permeable Concrete Pavers Market Breakdown By Product Type, Application, End Use, Installation Type, Sales Channel, and Region |
| Market Definition | Permeable concrete pavers are interlocking or modular concrete paving units that allow stormwater to pass into joint aggregate and base layers for contractors, municipal engineers and developers. |
| Regions Covered | North America, Latin America, Europe, East Asia, South Asia and Pacific, Middle East and Africa |
| Countries Covered | United States, China, India, Germany, United Kingdom, Japan, South Korea and 30+ countries |
| Key Companies Profiled | Oldcastle APG, Belgard, Unilock, Techo-Bloc, Pavestone, Hanover Architectural Products, Marshalls, Tobermore, Acker-Stone and Nicolock |
| Forecast Period | 2026 to 2036 |
| Approach | Hybrid bottom-up and top-down methodology using installation type shares, project use cases, country drainage spending, supplier portfolio depth and channel access. |
Source: Future Market Insights - analysis driven by proprietary forecasting models and primary research
Permeable Concrete Pavers Market - Research Methodology
| Method | Approach |
|---|---|
| Primary Research | FMI analysts gathered input from manufacturers, service providers, technology developers, distributors, end users, procurement teams, and subject-matter experts. Interviews examined purchasing decisions, product or service evaluation, adoption barriers, approval requirements, pricing considerations, and expectations for technical or commercial support. Respondents were also asked what evidence is required before a trial, pilot, or initial order develops into regular purchasing. |
| Desk Research | Desk research covered government statistics, regulatory publications, trade data, industry associations, technical literature, standards, company filings, product information, and official corporate announcements. Sources were reviewed for relevance, publication date, geographic coverage, and consistency with the defined market scope. Claims relating to performance, applications, approvals, capacity, investment, and commercial activity were retained only when supported by credible public evidence. |
| Market Sizing and Forecasting | The market model combined the baseline value with historical performance, segment structure, pricing and volume indicators, adoption levels, company participation, and country-level demand conditions. Forecast assumptions considered economic activity, investment trends, regulatory developments, technology adoption, purchasing cycles, supply availability, and barriers to wider market use. Segment and regional estimates were reconciled before the final market total was calculated. |
| Data Validation | Estimates were checked against multiple independent indicators, including public data, company activity, trade patterns, industry developments, and findings from primary interviews. Validation also tested whether products, services, applications, and company revenues fell within the defined market boundaries. Adjacent categories, unsupported claims, overlapping revenues, and activities without direct market relevance were excluded to reduce double counting and maintain consistency across segments and countries. |
Permeable Concrete Pavers Market by Segments
Permeable Concrete Pavers Market segmented by Product Type:
- Interlocking Concrete Pavers
- Porous Concrete Slabs
- Grid / Turf Pavers
- Permeable Blocks
Permeable Concrete Pavers Market segmented by Application:
- Parking Lots
- Walkways / Plazas
- Road Shoulders
- Residential Driveways
Permeable Concrete Pavers Market segmented by End Use:
- Commercial
- Municipal Infrastructure
- Residential
- Industrial Sites
Permeable Concrete Pavers Market segmented by Installation Type:
- New Construction
- Retrofit / Replacement
Permeable Concrete Pavers Market segmented by Sales Channel:
- Contractors
- Direct Manufacturer
- Building Material Dealers
Permeable Concrete Pavers Market by Region:
- North America
- United States
- Canada
- Latin America
- Brazil
- Mexico
- Europe
- Germany
- United Kingdom
- France
- Italy
- Spain
- East Asia
- China
- Japan
- South Korea
- South Asia and Pacific
- India
- Australia
- ASEAN
- Middle East and Africa
- GCC Countries
- South Africa
Research Sources and Bibliography
- USA Census Bureau. (2026, June). Monthly Construction Spending, April 2026. USA Census Bureau.
- USA Environmental Protection Agency. (2026, February). Green Infrastructure. USA Environmental Protection Agency.
- USA Department of Transportation. (2025, January). Sustainable Federal Buildings Policy. USA Department of Transportation.
- USA Department of Transportation. (2025, December). FY 2026 Notice of Funding Opportunity. USA Department of Transportation.
- National Bureau of Statistics of China. (2025, January). National Economy Witnessed Steady Progress amidst Stability in 2024. National Bureau of Statistics of China.
- Press Information Bureau. (2026, June). Infrastructure at the Core of India’s Development. Government of India.
- Federal Statistical Office. (2026, June). Short-term indicators Construction and housing. Destatis.
- Office for National Statistics. (2026, June). Construction output in Great Britain: April 2026. Office for National Statistics.
- Ministry of Land, Infrastructure, Transport and Tourism. (2025, September). Fiscal Year 2024 Trends Concerning Land. Government of Japan.
- Ministry of Data and Statistics. (2026, June). Monthly Industrial Statistics in May 2026. Republic of Korea.
- World Bank. (2026, April). Cities Under Water: Charting a Resilient Future in an Urbanizing World. World Bank.
- Oldcastle APG. (2024, September). The Strength of Oldcastle APG. Oldcastle APG.
- Unilock. (2025, March). Continuing Education. Unilock.
- Unilock. (2025, September). 32 14 13.19 Unilock Permeable. Unilock.
- Techo-Bloc. (2025, April). 3 Common Problems and Solutions for Concrete Paving Stones. Techo-Bloc.
- Marshalls. (2025, May). Conservation X Priora Paving 600 x 400 x 65. Marshalls.
- Tobermore. (2025, December). How to specify the correct permeable paving system for your project. Tobermore.
- Techo-Bloc. (2026). Landscape catalog | Collection of pavers, slabs & outdoor products. Techo-Bloc.
- Unilock. (2025, October). Commercial paver name transition guide. Unilock Commercial.
- wienerberger. (2024, October 15). wienerberger acquires Czech concrete pavers manufacturer to meet growing demand and strengthen local value-creation. wienerberger.
- Hanover Architectural Products. (2024, November). Product Spotlight. Hanover Architectural Products.
The bibliography is provided for reader reference and uses primary government and standards-body sources. It also uses official trade body and company sources.
This Report Answers
- What value is forecast for the permeable concrete pavers market in 2026 and by 2036?
- What CAGR is forecast for the permeable concrete pavers market during the 2026 to 2036 period?
- Which segments shape demand across product type and installation type, including end use and sales channel?
- Which stormwater and project execution pressures support purchase activity for permeable concrete pavers?
- How do country CAGRs differ across the profiled permeable concrete pavers markets?
- Which companies compete across specification support, channel reach and regional service fit?
- How does FMI validate forecasts using hybrid bottom-up and top-down methodology?
- What factors should contractors and municipal engineers address before broader sourcing commitment?
- How does documentation review affect supplier selection for permeable paver systems?
Frequently Asked Questions
What is driving growth in the Permeable Concrete Pavers Market?
Growth is being driven by stormwater approval needs and demand for hardscape systems that manage runoff. Municipal engineers and developers are using permeable units to reduce approval friction.
Who are the key players in the Permeable Concrete Pavers Market?
Key players include Oldcastle APG and Belgard; Unilock; Marshalls and Tobermore; Acker-Stone and Nicolock. Competition centers on regional manufacturing, specification files and jobsite support.
What is a significant restraint in the Permeable Concrete Pavers Market?
A significant restraint is unclear maintenance ownership after installation. Adoption slows when projects lack sediment-control budgets, base-design proof and cleaning responsibility.
Why should executives track the permeable concrete pavers market?
Executives should track this market due to its link to stormwater approval and site maintenance budgets. The category shows how drainage rules are entering hardscape sourcing decisions for commercial and municipal projects.
What business problem does the permeable concrete pavers market address?
The market addresses runoff control on paved surfaces that still need traffic or pedestrian use. Contractors use the product to combine surface finish, infiltration and modular repair access during site upgrades.
What should procurement leaders evaluate before selecting suppliers?
Procurement leaders should evaluate base design guidance, joint aggregate specifications and local inventory support. Supplier evidence should connect product selection to installation control, maintenance ownership and inspection readiness.
What limits return on investment for project teams?
Return on investment is constrained by weak sub-base design and unclear cleaning responsibility. Project teams reduce that risk by setting acceptance criteria and maintenance ownership before installation begins.
How do suppliers build long-term account confidence?
Suppliers build confidence by providing specification files, installation diagrams and maintenance guidance for sediment control. Local stock and accountable field support help convert initial approvals into repeat project orders.
Preview the report firsthand - request a free sample
Get SampleGet the brochure for pricing and purchase details.
Get PDFTable of Content
- Key Takeaways
- Market Size and CAGR
- Top Growth Driver
- Fastest Growing Segment
- Leading Region
- Key Companies
- Emerging Opportunities
- Executive Summary
- Global Market Outlook
- Demand-side Trends
- Supply-side Trends
- Technology Roadmap Analysis
- Analysis and Recommendations
- Analyst Perspective (What is happening? Why now? What should investors know?)
- Key Questions Answered
- How large is the market?
- What is the CAGR?
- What are key trends?
- Which region dominates?
- Who are the leaders?
- Market Overview
- Market Coverage / Taxonomy
- Market Definition / Scope / Limitations
- Research Methodology
- Chapter Orientation
- Analytical Lens and Working Hypotheses
- Market Structure, Signals, and Trend Drivers
- Benchmarking and Cross-market Comparability
- Market Sizing, Forecasting, and Opportunity Mapping
- Research Design and Evidence Framework
- Desk Research Programme (Secondary Evidence)
- Expert Input and Fieldwork (Primary Evidence)
- Tooling, Models, and Reference Databases
- Data Engineering and Model Build
- Quality Assurance and Audit Trail
- Market Background
- Market Dynamics (Drivers, Restraints, Opportunity, Trends)
- Scenario Forecast (Optimistic, Likely, Conservative)
- Impact Analysis
- AI Impact
- Sustainability Impact
- Regulatory Impact
- Technology Impact
- Consumer / Buyer Analysis
- Purchase Drivers
- Adoption Barriers
- Buyer Journey
- Opportunity Map Analysis
- Product Life Cycle Analysis
- Supply Chain Analysis
- Investment Feasibility Matrix
- Value Chain Analysis
- PESTLE and Porter's Analysis
- Regulatory Landscape
- Regional Parent Market Outlook
- Production and Consumption Statistics
- Import and Export Statistics
- Global Market Analysis and Forecast, 2021 to 2036
- Historical Market Size Value (USD Million) & Volume (Unit) Analysis, 2021 to 2025
- Current and Future Market Size Value (USD Million) & Volume (Unit) Projections, 2026 to 2036
- Y-o-Y Growth Trend Analysis
- Absolute $ Opportunity Analysis
- Global Market Pricing Analysis, 2021 to 2036
- Global Market Analysis and Forecast, By Product Type, 2021 to 2036
- Introduction / Key Findings
- Historical Market Size Value (USD Million) & Volume (Unit) Analysis By Product Type, 2021 to 2025
- Current and Future Market Size Value (USD Million) & Volume (Unit) Analysis and Forecast By Product Type, 2026 to 2036
- Interlocking Concrete Pavers
- Porous Concrete Slabs
- Grid - Turf Pavers
- Permeable Blocks
- Interlocking Concrete Pavers
- Y-o-Y Growth Trend Analysis By Product Type, 2021 to 2025
- Absolute $ Opportunity Analysis By Product Type, 2026 to 2036
- Global Market Analysis and Forecast, By Application, 2021 to 2036
- Introduction / Key Findings
- Historical Market Size Value (USD Million) & Volume (Unit) Analysis By Application, 2021 to 2025
- Current and Future Market Size Value (USD Million) & Volume (Unit) Analysis and Forecast By Application, 2026 to 2036
- Parking Lots
- Walkways - Plazas
- Road Shoulders
- Residential Driveways
- Parking Lots
- Y-o-Y Growth Trend Analysis By Application, 2021 to 2025
- Absolute $ Opportunity Analysis By Application, 2026 to 2036
- Global Market Analysis and Forecast, By End Use, 2021 to 2036
- Introduction / Key Findings
- Historical Market Size Value (USD Million) & Volume (Unit) Analysis By End Use, 2021 to 2025
- Current and Future Market Size Value (USD Million) & Volume (Unit) Analysis and Forecast By End Use, 2026 to 2036
- Commercial
- Municipal Infrastructure
- Residential
- Industrial Sites
- Commercial
- Y-o-Y Growth Trend Analysis By End Use, 2021 to 2025
- Absolute $ Opportunity Analysis By End Use, 2026 to 2036
- Global Market Analysis and Forecast, By Installation Type, 2021 to 2036
- Introduction / Key Findings
- Historical Market Size Value (USD Million) & Volume (Unit) Analysis By Installation Type, 2021 to 2025
- Current and Future Market Size Value (USD Million) & Volume (Unit) Analysis and Forecast By Installation Type, 2026 to 2036
- New Construction
- Retrofit - Replacement
- New Construction
- Y-o-Y Growth Trend Analysis By Installation Type, 2021 to 2025
- Absolute $ Opportunity Analysis By Installation Type, 2026 to 2036
- Global Market Analysis and Forecast, By Sales Channel, 2021 to 2036
- Introduction / Key Findings
- Historical Market Size Value (USD Million) & Volume (Unit) Analysis By Sales Channel, 2021 to 2025
- Current and Future Market Size Value (USD Million) & Volume (Unit) Analysis and Forecast By Sales Channel, 2026 to 2036
- Direct Manufacturer
- Contractors
- Building Material Dealers
- Direct Manufacturer
- Y-o-Y Growth Trend Analysis By Sales Channel, 2021 to 2025
- Absolute $ Opportunity Analysis By Sales Channel, 2026 to 2036
- Global Market Analysis and Forecast, By Region, 2021 to 2036
- Introduction
- Historical Market Size Value (USD Million) & Volume (Unit) Analysis By Region, 2021 to 2025
- Current Market Size Value (USD Million) & Volume (Unit) Analysis and Forecast By Region, 2026 to 2036
- North America
- Latin America
- Western Europe
- Eastern Europe
- East Asia
- South Asia and Pacific
- Middle East & Africa
- Market Attractiveness Analysis By Region
- North America Market Analysis and Forecast, By Country, 2021 to 2036
- Historical Market Size Value (USD Million) & Volume (Unit) Trend Analysis By Market Taxonomy, 2021 to 2025
- Market Size Value (USD Million) & Volume (Unit) Forecast By Market Taxonomy, 2026 to 2036
- By Country
- USA
- Canada
- Mexico
- By Product Type
- By Application
- By End Use
- By Installation Type
- By Sales Channel
- By Country
- Market Attractiveness Analysis
- By Country
- By Product Type
- By Application
- By End Use
- By Installation Type
- By Sales Channel
- Key Takeaways
- Latin America Market Analysis and Forecast, By Country
- Historical Market Size Value (USD Million) & Volume (Unit) Trend Analysis By Market Taxonomy, 2021 to 2025
- Market Size Value (USD Million) & Volume (Unit) Forecast By Market Taxonomy, 2026 to 2036
- By Country
- Brazil
- Chile
- Rest of Latin America
- By Product Type
- By Application
- By End Use
- By Installation Type
- By Sales Channel
- By Country
- Market Attractiveness Analysis
- By Country
- By Product Type
- By Application
- By End Use
- By Installation Type
- By Sales Channel
- Key Takeaways
- Western Europe Market Analysis and Forecast, By Country
- Historical Market Size Value (USD Million) & Volume (Unit) Trend Analysis By Market Taxonomy, 2021 to 2025
- Market Size Value (USD Million) & Volume (Unit) Forecast By Market Taxonomy, 2026 to 2036
- By Country
- Germany
- UK
- Italy
- Spain
- France
- Nordic
- BENELUX
- Rest of Western Europe
- By Product Type
- By Application
- By End Use
- By Installation Type
- By Sales Channel
- By Country
- Market Attractiveness Analysis
- By Country
- By Product Type
- By Application
- By End Use
- By Installation Type
- By Sales Channel
- Key Takeaways
- Eastern Europe Market Analysis and Forecast, By Country
- Historical Market Size Value (USD Million) & Volume (Unit) Trend Analysis By Market Taxonomy, 2021 to 2025
- Market Size Value (USD Million) & Volume (Unit) Forecast By Market Taxonomy, 2026 to 2036
- By Country
- Russia
- Poland
- Hungary
- Balkan & Baltic
- Rest of Eastern Europe
- By Product Type
- By Application
- By End Use
- By Installation Type
- By Sales Channel
- By Country
- Market Attractiveness Analysis
- By Country
- By Product Type
- By Application
- By End Use
- By Installation Type
- By Sales Channel
- Key Takeaways
- East Asia Market Analysis and Forecast, By Country
- Historical Market Size Value (USD Million) & Volume (Unit) Trend Analysis By Market Taxonomy, 2021 to 2025
- Market Size Value (USD Million) & Volume (Unit) Forecast By Market Taxonomy, 2026 to 2036
- By Country
- China
- Japan
- South Korea
- By Product Type
- By Application
- By End Use
- By Installation Type
- By Sales Channel
- By Country
- Market Attractiveness Analysis
- By Country
- By Product Type
- By Application
- By End Use
- By Installation Type
- By Sales Channel
- Key Takeaways
- South Asia and Pacific Market Analysis and Forecast, By Country
- Historical Market Size Value (USD Million) & Volume (Unit) Trend Analysis By Market Taxonomy, 2021 to 2025
- Market Size Value (USD Million) & Volume (Unit) Forecast By Market Taxonomy, 2026 to 2036
- By Country
- India
- ASEAN
- Australia & New Zealand
- Rest of South Asia and Pacific
- By Product Type
- By Application
- By End Use
- By Installation Type
- By Sales Channel
- By Country
- Market Attractiveness Analysis
- By Country
- By Product Type
- By Application
- By End Use
- By Installation Type
- By Sales Channel
- Key Takeaways
- Middle East & Africa Market Analysis and Forecast, By Country
- Historical Market Size Value (USD Million) & Volume (Unit) Trend Analysis By Market Taxonomy, 2021 to 2025
- Market Size Value (USD Million) & Volume (Unit) Forecast By Market Taxonomy, 2026 to 2036
- By Country
- Kingdom of Saudi Arabia
- Other GCC Countries
- Türkiye
- South Africa
- Other African Union
- Rest of Middle East & Africa
- By Product Type
- By Application
- By End Use
- By Installation Type
- By Sales Channel
- By Country
- Market Attractiveness Analysis
- By Country
- By Product Type
- By Application
- By End Use
- By Installation Type
- By Sales Channel
- Key Takeaways
- Key Countries Market Analysis
- USA
- Pricing Analysis
- Market Share Analysis, 2025
- By Product Type
- By Application
- By End Use
- By Installation Type
- By Sales Channel
- Canada
- Pricing Analysis
- Market Share Analysis, 2025
- By Product Type
- By Application
- By End Use
- By Installation Type
- By Sales Channel
- Mexico
- Pricing Analysis
- Market Share Analysis, 2025
- By Product Type
- By Application
- By End Use
- By Installation Type
- By Sales Channel
- Brazil
- Pricing Analysis
- Market Share Analysis, 2025
- By Product Type
- By Application
- By End Use
- By Installation Type
- By Sales Channel
- Chile
- Pricing Analysis
- Market Share Analysis, 2025
- By Product Type
- By Application
- By End Use
- By Installation Type
- By Sales Channel
- Germany
- Pricing Analysis
- Market Share Analysis, 2025
- By Product Type
- By Application
- By End Use
- By Installation Type
- By Sales Channel
- UK
- Pricing Analysis
- Market Share Analysis, 2025
- By Product Type
- By Application
- By End Use
- By Installation Type
- By Sales Channel
- Italy
- Pricing Analysis
- Market Share Analysis, 2025
- By Product Type
- By Application
- By End Use
- By Installation Type
- By Sales Channel
- Spain
- Pricing Analysis
- Market Share Analysis, 2025
- By Product Type
- By Application
- By End Use
- By Installation Type
- By Sales Channel
- France
- Pricing Analysis
- Market Share Analysis, 2025
- By Product Type
- By Application
- By End Use
- By Installation Type
- By Sales Channel
- India
- Pricing Analysis
- Market Share Analysis, 2025
- By Product Type
- By Application
- By End Use
- By Installation Type
- By Sales Channel
- ASEAN
- Pricing Analysis
- Market Share Analysis, 2025
- By Product Type
- By Application
- By End Use
- By Installation Type
- By Sales Channel
- Australia & New Zealand
- Pricing Analysis
- Market Share Analysis, 2025
- By Product Type
- By Application
- By End Use
- By Installation Type
- By Sales Channel
- China
- Pricing Analysis
- Market Share Analysis, 2025
- By Product Type
- By Application
- By End Use
- By Installation Type
- By Sales Channel
- Japan
- Pricing Analysis
- Market Share Analysis, 2025
- By Product Type
- By Application
- By End Use
- By Installation Type
- By Sales Channel
- South Korea
- Pricing Analysis
- Market Share Analysis, 2025
- By Product Type
- By Application
- By End Use
- By Installation Type
- By Sales Channel
- Russia
- Pricing Analysis
- Market Share Analysis, 2025
- By Product Type
- By Application
- By End Use
- By Installation Type
- By Sales Channel
- Poland
- Pricing Analysis
- Market Share Analysis, 2025
- By Product Type
- By Application
- By End Use
- By Installation Type
- By Sales Channel
- Hungary
- Pricing Analysis
- Market Share Analysis, 2025
- By Product Type
- By Application
- By End Use
- By Installation Type
- By Sales Channel
- Kingdom of Saudi Arabia
- Pricing Analysis
- Market Share Analysis, 2025
- By Product Type
- By Application
- By End Use
- By Installation Type
- By Sales Channel
- Türkiye
- Pricing Analysis
- Market Share Analysis, 2025
- By Product Type
- By Application
- By End Use
- By Installation Type
- By Sales Channel
- South Africa
- Pricing Analysis
- Market Share Analysis, 2025
- By Product Type
- By Application
- By End Use
- By Installation Type
- By Sales Channel
- USA
- Market Structure Analysis
- Competition Dashboard
- Competition Benchmarking
- Market Share Analysis of Top Players
- By Regional
- By Product Type
- By Application
- By End Use
- By Installation Type
- By Sales Channel
- Emerging Startups
- Innovation Benchmarking
- Competition Analysis
- Competition Deep Dive
- Oldcastle APG
- Overview
- Product Portfolio
- Profitability by Market Segments (Product/Region/Sales Channel)
- Sales Footprint
- Strategy Overview
- Marketing Strategy
- Product Strategy
- Channel Strategy
- Belgard
- Unilock
- Techo-Bloc
- Pavestone
- Hanover Architectural Products
- Marshalls
- Tobermore
- Acker-Stone
- Nicolock
- Oldcastle APG
- Case Studies
- Success Stories
- Recent Developments
- Competition Deep Dive
- Assumptions & Acronyms Used


