Pill Pressing Machine Market Size and Share Forecast Outlook 2025 to 2035

The pill pressing machine market is expected to grow from USD 2.8 billion in 2025 to USD 4.6 billion by 2035, resulting in a total increase of USD 1.8 billion over the forecast decade. This represents a 64.3% total expansion, with the market advancing at a compound annual growth rate (CAGR) of 5.1%. Over ten years, the market grows by a 1.6 multiple.
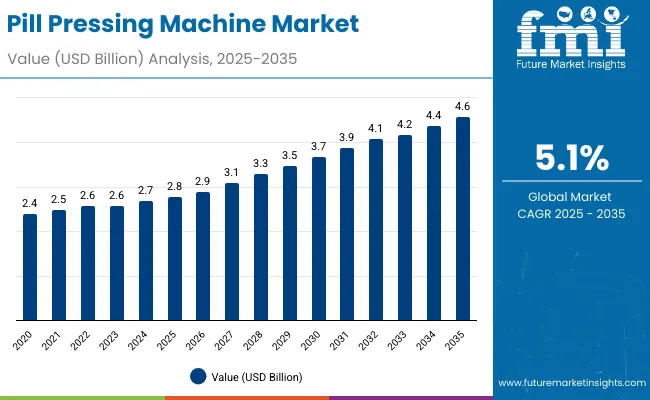
Quick Stats for Pill Pressing Machine Market

  • Market Value (2025): USD 2.8 billion
  • Market Forecast Value (2035): USD 4.6 billion
  • Market Forecast CAGR: 5.1%
  • Leading Segment in 2025: Fully automatic pill press machines (44.5%)
  • Key Growth Regions: Asia-Pacific (China is the fastest-growing market with 5.6% CAGR)
  • Top Key Players: Fette Compacting, KORSCH AG, I.M.A. Industria Macchine Automatiche S.p.A., Syntegon Technology GmbH, Romaco Group, Natoli Engineering, Grand Group, SaintyCo, Fluid Pack, Lodha International LLP

Pill Pressing Machine Market

Metric Value
Pill Pressing Machine Market Estimated Value in (2025 E) USD 2.8 billion
Pill Pressing Machine Market Forecast Value in (2035 F) USD 4.6 billion
Forecast CAGR (2025 to 2035) 5.1%

In the first five years (2025-2030), the market progresses from USD 2.8 billion to USD 3.6 billion, contributing USD 0.8 billion, or 44.4% of total decade growth. This phase is shaped by rising pharmaceutical output, particularly in generics, nutraceuticals, and dietary supplements. Demand for high-speed, GMP-compliant equipment drives early adoption across Asia-Pacific and North America.

In the second half (2030-2035), the market grows from USD 3.6 billion to USD 4.6 billion, adding USD 1.0 billion, or 55.6% of the total growth. This acceleration is supported by smart automation, IoT-enabled monitoring, and flexible tooling for diverse pill formats. Increasing investments in precision medicine and global health infrastructure solidify pill pressing machines as a core component of pharmaceutical manufacturing capacity.

From 2020 to 2024, the pill pressing machine market grew from USD 2.2 billion to USD 2.6 billion, fueled by pharmaceutical and nutraceutical expansion where precision, speed, and regulatory compliance were critical. Nearly 70% of revenue was dominated by OEMs offering rotary and high-speed tablet presses. Leaders such as Fette Compacting, KORSCH AG, and Romaco emphasized automation, multi-layer tablet production, and GMP-certified hygienic designs.

Differentiation focused on compression force control, output efficiency, and digital monitoring, while AI-enabled predictive analytics remained secondary. Service-driven offerings such as machine validation and operator training contributed less than 18% of revenue, with capital-focused purchases leading investments.

By 2035, the pill pressing machine market will reach USD 4.6 billion, growing at a CAGR of 5.10%, with smart-enabled and software-driven presses representing more than 40% of market value. Competition will intensify as solution providers introduce AI-powered defect detection, real-time quality control, and IoT-enabled maintenance. Established players are pivoting toward hybrid models that pair physical machines with SaaS-based optimization platforms. Emerging entrants such as Cadmach Machinery, Syntegon Technology, and IMA Group are expanding share by offering energy-efficient presses, modular tooling systems, and flexible designs tailored for growing demand in pharmaceuticals, nutraceuticals, and personalized medicine.

Why is the Pill Pressing Machine Market growing?

The growing pharmaceutical and nutraceutical production worldwide is driving growth in the pill pressing machine market. These machines ensure high precision, consistency, and scalability in tablet manufacturing, meeting the rising demand for medicines and dietary supplements. Stricter regulatory standards and expanding healthcare access further support adoption across global markets.

Advanced pill pressing machines featuring high-speed automation, multi-layer compression, and real-time monitoring are gaining popularity for their ability to enhance productivity and reduce errors. Their adaptability to varied formulations, including controlled release tablets, expands their use in complex drug development. Energy-efficient designs and compliance with GMP standards reinforce their importance in modern pharmaceutical manufacturing.

Segmental Analysis

The market is segmented by machine type, automation level, capacity, application, end-use industry, and region. Machine type segmentation includes rotary pill press machines and multi-station press machines, delivering efficiency and consistency in tablet manufacturing. Automation level covers manual, semi-automatic, and fully automatic pill press machines, offering flexibility for varying production requirements. Capacity segmentation includes low capacity (up to 50,000 tablets/hour), medium capacity (50,001-200,000 tablets/hour), and high capacity (above 200,000 tablets/hour), supporting scalability.

Applications span pharmaceutical tablet production, nutraceuticals and dietary supplements, veterinary medicine tablets, and industrial and specialty chemicals, meeting broad sector needs. End-use industries include pharmaceutical manufacturers, nutraceutical companies, research and development laboratories, veterinary healthcare producers, and contract manufacturing organizations (CMOs). Regionally, the market is segmented into North America, Europe, Asia-Pacific, Latin America, and the Middle East & Africa.
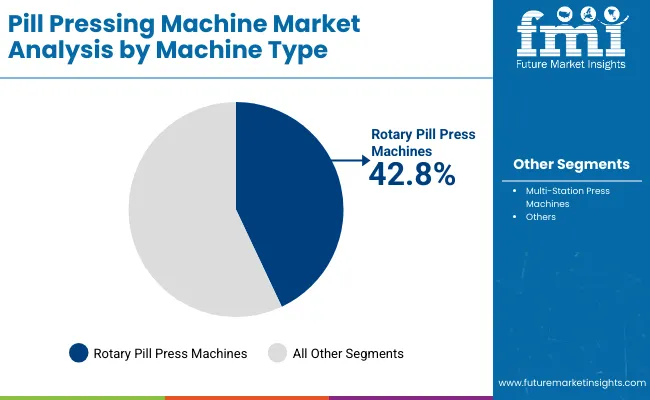
Rotary Pill Press Machines Dominate with High Speed and Precision

Pill Pressing Machine Market By Machine Type

Rotary pill press machines are forecast to account for 42.8% of the market in 2025, owing to their ability to produce tablets at high speeds with consistent quality. They support multi-layered and shaped tablets, making them suitable for complex pharmaceutical and nutraceutical formulations. Their durability and scalability make them standard in large-scale production facilities.

Adoption is supported by rising global drug demand and continuous innovation in tablet formulations. Rotary presses provide flexibility for small to mass production, reducing changeover time and enhancing operational efficiency. Their precision ensures compliance with strict pharmaceutical standards, reinforcing their market leadership.
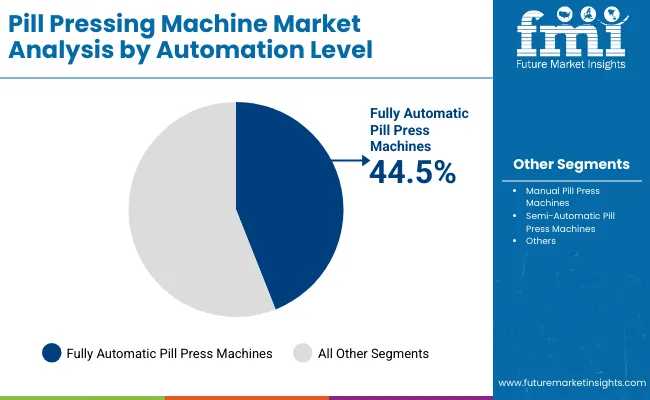
Fully Automatic Systems Lead with Efficiency and Reduced Labor Costs

Pill Pressing Machine Market By Automation Level

Fully automatic pill press machines are projected to hold 44.5% of the market in 2025, reflecting demand for high-throughput, continuous production. These machines integrate advanced controls, touch-screen interfaces, and automated monitoring systems to minimize human intervention. Their real-time data collection enhances quality assurance and process optimization.

Manufacturers prefer fully automated systems for their consistency, scalability, and ability to reduce operating costs. Integration with Industry 4.0 technologies, such as predictive maintenance and IoT connectivity, further supports adoption. As compliance and efficiency remain priorities, automation leads as the standard in modern pill pressing operations.
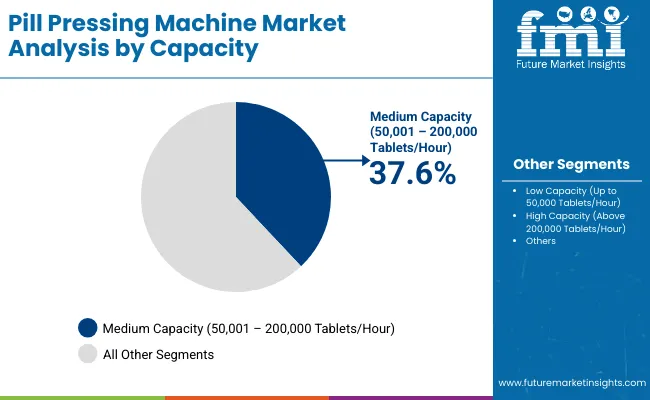
Medium Capacity Machines Dominate with Versatile Production Capabilities

Pill Pressing Machine Market By Capacity

Medium capacity machines, producing 50,001-200,000 tablets per hour, are forecast to account for 37.6% of the market in 2025. These machines balance throughput with flexibility, serving both mid-sized pharmaceutical companies and large-scale nutraceutical producers. Their adaptability across multiple formulations supports varied production needs.

Adoption is growing in facilities requiring frequent product changeovers or seasonal production spikes. Medium capacity machines provide cost efficiency while maintaining compliance with regulatory requirements. Their scalability makes them an attractive option for expanding manufacturers in emerging markets.
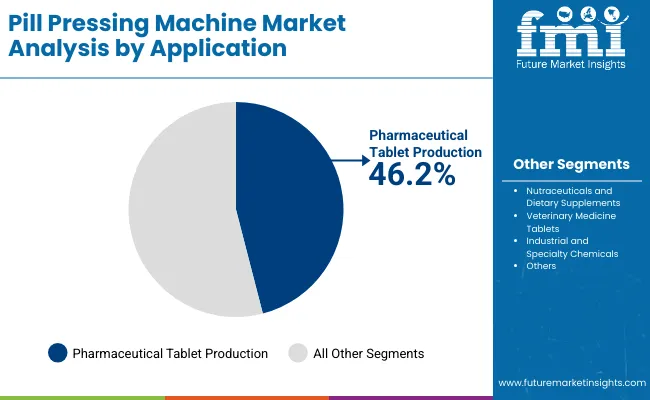
Pharmaceutical Tablet Production Leads Applications with Highest Demand

Pill Pressing Machine Market By Application

Pharmaceutical tablet production is expected to represent 46.2% of the market in 2025, as rising chronic disease prevalence and global healthcare demand drive large-scale tablet manufacturing. Pill pressing machines ensure consistent dosage, hardness, and disintegration profiles critical for patient safety.

Adoption is reinforced by increasing investments in generics and specialty drugs. Manufacturers rely on these machines for flexibility in producing coated, uncoated, and multi-layered tablets. As regulatory scrutiny intensifies, precision and validation features of pill pressing equipment remain essential.
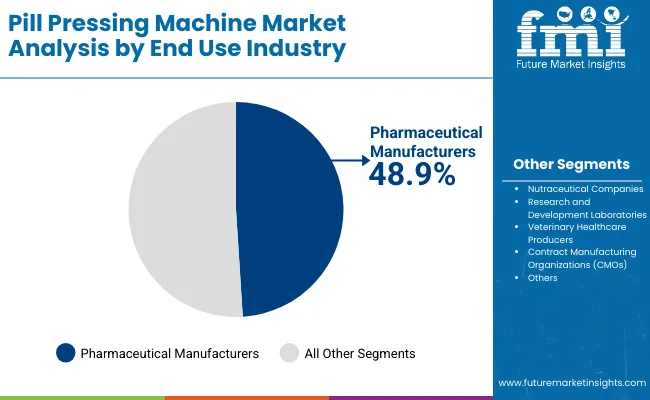
Pharmaceutical Manufacturers Dominate End-Use with Large-Scale Production

Pill Pressing Machine Market By End Use Industry

Pharmaceutical manufacturers are projected to account for 48.9% of the market in 2025, reflecting their central role in global medicine production. These firms require machines capable of meeting stringent quality, safety, and output standards. High demand for generics and patented drugs sustains adoption at scale.

Automation and digital integration further enhance efficiency, ensuring compliance with Good Manufacturing Practices (GMP). Partnerships with equipment providers enable customized solutions for complex formulations. As healthcare spending and drug consumption rise worldwide, pharmaceutical manufacturers remain the core end-users of pill pressing machines.

What are the Drivers, Restraints, and Key Trends of the Pill Pressing Machine Market?

The pill pressing machine market is expanding as demand rises in pharmaceuticals, nutraceuticals, and dietary supplements for efficient, high-capacity tablet production. Growth is supported by rising chronic disease prevalence, increased generic drug manufacturing, and consumer health trends. However, high capital costs and stringent regulatory compliance limit adoption. Advances in automation, multi-layer pressing, and continuous manufacturing are shaping the market’s future direction.

High-volume Production, Precision, and Pharmaceutical Demand Driving Adoption

Pill pressing machines are essential for producing uniform, high-quality tablets at scale. Pharmaceutical companies rely on them to meet strict dosage accuracy and product consistency requirements. Nutraceutical and supplement manufacturers also benefit from their ability to process varied formulations, including herbal and vitamin-based tablets. Features such as multi-station rotary presses, real-time monitoring, and automated feeding systems improve productivity and reduce human error. These advantages position pill pressing machines as indispensable tools in the global healthcare and wellness sectors.

High Equipment Costs, Compliance Burdens, and Maintenance Needs Restraining Growth

Despite strong demand, adoption is limited by significant capital investment and maintenance costs, especially for advanced high-speed machines. Strict regulatory standards for pharmaceutical equipment validation add complexity, requiring rigorous documentation and frequent inspections. Smaller manufacturers face financial and technical barriers in meeting Good Manufacturing Practice (GMP) requirements. Mechanical wear from continuous operation also necessitates regular calibration and skilled technicians for upkeep. These factors create hurdles for smaller firms and emerging market players.

Automation, Continuous Manufacturing, and Multi-layer Tablet Technology Trends Emerging

Key trends include integration of automation and robotics to reduce manual intervention, enhance speed, and improve precision in tablet pressing. Continuous manufacturing systems are gaining traction, offering improved efficiency and reduced batch variability. Multi-layer tablet technology is enabling the production of combination drugs, expanding therapeutic applications. Manufacturers are also developing compact, modular presses suitable for small-batch and personalized medicine production. These innovations are redefining pill pressing machines as high-tech solutions aligned with pharmaceutical innovation, efficiency, and regulatory compliance.
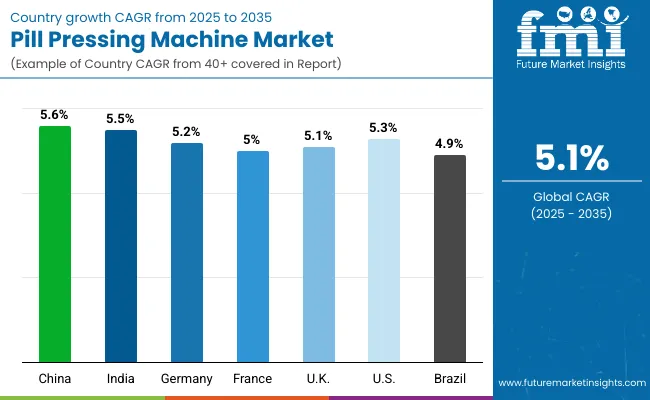
Analysis of Pill Pressing Machine Market by Key Countries

Country Wise Analysis Of Pill Pressing Machine Market

The global pill pressing machine market is growing steadily, supported by rising pharmaceutical demand, nutraceutical expansion, and increasing automation in drug manufacturing. Asia-Pacific is emerging as a high-growth region, with China and India driving adoption due to expanding generics production and contract manufacturing services. Developed economies such as the USA, Germany, and Japan are advancing precision-engineered, high-speed tablet press machines that comply with GMP standards, integrating automation and data monitoring to improve quality, safety, and efficiency.
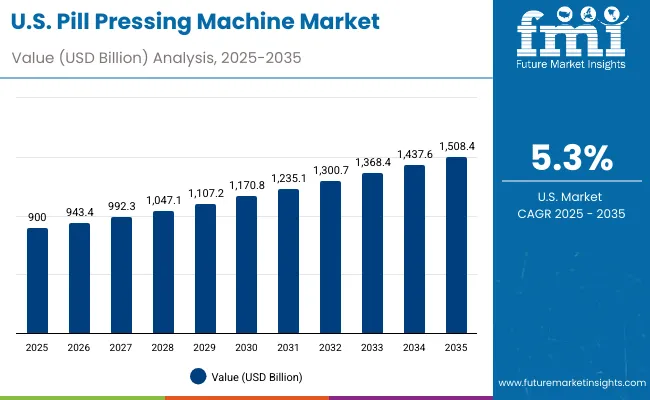
Sales Outlook for Pill Pressing Machine Market United States

Usa Pill Pressing Machine Market

The USA market is projected to grow at a CAGR of 5.3% from 2025 to 2035, driven by demand in pharmaceuticals, nutraceuticals, and OTC drug production. Manufacturers are adopting advanced rotary tablet presses with higher output, precision dosing, and compliance with FDA regulations. Automation and real-time monitoring systems are increasingly being integrated into pill pressing machines to reduce downtime, improve efficiency, and maintain consistent quality across high-volume production lines.

  • Pharma firms adopt rotary presses for consistent high-output production.
  • Nutraceutical companies use automated systems for compliance and scalability.
  • OEMs integrate data monitoring for improved efficiency and quality assurance.

Growth Outlook for Pill Pressing Machine Market Germany

Germany’s market is expected to grow at a CAGR of 5.2%, supported by its strong pharmaceutical manufacturing ecosystem and stringent EU compliance standards. Demand is rising for modular, high-precision tablet presses with rapid changeover capabilities to handle multi-product lines. Innovation focuses on automation, energy efficiency, and real-time defect detection. German OEMs are developing GMP-compliant equipment designed for both large-scale pharmaceutical firms and SMEs producing specialty drugs and nutraceutical products.

  • Pharma exporters adopt modular presses to meet EU GMP standards.
  • Multi-product facilities prefer rapid-changeover tablet pressing systems.
  • OEMs develop defect-detection integrated presses for quality compliance.

Expansion Outlook for Pill Pressing Machine Market United Kingdom

The UK market is forecast to grow at a CAGR of 5.1%, driven by pharmaceutical research, clinical trials, and growing nutraceutical consumption. Small and medium manufacturers are investing in cost-efficient pill pressing machines for contract production. Demand is also rising for equipment with serialization and traceability features to meet MHRA standards. OEMs are providing compact, automated presses suitable for both pilot-scale production and large-scale commercial manufacturing of tablets and capsules.

  • Clinical trial facilities adopt compact presses for pilot-scale production.
  • Nutraceutical brands adopt automation to scale capsule manufacturing.
  • OEMs deliver traceable, MHRA-compliant pill pressing machines.

Sales Outlook for Pill Pressing Machine Market China

China’s market is projected to grow at a CAGR of 5.6%, fueled by rapid expansion of pharmaceutical manufacturing, generics production, and healthcare modernization. Domestic firms are adopting advanced rotary tablet presses to increase efficiency and meet GMP standards. Government initiatives to strengthen drug safety and quality assurance are boosting demand for automated systems. Local OEMs are scaling production of affordable, high-capacity pill pressing machines for both domestic use and exports to developing markets.

  • Generics manufacturers adopt rotary presses for cost-effective scalability.
  • Domestic OEMs scale affordable GMP-compliant machines for mass use.
  • Government policies boost adoption of quality-driven pill pressing technologies.

Growth Outlook for Pill Pressing Machine Market India

India is forecast to grow at a CAGR of 5.5%, supported by its role as a global hub for generics and contract manufacturing. Pharma exporters are increasingly investing in high-speed, automated pill presses to meet international compliance standards. Nutraceutical startups are adopting compact, flexible machines for small-batch runs. With government initiatives promoting “Pharma Vision 2020” and global exports, demand for cost-efficient, GMP-certified pill pressing equipment is rising significantly in the Indian market.
  • Pharma exporters adopt high-speed machines for regulated markets.
  • Nutraceutical startups prefer compact presses for flexible production.
  • OEMs provide affordable GMP-compliant systems for SMEs.

Growth Outlook for Pill Pressing Machine Market Japan

Japan Pill Pressing Machine Market

Japan’s market is projected to grow at a CAGR of 5.0%, anchored by strong demand for precision in pharmaceuticals, healthcare, and supplements. Pill pressing machines with compact design, high reliability, and advanced safety systems are in demand. Local manufacturers emphasize precision engineering and compliance with strict quality norms. The trend is toward integrating automation and real-time inspection in presses to ensure accuracy and minimize risks in high-value tablet and capsule production.
  • Pharma firms adopt compact presses for precision-driven drug manufacturing.
  • Supplement makers integrate automated inspection systems for safety.
  • OEMs develop precision presses aligned with strict quality norms.

Expansion Outlook for Pill Pressing Machine Market South Korea

South Korea Pill Pressing Machine Market

South Korea’s market is expected to grow at a CAGR of 5.1%, driven by pharmaceuticals, nutraceuticals, and biotechnology. Companies are adopting pill pressing machines with automation-ready features to improve scalability and compliance. Demand for compact systems among SMEs and advanced rotary presses among large firms is rising. The emphasis on exports of K-pharma and dietary supplements is boosting adoption of machines designed for compliance with global standards and consistent production.

  • Biotech firms adopt automated systems for scalable tablet production.
  • SMEs invest in compact presses for cost-efficient manufacturing.
  • Exporters demand machines aligned with international pharma regulations.

Analysis of Japan’s Pill Pressing Machine Market by Machine Type

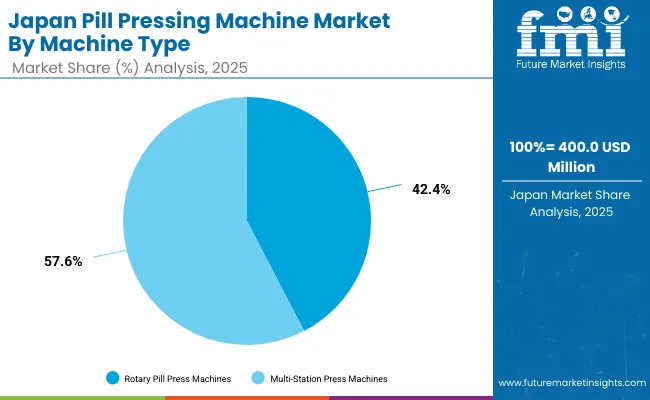
Japan’s pill pressing machine market in 2025, valued at USD 400 million, is dominated by multi-station press machines, holding 57.5% share due to their high capacity and efficiency in large-scale pharmaceutical production. Rotary pill press machines account for 42.5%, supporting mid-range production with reliability and flexibility. The preference for multi-station machines reflects Japan’s advanced pharmaceutical manufacturing sector, emphasizing mass production, precision, and consistent quality. Rotary machines continue to find relevance in smaller-scale and diversified applications. This balance indicates Japan’s dual focus on maximizing production efficiency while maintaining operational versatility to meet diverse pharmaceutical and nutraceutical industry requirements.

Analysis of South Korea’s Pill Pressing Machine Market by Automation

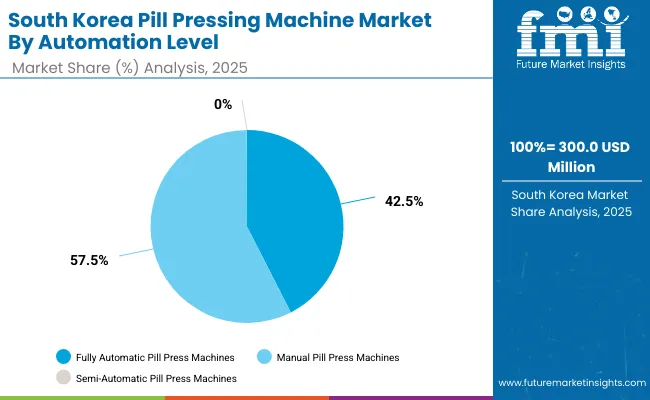
South Korea’s pill pressing machine market, worth USD 300 million in 2025, is led by manual machines with 56.1% share, reflecting their affordability and widespread use among smaller manufacturers. Fully automatic machines follow at 43.9%, driven by rising adoption in large-scale pharmaceutical facilities for speed and precision. Semi-automatic machines currently hold negligible share. The dominance of manual presses underscores South Korea’s significant presence of small and medium enterprises, where cost-effectiveness drives equipment choice. However, the growing transition toward automation reflects industry modernization, regulatory compliance, and the pursuit of efficiency. This dynamic highlights South Korea’s evolving pharmaceutical manufacturing landscape.
Competitive Landscape of Pill Pressing Machine Market

Pill Pressing Machine Market By Company

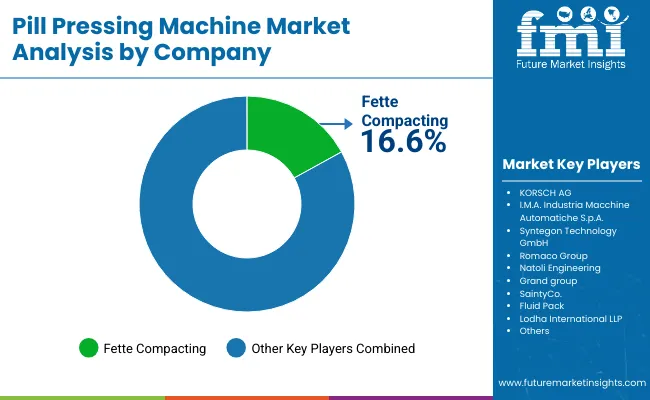
The pill pressing machine market is moderately fragmented, with pharmaceutical machinery leaders, process automation specialists, and regional equipment manufacturers competing across generics, nutraceuticals, and large-scale pharma production. Global leaders such as Fette Compacting, KORSCH AG, and I.M.A. Industria Macchine Automatiche S.p.A. hold notable market share, driven by high-speed rotary presses, precision dosing, and compliance with cGMP and FDA standards. Their strategies increasingly emphasize digital monitoring, quick tooling changeovers, and continuous manufacturing integration.

Established mid-sized players including Syntegon Technology GmbH, Romaco Group, and Natoli Engineering are supporting adoption of advanced pill pressing systems featuring servo-driven controls, automated weight adjustment, and multi-layer tablet capabilities. These companies are especially active in oral solid dosage forms, offering flexibility for complex formulations, real-time data acquisition, and robust quality assurance through integrated inspection systems.

Specialized regional providers such as Grand Group, SaintyCo, Fluid Pack, and Lodha International LLP focus on cost-efficient solutions for emerging pharma markets and contract manufacturers. Their strengths lie in modular press designs, scalability for small-to-large batch production, and simplified maintenance, while also investing in smart automation features to improve productivity and ensure global regulatory compliance.

Key Development

  • In June 2025, Fette Compacting teamed up with CDMO CMIC to establish a development platform within GMP-certified cleanrooms. This collaboration allows pharmaceutical manufacturers to innovate and validate continuous tableting processes from formulation to clinical samples in a unified environment.
  • In March 2025, KORSCH introduced the X 3 Tablet Press, a revolutionary mid-range, single-sided rotary press offering high throughput (up to 266,400 tablets/hour single-layer; 133,200 bi-layer). It supports quick turret changes, offers high containment (OEB 3-5), and delivers ergonomic, accessible design.

Key Companies

  • Fette Compacting
  • KORSCH AG
  • I.M.A. Industria Macchine Automatiche S.p.A.
  • Syntegon Technology GmbH
  • Romaco Group
  • Natoli Engineering
  • Grand group
  • SaintyCo.
  • Fluid Pack
  • Lodha International LLP

Scope of the Report

Item Value
Quantitative Units USD 2.8 Billion
By Machine Type Rotary Pill Press Machines, Multi-Station Press Machines
By Automation Level Manual Pill Press Machines, Semi-Automatic Pill Press Machines, Fully Automatic Pill Press Machines
By Capacity Low Capacity (Up to 50,000 Tablets/Hour), Medium Capacity (50,001 - 200,000 Tablets/Hour), High Capacity (Above 200,000 Tablets/Hour)
By Application Pharmaceutical Tablet Production, Nutraceuticals and Dietary Supplements, Veterinary Medicine Tablets, Industrial and Specialty Chemicals
By End-Use Industry Pharmaceutical Manufacturers, Nutraceutical Companies, Research and Development Laboratories, Veterinary Healthcare Producers, Contract Manufacturing Organizations (CMOs)
Key Companies Profiled Fette Compacting, KORSCH AG, I.M.A. Industria Macchine Automatiche S.p.A., Syntegon Technology GmbH, Romaco Group, Natoli Engineering, Grand Group, SaintyCo, Fluid Pack, Lodha International LLP
Additional Attributes Strong demand for high-capacity rotary press machines in large-scale pharmaceutical production, rising adoption of fully automatic systems to improve precision and output, nutraceutical and dietary supplement expansion driving medium-capacity machine use, growing role of CMOs in cost-efficient manufacturing, and increased adoption in veterinary and specialty chemicals requiring uniform dosage and compliance with global GMP standards.

Key Segmentation

By Machine Type:

  • Rotary Pill Press Machines
  • Multi-Station Press Machines

By Automation Level:

  • Manual Pill Press Machines
  • Semi-Automatic Pill Press Machines
  • Fully Automatic Pill Press Machines

By Capacity:

  • Low Capacity (Up to 50,000 Tablets/Hour)
  • Medium Capacity (50,001 – 200,000 Tablets/Hour)
  • High Capacity (Above 200,000 Tablets/Hour)

By Application:

  • Pharmaceutical Tablet Production
  • Nutraceuticals and Dietary Supplements
  • Veterinary Medicine Tablets
  • Industrial and Specialty Chemicals

By End-Use Industry:

  • Pharmaceutical Manufacturers
  • Nutraceutical Companies
  • Research and Development Laboratories
  • Veterinary Healthcare Producers
  • Contract Manufacturing Organizations (CMOs)

By Region:

  • North America
  • Europe
  • Asia-Pacific
  • Latin America
  • Middle East & Africa

Table of Content

  1. Executive Summary
    • Global Market Outlook
    • Demand-side Trends
    • Supply-side Trends
    • Technology Roadmap Analysis
    • Analysis and Recommendations
  2. Market Overview
    • Market Coverage / Taxonomy
    • Market Definition / Scope / Limitations
  3. Market Background
    • Market Dynamics
      • Drivers
      • Restraints
      • Opportunity
      • Trends
    • Scenario Forecast
      • Demand in Optimistic Scenario
      • Demand in Likely Scenario
      • Demand in Conservative Scenario
    • Opportunity Map Analysis
    • Product Life Cycle Analysis
    • Supply Chain Analysis
      • Supply Side Participants and their Roles
        • Producers
        • Mid-Level Participants (Traders/ Agents/ Brokers)
        • Wholesalers and Distributors
      • Value Added and Value Created at Node in the Supply Chain
      • List of Raw Material Suppliers
      • List of Existing and Potential Buyer’s
    • Investment Feasibility Matrix
    • Value Chain Analysis
      • Profit Margin Analysis
      • Wholesalers and Distributors
      • Retailers
    • PESTLE and Porter’s Analysis
    • Regulatory Landscape
      • By Key Regions
      • By Key Countries
    • Regional Parent Market Outlook
    • Production and Consumption Statistics
    • Import and Export Statistics
  4. Global Market Analysis 2020 to 2024 and Forecast, 2025 to 2035
    • Historical Market Size Value (USD Billion) & Volume (Units) Analysis, 2020 to 2024
    • Current and Future Market Size Value (USD Billion) & Volume (Units) Projections, 2025 to 2035
      • Y-o-Y Growth Trend Analysis
      • Absolute $ Opportunity Analysis
  5. Global Market Analysis 2020 to 2024 and Forecast 2025 to 2035, By Machine Type
    • Introduction / Key Findings
    • Historical Market Size Value (USD Billion) & Volume (Units) Analysis By Machine Type, 2020 to 2024
    • Current and Future Market Size Value (USD Billion) & Volume (Units) Analysis and Forecast By Machine Type, 2025 to 2035
      • Rotary Pill Press Machines
      • Multi-Station Press Machines
    • Y-o-Y Growth Trend Analysis By Machine Type, 2020 to 2024
    • Absolute $ Opportunity Analysis By Machine Type, 2025 to 2035
  6. Global Market Analysis 2020 to 2024 and Forecast 2025 to 2035, By Automation Level
    • Introduction / Key Findings
    • Historical Market Size Value (USD Billion) & Volume (Units) Analysis By Automation Level, 2020 to 2024
    • Current and Future Market Size Value (USD Billion) & Volume (Units) Analysis and Forecast By Automation Level, 2025 to 2035
      • Manual Pill Press Machines
      • Semi-Automatic Pill Press Machines
      • Fully Automatic Pill Press Machines
    • Y-o-Y Growth Trend Analysis By Automation Level, 2020 to 2024
    • Absolute $ Opportunity Analysis By Automation Level, 2025 to 2035
  7. Global Market Analysis 2020 to 2024 and Forecast 2025 to 2035, By Capacity
    • Introduction / Key Findings
    • Historical Market Size Value (USD Billion) & Volume (Units) Analysis By Capacity, 2020 to 2024
    • Current and Future Market Size Value (USD Billion) & Volume (Units) Analysis and Forecast By Capacity, 2025 to 2035
      • Low Capacity (Up to 50,000 Tablets/Hour)
      • Medium Capacity (50,001 – 200,000 Tablets/Hour)
      • High Capacity (Above 200,000 Tablets/Hour)
    • Y-o-Y Growth Trend Analysis By Capacity, 2020 to 2024
    • Absolute $ Opportunity Analysis By Capacity, 2025 to 2035
  8. Global Market Analysis 2020 to 2024 and Forecast 2025 to 2035, By Application
    • Introduction / Key Findings
    • Historical Market Size Value (USD Billion) & Volume (Units) Analysis By Application, 2020 to 2024
    • Current and Future Market Size Value (USD Billion) & Volume (Units) Analysis and Forecast By Application, 2025 to 2035
      • Pharmaceutical Tablet Production
      • Nutraceuticals and Dietary Supplements
      • Veterinary Medicine Tablets
      • Industrial and Specialty Chemicals
    • Y-o-Y Growth Trend Analysis By Application, 2020 to 2024
    • Absolute $ Opportunity Analysis By Application, 2025 to 2035
  9. Global Market Analysis 2020 to 2024 and Forecast 2025 to 2035, By End-Use Industry
    • Introduction / Key Findings
    • Historical Market Size Value (USD Billion) & Volume (Units) Analysis By End-Use Industry, 2020 to 2024
    • Current and Future Market Size Value (USD Billion) & Volume (Units) Analysis and Forecast By End-Use Industry, 2025 to 2035
      • Pharmaceutical Manufacturers
      • Nutraceutical Companies
      • Research and Development Laboratories
      • Veterinary Healthcare Producers
      • Contract Manufacturing Organizations (CMOs)
    • Y-o-Y Growth Trend Analysis By End-Use Industry, 2020 to 2024
    • Absolute $ Opportunity Analysis By End-Use Industry, 2025 to 2035
  10. Global Market Analysis 2020 to 2024 and Forecast 2025 to 2035, By Region
    • Introduction
    • Historical Market Size Value (USD Billion) & Volume (Units) Analysis By Region, 2020 to 2024
    • Current Market Size Value (USD Billion) & Volume (Units) Analysis and Forecast By Region, 2025 to 2035
      • North America
      • Latin America
      • East Asia
      • South Asia & Pacific
      • Western Europe
      • Eastern Europe
      • Middle East & Africa
    • Market Attractiveness Analysis By Region
  11. North America Market Analysis 2020 to 2024 and Forecast 2025 to 2035, By Country
    • Historical Market Size Value (USD Billion) & Volume (Units) Trend Analysis By Market Taxonomy, 2020 to 2024
    • Market Size Value (USD Billion) & Volume (Units) Forecast By Market Taxonomy, 2025 to 2035
      • By Country
        • U.S.
        • Canada
        • Mexico
      • By Machine Type
      • By Automation Level
      • By Capacity
      • By Application
      • By End-Use Industry
    • Market Attractiveness Analysis
      • By Country
      • By Machine Type
      • By Automation Level
      • By Capacity
      • By Application
      • By End-Use Industry
    • Key Takeaways
  12. Latin America Market Analysis 2020 to 2024 and Forecast 2025 to 2035, By Country
    • Historical Market Size Value (USD Billion) & Volume (Units) Trend Analysis By Market Taxonomy, 2020 to 2024
    • Market Size Value (USD Billion) & Volume (Units) Forecast By Market Taxonomy, 2025 to 2035
      • By Country
        • Brazil
        • Argentina
        • Rest of Latin America
      • By Machine Type
      • By Automation Level
      • By Capacity
      • By Application
      • By End-Use Industry
    • Market Attractiveness Analysis
      • By Country
      • By Machine Type
      • By Automation Level
      • By Capacity
      • By Application
      • By End-Use Industry
    • Key Takeaways
  13. East Asia Market Analysis 2020 to 2024 and Forecast 2025 to 2035, By Country
    • Historical Market Size Value (USD Billion) & Volume (Units) Trend Analysis By Market Taxonomy, 2020 to 2024
    • Market Size Value (USD Billion) & Volume (Units) Forecast By Market Taxonomy, 2025 to 2035
      • By Country
        • China
        • Japan
        • South Korea
      • By Machine Type
      • By Automation Level
      • By Capacity
      • By Application
      • By End-Use Industry
    • Market Attractiveness Analysis
      • By Country
      • By Machine Type
      • By Automation Level
      • By Capacity
      • By Application
      • By End-Use Industry
    • Key Takeaways
  14. South Asia & Pacific Market Analysis 2020 to 2024 and Forecast 2025 to 2035, By Country
    • Historical Market Size Value (USD Billion) & Volume (Units) Trend Analysis By Market Taxonomy, 2020 to 2024
    • Market Size Value (USD Billion) & Volume (Units) Forecast By Market Taxonomy, 2025 to 2035
      • By Country
        • India
        • ASEAN Countries
        • Australia& New Zealand
        • Rest of South Asia
      • By Machine Type
      • By Automation Level
      • By Capacity
      • By Application
      • By End-Use Industry
    • Market Attractiveness Analysis
      • By Country
      • By Machine Type
      • By Automation Level
      • By Capacity
      • By Application
      • By End-Use Industry
    • Key Takeaways
  15. Western Europe Market Analysis 2020 to 2024 and Forecast 2025 to 2035, By Country
    • Historical Market Size Value (USD Billion) & Volume (Units) Trend Analysis By Market Taxonomy, 2020 to 2024
    • Market Size Value (USD Billion) & Volume (Units) Forecast By Market Taxonomy, 2025 to 2035
      • By Country
        • Germany
        • U.K.
        • France
        • Italy
        • Spain
        • BENELUX
        • Nordic Countries
        • Rest of Western Europe
      • By Machine Type
      • By Automation Level
      • By Capacity
      • By Application
      • By End-Use Industry
    • Market Attractiveness Analysis
      • By Country
      • By Machine Type
      • By Automation Level
      • By Capacity
      • By Application
      • By End-Use Industry
    • Key Takeaways
  16. Eastern Europe Market Analysis 2020 to 2024 and Forecast 2025 to 2035, By Country
    • Historical Market Size Value (USD Billion) & Volume (Units) Trend Analysis By Market Taxonomy, 2020 to 2024
    • Market Size Value (USD Billion) & Volume (Units) Forecast By Market Taxonomy, 2025 to 2035
      • By Country
        • Russia
        • Hungary
        • Poland
        • Rest of Eastern Europe
      • By Machine Type
      • By Automation Level
      • By Capacity
      • By Application
      • By End-Use Industry
    • Market Attractiveness Analysis
      • By Country
      • By Machine Type
      • By Automation Level
      • By Capacity
      • By Application
      • By End-Use Industry
    • Key Takeaways
  17. Middle East & Africa Market Analysis 2020 to 2024 and Forecast 2025 to 2035, By Country
    • Historical Market Size Value (USD Billion) & Volume (Units) Trend Analysis By Market Taxonomy, 2020 to 2024
    • Market Size Value (USD Billion) & Volume (Units) Forecast By Market Taxonomy, 2025 to 2035
      • By Country
        • Saudi Arabia
        • Türkiye
        • South Africa
        • Other African Union
        • Rest of Middle East & Africa
      • By Machine Type
      • By Automation Level
      • By Capacity
      • By Application
      • By End-Use Industry
    • Market Attractiveness Analysis
      • By Country
      • By Machine Type
      • By Automation Level
      • By Capacity
      • By Application
      • By End-Use Industry
    • Key Takeaways
  18. Key Countries Market Analysis
    • U.S.
      • Pricing Analysis
      • Market Share Analysis, 2024
        • By Machine Type
        • By Automation Level
        • By Capacity
        • By Application
        • By End-Use Industry
    • Brazil
      • Pricing Analysis
      • Market Share Analysis, 2024
        • By Machine Type
        • By Automation Level
        • By Capacity
        • By Application
        • By End-Use Industry
    • China
      • Pricing Analysis
      • Market Share Analysis, 2024
        • By Machine Type
        • By Automation Level
        • By Capacity
        • By Application
        • By End-Use Industry
    • India
      • Pricing Analysis
      • Market Share Analysis, 2024
        • By Machine Type
        • By Automation Level
        • By Capacity
        • By Application
        • By End-Use Industry
    • Europe
      • Pricing Analysis
      • Market Share Analysis, 2024
        • By Machine Type
        • By Automation Level
        • By Capacity
        • By Application
        • By End-Use Industry
    • Germany
      • Pricing Analysis
      • Market Share Analysis, 2024
        • By Machine Type
        • By Automation Level
        • By Capacity
        • By Application
        • By End-Use Industry
    • France
      • Pricing Analysis
      • Market Share Analysis, 2024
        • By Machine Type
        • By Automation Level
        • By Capacity
        • By Application
        • By End-Use Industry
    • U.K.
      • Pricing Analysis
      • Market Share Analysis, 2024
        • By Machine Type
        • By Automation Level
        • By Capacity
        • By Application
        • By End-Use Industry
  19. Market Structure Analysis
    • Competition Dashboard
    • Competition Benchmarking
    • Market Share Analysis of Top Players
      • By Regional
      • By Machine Type
      • By Automation Level
      • By Capacity
      • By Application
      • By End-Use Industry
  20. Competition Analysis
    • Competition Deep Dive
      • Fette Compacting
        • Overview
        • Product Portfolio
        • Profitability by Market Segments (Product/Age /Sales Channel/Region)
        • Sales Footprint
        • Strategy Overview
          • Marketing Strategy
          • Product Strategy
          • Channel Strategy
      • KORSCH AG
        • Overview
        • Product Portfolio
        • Profitability by Market Segments (Product/Age /Sales Channel/Region)
        • Sales Footprint
        • Strategy Overview
          • Marketing Strategy
          • Product Strategy
          • Channel Strategy
      • I.M.A. Industria Macchine Automatiche S.p.A.
        • Overview
        • Product Portfolio
        • Profitability by Market Segments (Product/Age /Sales Channel/Region)
        • Sales Footprint
        • Strategy Overview
          • Marketing Strategy
          • Product Strategy
          • Channel Strategy
      • Syntegon Technology GmbH
        • Overview
        • Product Portfolio
        • Profitability by Market Segments (Product/Age /Sales Channel/Region)
        • Sales Footprint
        • Strategy Overview
          • Marketing Strategy
          • Product Strategy
          • Channel Strategy
      • Romaco Group
        • Overview
        • Product Portfolio
        • Profitability by Market Segments (Product/Age /Sales Channel/Region)
        • Sales Footprint
        • Strategy Overview
          • Marketing Strategy
          • Product Strategy
          • Channel Strategy
      • Natoli Engineering
        • Overview
        • Product Portfolio
        • Profitability by Market Segments (Product/Age /Sales Channel/Region)
        • Sales Footprint
        • Strategy Overview
          • Marketing Strategy
          • Product Strategy
          • Channel Strategy
      • Grand group
        • Overview
        • Product Portfolio
        • Profitability by Market Segments (Product/Age /Sales Channel/Region)
        • Sales Footprint
        • Strategy Overview
          • Marketing Strategy
          • Product Strategy
          • Channel Strategy
      • SaintyCo.
        • Overview
        • Product Portfolio
        • Profitability by Market Segments (Product/Age /Sales Channel/Region)
        • Sales Footprint
        • Strategy Overview
          • Marketing Strategy
          • Product Strategy
          • Channel Strategy
      • Fluid Pack
        • Overview
        • Product Portfolio
        • Profitability by Market Segments (Product/Age /Sales Channel/Region)
        • Sales Footprint
        • Strategy Overview
          • Marketing Strategy
          • Product Strategy
          • Channel Strategy
      • Lodha International LLP
        • Overview
        • Product Portfolio
        • Profitability by Market Segments (Product/Age /Sales Channel/Region)
        • Sales Footprint
        • Strategy Overview
          • Marketing Strategy
          • Product Strategy
          • Channel Strategy
  21. Assumptions & Acronyms Used
  22. Research Methodology

List of Tables

  • Table 1: Global Market Value (USD Billion) Forecast by Region, 2020-2035
  • Table 2: Global Market Volume (Units) Forecast by Region, 2020-2035
  • Table 3: Global Market Value (USD Billion) Forecast by Machine Type, 2020-2035
  • Table 4: Global Market Volume (Units) Forecast by Machine Type, 2020-2035
  • Table 5: Global Market Value (USD Billion) Forecast by Automation Level, 2020-2035
  • Table 6: Global Market Volume (Units) Forecast by Automation Level, 2020-2035
  • Table 7: Global Market Value (USD Billion) Forecast by Capacity, 2020-2035
  • Table 8: Global Market Volume (Units) Forecast by Capacity, 2020-2035
  • Table 9: Global Market Value (USD Billion) Forecast by Application, 2020-2035
  • Table 10: Global Market Volume (Units) Forecast by Application, 2020-2035
  • Table 11: Global Market Value (USD Billion) Forecast by End-Use Industry, 2020-2035
  • Table 12: Global Market Volume (Units) Forecast by End-Use Industry, 2020-2035
  • Table 13: North America Market Value (USD Billion) Forecast by Country, 2020-2035
  • Table 14: North America Market Volume (Units) Forecast by Country, 2020-2035
  • Table 15: North America Market Value (USD Billion) Forecast by Machine Type, 2020-2035
  • Table 16: North America Market Volume (Units) Forecast by Machine Type, 2020-2035
  • Table 17: North America Market Value (USD Billion) Forecast by Automation Level, 2020-2035
  • Table 18: North America Market Volume (Units) Forecast by Automation Level, 2020-2035
  • Table 19: North America Market Value (USD Billion) Forecast by Capacity, 2020-2035
  • Table 20: North America Market Volume (Units) Forecast by Capacity, 2020-2035
  • Table 21: North America Market Value (USD Billion) Forecast by Application, 2020-2035
  • Table 22: North America Market Volume (Units) Forecast by Application, 2020-2035
  • Table 23: North America Market Value (USD Billion) Forecast by End-Use Industry, 2020-2035
  • Table 24: North America Market Volume (Units) Forecast by End-Use Industry, 2020-2035
  • Table 25: Latin America Market Value (USD Billion) Forecast by Country, 2020-2035
  • Table 26: Latin America Market Volume (Units) Forecast by Country, 2020-2035
  • Table 27: Latin America Market Value (USD Billion) Forecast by Machine Type, 2020-2035
  • Table 28: Latin America Market Volume (Units) Forecast by Machine Type, 2020-2035
  • Table 29: Latin America Market Value (USD Billion) Forecast by Automation Level, 2020-2035
  • Table 30: Latin America Market Volume (Units) Forecast by Automation Level, 2020-2035
  • Table 31: Latin America Market Value (USD Billion) Forecast by Capacity, 2020-2035
  • Table 32: Latin America Market Volume (Units) Forecast by Capacity, 2020-2035
  • Table 33: Latin America Market Value (USD Billion) Forecast by Application, 2020-2035
  • Table 34: Latin America Market Volume (Units) Forecast by Application, 2020-2035
  • Table 35: Latin America Market Value (USD Billion) Forecast by End-Use Industry, 2020-2035
  • Table 36: Latin America Market Volume (Units) Forecast by End-Use Industry, 2020-2035
  • Table 37: East Asia Market Value (USD Billion) Forecast by Country, 2020-2035
  • Table 38: East Asia Market Volume (Units) Forecast by Country, 2020-2035
  • Table 39: East Asia Market Value (USD Billion) Forecast by Machine Type, 2020-2035
  • Table 40: East Asia Market Volume (Units) Forecast by Machine Type, 2020-2035
  • Table 41: East Asia Market Value (USD Billion) Forecast by Automation Level, 2020-2035
  • Table 42: East Asia Market Volume (Units) Forecast by Automation Level, 2020-2035
  • Table 43: East Asia Market Value (USD Billion) Forecast by Capacity, 2020-2035
  • Table 44: East Asia Market Volume (Units) Forecast by Capacity, 2020-2035
  • Table 45: East Asia Market Value (USD Billion) Forecast by Application, 2020-2035
  • Table 46: East Asia Market Volume (Units) Forecast by Application, 2020-2035
  • Table 47: East Asia Market Value (USD Billion) Forecast by End-Use Industry, 2020-2035
  • Table 48: East Asia Market Volume (Units) Forecast by End-Use Industry, 2020-2035
  • Table 49: South Asia & Pacific Market Value (USD Billion) Forecast by Country, 2020-2035
  • Table 50: South Asia & Pacific Market Volume (Units) Forecast by Country, 2020-2035
  • Table 51: South Asia & Pacific Market Value (USD Billion) Forecast by Machine Type, 2020-2035
  • Table 52: South Asia & Pacific Market Volume (Units) Forecast by Machine Type, 2020-2035
  • Table 53: South Asia & Pacific Market Value (USD Billion) Forecast by Automation Level, 2020-2035
  • Table 54: South Asia & Pacific Market Volume (Units) Forecast by Automation Level, 2020-2035
  • Table 55: South Asia & Pacific Market Value (USD Billion) Forecast by Capacity, 2020-2035
  • Table 56: South Asia & Pacific Market Volume (Units) Forecast by Capacity, 2020-2035
  • Table 57: South Asia & Pacific Market Value (USD Billion) Forecast by Application, 2020-2035
  • Table 58: South Asia & Pacific Market Volume (Units) Forecast by Application, 2020-2035
  • Table 59: South Asia & Pacific Market Value (USD Billion) Forecast by End-Use Industry, 2020-2035
  • Table 60: South Asia & Pacific Market Volume (Units) Forecast by End-Use Industry, 2020-2035
  • Table 61: Western Europe Market Value (USD Billion) Forecast by Country, 2020-2035
  • Table 62: Western Europe Market Volume (Units) Forecast by Country, 2020-2035
  • Table 63: Western Europe Market Value (USD Billion) Forecast by Machine Type, 2020-2035
  • Table 64: Western Europe Market Volume (Units) Forecast by Machine Type, 2020-2035
  • Table 65: Western Europe Market Value (USD Billion) Forecast by Automation Level, 2020-2035
  • Table 66: Western Europe Market Volume (Units) Forecast by Automation Level, 2020-2035
  • Table 67: Western Europe Market Value (USD Billion) Forecast by Capacity, 2020-2035
  • Table 68: Western Europe Market Volume (Units) Forecast by Capacity, 2020-2035
  • Table 69: Western Europe Market Value (USD Billion) Forecast by Application, 2020-2035
  • Table 70: Western Europe Market Volume (Units) Forecast by Application, 2020-2035
  • Table 71: Western Europe Market Value (USD Billion) Forecast by End-Use Industry, 2020-2035
  • Table 72: Western Europe Market Volume (Units) Forecast by End-Use Industry, 2020-2035
  • Table 73: Eastern Europe  Market Value (USD Billion) Forecast by Country, 2020-2035
  • Table 74: Eastern Europe  Market Volume (Units) Forecast by Country, 2020-2035
  • Table 75: Eastern Europe  Market Value (USD Billion) Forecast by Machine Type, 2020-2035
  • Table 76: Eastern Europe  Market Volume (Units) Forecast by Machine Type, 2020-2035
  • Table 77: Eastern Europe  Market Value (USD Billion) Forecast by Automation Level, 2020-2035
  • Table 78: Eastern Europe  Market Volume (Units) Forecast by Automation Level, 2020-2035
  • Table 79: Eastern Europe  Market Value (USD Billion) Forecast by Capacity, 2020-2035
  • Table 80: Eastern Europe  Market Volume (Units) Forecast by Capacity, 2020-2035
  • Table 81: Eastern Europe  Market Value (USD Billion) Forecast by Application, 2020-2035
  • Table 82: Eastern Europe  Market Volume (Units) Forecast by Application, 2020-2035
  • Table 83: Eastern Europe  Market Value (USD Billion) Forecast by End-Use Industry, 2020-2035
  • Table 84: Eastern Europe  Market Volume (Units) Forecast by End-Use Industry, 2020-2035
  • Table 85: Middle East & Africa Market Value (USD Billion) Forecast by Country, 2020-2035
  • Table 86: Middle East & Africa Market Volume (Units) Forecast by Country, 2020-2035
  • Table 87: Middle East & Africa Market Value (USD Billion) Forecast by Machine Type, 2020-2035
  • Table 88: Middle East & Africa Market Volume (Units) Forecast by Machine Type, 2020-2035
  • Table 89: Middle East & Africa Market Value (USD Billion) Forecast by Automation Level, 2020-2035
  • Table 90: Middle East & Africa Market Volume (Units) Forecast by Automation Level, 2020-2035
  • Table 91: Middle East & Africa Market Value (USD Billion) Forecast by Capacity, 2020-2035
  • Table 92: Middle East & Africa Market Volume (Units) Forecast by Capacity, 2020-2035
  • Table 93: Middle East & Africa Market Value (USD Billion) Forecast by Application, 2020-2035
  • Table 94: Middle East & Africa Market Volume (Units) Forecast by Application, 2020-2035
  • Table 95: Middle East & Africa Market Value (USD Billion) Forecast by End-Use Industry, 2020-2035
  • Table 96: Middle East & Africa Market Volume (Units) Forecast by End-Use Industry, 2020-2035

List of Figures

  • Figure 1: Global Market Value (USD Billion) by Machine Type, 2025-2035
  • Figure 2: Global Market Value (USD Billion) by Automation Level, 2025-2035
  • Figure 3: Global Market Value (USD Billion) by Capacity, 2025-2035
  • Figure 4: Global Market Value (USD Billion) by Application, 2025-2035
  • Figure 5: Global Market Value (USD Billion) by End-Use Industry, 2025-2035
  • Figure 6: Global Market Value (USD Billion) by Region, 2025-2035
  • Figure 7: Global Market Value (USD Billion) Analysis by Region, 2020-2035
  • Figure 8: Global Market Volume (Units) Analysis by Region, 2020-2035
  • Figure 9: Global Market Value Share (%) and BPS Analysis by Region, 2025-2035
  • Figure 10: Global Market Y-o-Y Growth (%) Projections by Region, 2025-2035
  • Figure 11: Global Market Value (USD Billion) Analysis by Machine Type, 2020-2035
  • Figure 12: Global Market Volume (Units) Analysis by Machine Type, 2020-2035
  • Figure 13: Global Market Value Share (%) and BPS Analysis by Machine Type, 2025-2035
  • Figure 14: Global Market Y-o-Y Growth (%) Projections by Machine Type, 2025-2035
  • Figure 15: Global Market Value (USD Billion) Analysis by Automation Level, 2020-2035
  • Figure 16: Global Market Volume (Units) Analysis by Automation Level, 2020-2035
  • Figure 17: Global Market Value Share (%) and BPS Analysis by Automation Level, 2025-2035
  • Figure 18: Global Market Y-o-Y Growth (%) Projections by Automation Level, 2025-2035
  • Figure 19: Global Market Value (USD Billion) Analysis by Capacity, 2020-2035
  • Figure 20: Global Market Volume (Units) Analysis by Capacity, 2020-2035
  • Figure 21: Global Market Value Share (%) and BPS Analysis by Capacity, 2025-2035
  • Figure 22: Global Market Y-o-Y Growth (%) Projections by Capacity, 2025-2035
  • Figure 23: Global Market Value (USD Billion) Analysis by Application, 2020-2035
  • Figure 24: Global Market Volume (Units) Analysis by Application, 2020-2035
  • Figure 25: Global Market Value Share (%) and BPS Analysis by Application, 2025-2035
  • Figure 26: Global Market Y-o-Y Growth (%) Projections by Application, 2025-2035
  • Figure 27: Global Market Value (USD Billion) Analysis by End-Use Industry, 2020-2035
  • Figure 28: Global Market Volume (Units) Analysis by End-Use Industry, 2020-2035
  • Figure 29: Global Market Value Share (%) and BPS Analysis by End-Use Industry, 2025-2035
  • Figure 30: Global Market Y-o-Y Growth (%) Projections by End-Use Industry, 2025-2035
  • Figure 31: Global Market Attractiveness by Machine Type, 2025-2035
  • Figure 32: Global Market Attractiveness by Automation Level, 2025-2035
  • Figure 33: Global Market Attractiveness by Capacity, 2025-2035
  • Figure 34: Global Market Attractiveness by Application, 2025-2035
  • Figure 35: Global Market Attractiveness by End-Use Industry, 2025-2035
  • Figure 36: Global Market Attractiveness by Region, 2025-2035
  • Figure 37: North America Market Value (USD Billion) by Machine Type, 2025-2035
  • Figure 38: North America Market Value (USD Billion) by Automation Level, 2025-2035
  • Figure 39: North America Market Value (USD Billion) by Capacity, 2025-2035
  • Figure 40: North America Market Value (USD Billion) by Application, 2025-2035
  • Figure 41: North America Market Value (USD Billion) by End-Use Industry, 2025-2035
  • Figure 42: North America Market Value (USD Billion) by Country, 2025-2035
  • Figure 43: North America Market Value (USD Billion) Analysis by Country, 2020-2035
  • Figure 44: North America Market Volume (Units) Analysis by Country, 2020-2035
  • Figure 45: North America Market Value Share (%) and BPS Analysis by Country, 2025-2035
  • Figure 46: North America Market Y-o-Y Growth (%) Projections by Country, 2025-2035
  • Figure 47: North America Market Value (USD Billion) Analysis by Machine Type, 2020-2035
  • Figure 48: North America Market Volume (Units) Analysis by Machine Type, 2020-2035
  • Figure 49: North America Market Value Share (%) and BPS Analysis by Machine Type, 2025-2035
  • Figure 50: North America Market Y-o-Y Growth (%) Projections by Machine Type, 2025-2035
  • Figure 51: North America Market Value (USD Billion) Analysis by Automation Level, 2020-2035
  • Figure 52: North America Market Volume (Units) Analysis by Automation Level, 2020-2035
  • Figure 53: North America Market Value Share (%) and BPS Analysis by Automation Level, 2025-2035
  • Figure 54: North America Market Y-o-Y Growth (%) Projections by Automation Level, 2025-2035
  • Figure 55: North America Market Value (USD Billion) Analysis by Capacity, 2020-2035
  • Figure 56: North America Market Volume (Units) Analysis by Capacity, 2020-2035
  • Figure 57: North America Market Value Share (%) and BPS Analysis by Capacity, 2025-2035
  • Figure 58: North America Market Y-o-Y Growth (%) Projections by Capacity, 2025-2035
  • Figure 59: North America Market Value (USD Billion) Analysis by Application, 2020-2035
  • Figure 60: North America Market Volume (Units) Analysis by Application, 2020-2035
  • Figure 61: North America Market Value Share (%) and BPS Analysis by Application, 2025-2035
  • Figure 62: North America Market Y-o-Y Growth (%) Projections by Application, 2025-2035
  • Figure 63: North America Market Value (USD Billion) Analysis by End-Use Industry, 2020-2035
  • Figure 64: North America Market Volume (Units) Analysis by End-Use Industry, 2020-2035
  • Figure 65: North America Market Value Share (%) and BPS Analysis by End-Use Industry, 2025-2035
  • Figure 66: North America Market Y-o-Y Growth (%) Projections by End-Use Industry, 2025-2035
  • Figure 67: North America Market Attractiveness by Machine Type, 2025-2035
  • Figure 68: North America Market Attractiveness by Automation Level, 2025-2035
  • Figure 69: North America Market Attractiveness by Capacity, 2025-2035
  • Figure 70: North America Market Attractiveness by Application, 2025-2035
  • Figure 71: North America Market Attractiveness by End-Use Industry, 2025-2035
  • Figure 72: North America Market Attractiveness by Country, 2025-2035
  • Figure 73: Latin America Market Value (USD Billion) by Machine Type, 2025-2035
  • Figure 74: Latin America Market Value (USD Billion) by Automation Level, 2025-2035
  • Figure 75: Latin America Market Value (USD Billion) by Capacity, 2025-2035
  • Figure 76: Latin America Market Value (USD Billion) by Application, 2025-2035
  • Figure 77: Latin America Market Value (USD Billion) by End-Use Industry, 2025-2035
  • Figure 78: Latin America Market Value (USD Billion) by Country, 2025-2035
  • Figure 79: Latin America Market Value (USD Billion) Analysis by Country, 2020-2035
  • Figure 80: Latin America Market Volume (Units) Analysis by Country, 2020-2035
  • Figure 81: Latin America Market Value Share (%) and BPS Analysis by Country, 2025-2035
  • Figure 82: Latin America Market Y-o-Y Growth (%) Projections by Country, 2025-2035
  • Figure 83: Latin America Market Value (USD Billion) Analysis by Machine Type, 2020-2035
  • Figure 84: Latin America Market Volume (Units) Analysis by Machine Type, 2020-2035
  • Figure 85: Latin America Market Value Share (%) and BPS Analysis by Machine Type, 2025-2035
  • Figure 86: Latin America Market Y-o-Y Growth (%) Projections by Machine Type, 2025-2035
  • Figure 87: Latin America Market Value (USD Billion) Analysis by Automation Level, 2020-2035
  • Figure 88: Latin America Market Volume (Units) Analysis by Automation Level, 2020-2035
  • Figure 89: Latin America Market Value Share (%) and BPS Analysis by Automation Level, 2025-2035
  • Figure 90: Latin America Market Y-o-Y Growth (%) Projections by Automation Level, 2025-2035
  • Figure 91: Latin America Market Value (USD Billion) Analysis by Capacity, 2020-2035
  • Figure 92: Latin America Market Volume (Units) Analysis by Capacity, 2020-2035
  • Figure 93: Latin America Market Value Share (%) and BPS Analysis by Capacity, 2025-2035
  • Figure 94: Latin America Market Y-o-Y Growth (%) Projections by Capacity, 2025-2035
  • Figure 95: Latin America Market Value (USD Billion) Analysis by Application, 2020-2035
  • Figure 96: Latin America Market Volume (Units) Analysis by Application, 2020-2035
  • Figure 97: Latin America Market Value Share (%) and BPS Analysis by Application, 2025-2035
  • Figure 98: Latin America Market Y-o-Y Growth (%) Projections by Application, 2025-2035
  • Figure 99: Latin America Market Value (USD Billion) Analysis by End-Use Industry, 2020-2035
  • Figure 100: Latin America Market Volume (Units) Analysis by End-Use Industry, 2020-2035
  • Figure 101: Latin America Market Value Share (%) and BPS Analysis by End-Use Industry, 2025-2035
  • Figure 102: Latin America Market Y-o-Y Growth (%) Projections by End-Use Industry, 2025-2035
  • Figure 103: Latin America Market Attractiveness by Machine Type, 2025-2035
  • Figure 104: Latin America Market Attractiveness by Automation Level, 2025-2035
  • Figure 105: Latin America Market Attractiveness by Capacity, 2025-2035
  • Figure 106: Latin America Market Attractiveness by Application, 2025-2035
  • Figure 107: Latin America Market Attractiveness by End-Use Industry, 2025-2035
  • Figure 108: Latin America Market Attractiveness by Country, 2025-2035
  • Figure 109: East Asia Market Value (USD Billion) by Machine Type, 2025-2035
  • Figure 110: East Asia Market Value (USD Billion) by Automation Level, 2025-2035
  • Figure 111: East Asia Market Value (USD Billion) by Capacity, 2025-2035
  • Figure 112: East Asia Market Value (USD Billion) by Application, 2025-2035
  • Figure 113: East Asia Market Value (USD Billion) by End-Use Industry, 2025-2035
  • Figure 114: East Asia Market Value (USD Billion) by Country, 2025-2035
  • Figure 115: East Asia Market Value (USD Billion) Analysis by Country, 2020-2035
  • Figure 116: East Asia Market Volume (Units) Analysis by Country, 2020-2035
  • Figure 117: East Asia Market Value Share (%) and BPS Analysis by Country, 2025-2035
  • Figure 118: East Asia Market Y-o-Y Growth (%) Projections by Country, 2025-2035
  • Figure 119: East Asia Market Value (USD Billion) Analysis by Machine Type, 2020-2035
  • Figure 120: East Asia Market Volume (Units) Analysis by Machine Type, 2020-2035
  • Figure 121: East Asia Market Value Share (%) and BPS Analysis by Machine Type, 2025-2035
  • Figure 122: East Asia Market Y-o-Y Growth (%) Projections by Machine Type, 2025-2035
  • Figure 123: East Asia Market Value (USD Billion) Analysis by Automation Level, 2020-2035
  • Figure 124: East Asia Market Volume (Units) Analysis by Automation Level, 2020-2035
  • Figure 125: East Asia Market Value Share (%) and BPS Analysis by Automation Level, 2025-2035
  • Figure 126: East Asia Market Y-o-Y Growth (%) Projections by Automation Level, 2025-2035
  • Figure 127: East Asia Market Value (USD Billion) Analysis by Capacity, 2020-2035
  • Figure 128: East Asia Market Volume (Units) Analysis by Capacity, 2020-2035
  • Figure 129: East Asia Market Value Share (%) and BPS Analysis by Capacity, 2025-2035
  • Figure 130: East Asia Market Y-o-Y Growth (%) Projections by Capacity, 2025-2035
  • Figure 131: East Asia Market Value (USD Billion) Analysis by Application, 2020-2035
  • Figure 132: East Asia Market Volume (Units) Analysis by Application, 2020-2035
  • Figure 133: East Asia Market Value Share (%) and BPS Analysis by Application, 2025-2035
  • Figure 134: East Asia Market Y-o-Y Growth (%) Projections by Application, 2025-2035
  • Figure 135: East Asia Market Value (USD Billion) Analysis by End-Use Industry, 2020-2035
  • Figure 136: East Asia Market Volume (Units) Analysis by End-Use Industry, 2020-2035
  • Figure 137: East Asia Market Value Share (%) and BPS Analysis by End-Use Industry, 2025-2035
  • Figure 138: East Asia Market Y-o-Y Growth (%) Projections by End-Use Industry, 2025-2035
  • Figure 139: East Asia Market Attractiveness by Machine Type, 2025-2035
  • Figure 140: East Asia Market Attractiveness by Automation Level, 2025-2035
  • Figure 141: East Asia Market Attractiveness by Capacity, 2025-2035
  • Figure 142: East Asia Market Attractiveness by Application, 2025-2035
  • Figure 143: East Asia Market Attractiveness by End-Use Industry, 2025-2035
  • Figure 144: East Asia Market Attractiveness by Country, 2025-2035
  • Figure 145: South Asia & Pacific Market Value (USD Billion) by Machine Type, 2025-2035
  • Figure 146: South Asia & Pacific Market Value (USD Billion) by Automation Level, 2025-2035
  • Figure 147: South Asia & Pacific Market Value (USD Billion) by Capacity, 2025-2035
  • Figure 148: South Asia & Pacific Market Value (USD Billion) by Application, 2025-2035
  • Figure 149: South Asia & Pacific Market Value (USD Billion) by End-Use Industry, 2025-2035
  • Figure 150: South Asia & Pacific Market Value (USD Billion) by Country, 2025-2035
  • Figure 151: South Asia & Pacific Market Value (USD Billion) Analysis by Country, 2020-2035
  • Figure 152: South Asia & Pacific Market Volume (Units) Analysis by Country, 2020-2035
  • Figure 153: South Asia & Pacific Market Value Share (%) and BPS Analysis by Country, 2025-2035
  • Figure 154: South Asia & Pacific Market Y-o-Y Growth (%) Projections by Country, 2025-2035
  • Figure 155: South Asia & Pacific Market Value (USD Billion) Analysis by Machine Type, 2020-2035
  • Figure 156: South Asia & Pacific Market Volume (Units) Analysis by Machine Type, 2020-2035
  • Figure 157: South Asia & Pacific Market Value Share (%) and BPS Analysis by Machine Type, 2025-2035
  • Figure 158: South Asia & Pacific Market Y-o-Y Growth (%) Projections by Machine Type, 2025-2035
  • Figure 159: South Asia & Pacific Market Value (USD Billion) Analysis by Automation Level, 2020-2035
  • Figure 160: South Asia & Pacific Market Volume (Units) Analysis by Automation Level, 2020-2035
  • Figure 161: South Asia & Pacific Market Value Share (%) and BPS Analysis by Automation Level, 2025-2035
  • Figure 162: South Asia & Pacific Market Y-o-Y Growth (%) Projections by Automation Level, 2025-2035
  • Figure 163: South Asia & Pacific Market Value (USD Billion) Analysis by Capacity, 2020-2035
  • Figure 164: South Asia & Pacific Market Volume (Units) Analysis by Capacity, 2020-2035
  • Figure 165: South Asia & Pacific Market Value Share (%) and BPS Analysis by Capacity, 2025-2035
  • Figure 166: South Asia & Pacific Market Y-o-Y Growth (%) Projections by Capacity, 2025-2035
  • Figure 167: South Asia & Pacific Market Value (USD Billion) Analysis by Application, 2020-2035
  • Figure 168: South Asia & Pacific Market Volume (Units) Analysis by Application, 2020-2035
  • Figure 169: South Asia & Pacific Market Value Share (%) and BPS Analysis by Application, 2025-2035
  • Figure 170: South Asia & Pacific Market Y-o-Y Growth (%) Projections by Application, 2025-2035
  • Figure 171: South Asia & Pacific Market Value (USD Billion) Analysis by End-Use Industry, 2020-2035
  • Figure 172: South Asia & Pacific Market Volume (Units) Analysis by End-Use Industry, 2020-2035
  • Figure 173: South Asia & Pacific Market Value Share (%) and BPS Analysis by End-Use Industry, 2025-2035
  • Figure 174: South Asia & Pacific Market Y-o-Y Growth (%) Projections by End-Use Industry, 2025-2035
  • Figure 175: South Asia & Pacific Market Attractiveness by Machine Type, 2025-2035
  • Figure 176: South Asia & Pacific Market Attractiveness by Automation Level, 2025-2035
  • Figure 177: South Asia & Pacific Market Attractiveness by Capacity, 2025-2035
  • Figure 178: South Asia & Pacific Market Attractiveness by Application, 2025-2035
  • Figure 179: South Asia & Pacific Market Attractiveness by End-Use Industry, 2025-2035
  • Figure 180: South Asia & Pacific Market Attractiveness by Country, 2025-2035
  • Figure 181: Western Europe Market Value (USD Billion) by Machine Type, 2025-2035
  • Figure 182: Western Europe Market Value (USD Billion) by Automation Level, 2025-2035
  • Figure 183: Western Europe Market Value (USD Billion) by Capacity, 2025-2035
  • Figure 184: Western Europe Market Value (USD Billion) by Application, 2025-2035
  • Figure 185: Western Europe Market Value (USD Billion) by End-Use Industry, 2025-2035
  • Figure 186: Western Europe Market Value (USD Billion) by Country, 2025-2035
  • Figure 187: Western Europe Market Value (USD Billion) Analysis by Country, 2020-2035
  • Figure 188: Western Europe Market Volume (Units) Analysis by Country, 2020-2035
  • Figure 189: Western Europe Market Value Share (%) and BPS Analysis by Country, 2025-2035
  • Figure 190: Western Europe Market Y-o-Y Growth (%) Projections by Country, 2025-2035
  • Figure 191: Western Europe Market Value (USD Billion) Analysis by Machine Type, 2020-2035
  • Figure 192: Western Europe Market Volume (Units) Analysis by Machine Type, 2020-2035
  • Figure 193: Western Europe Market Value Share (%) and BPS Analysis by Machine Type, 2025-2035
  • Figure 194: Western Europe Market Y-o-Y Growth (%) Projections by Machine Type, 2025-2035
  • Figure 195: Western Europe Market Value (USD Billion) Analysis by Automation Level, 2020-2035
  • Figure 196: Western Europe Market Volume (Units) Analysis by Automation Level, 2020-2035
  • Figure 197: Western Europe Market Value Share (%) and BPS Analysis by Automation Level, 2025-2035
  • Figure 198: Western Europe Market Y-o-Y Growth (%) Projections by Automation Level, 2025-2035
  • Figure 199: Western Europe Market Value (USD Billion) Analysis by Capacity, 2020-2035
  • Figure 200: Western Europe Market Volume (Units) Analysis by Capacity, 2020-2035
  • Figure 201: Western Europe Market Value Share (%) and BPS Analysis by Capacity, 2025-2035
  • Figure 202: Western Europe Market Y-o-Y Growth (%) Projections by Capacity, 2025-2035
  • Figure 203: Western Europe Market Value (USD Billion) Analysis by Application, 2020-2035
  • Figure 204: Western Europe Market Volume (Units) Analysis by Application, 2020-2035
  • Figure 205: Western Europe Market Value Share (%) and BPS Analysis by Application, 2025-2035
  • Figure 206: Western Europe Market Y-o-Y Growth (%) Projections by Application, 2025-2035
  • Figure 207: Western Europe Market Value (USD Billion) Analysis by End-Use Industry, 2020-2035
  • Figure 208: Western Europe Market Volume (Units) Analysis by End-Use Industry, 2020-2035
  • Figure 209: Western Europe Market Value Share (%) and BPS Analysis by End-Use Industry, 2025-2035
  • Figure 210: Western Europe Market Y-o-Y Growth (%) Projections by End-Use Industry, 2025-2035
  • Figure 211: Western Europe Market Attractiveness by Machine Type, 2025-2035
  • Figure 212: Western Europe Market Attractiveness by Automation Level, 2025-2035
  • Figure 213: Western Europe Market Attractiveness by Capacity, 2025-2035
  • Figure 214: Western Europe Market Attractiveness by Application, 2025-2035
  • Figure 215: Western Europe Market Attractiveness by End-Use Industry, 2025-2035
  • Figure 216: Western Europe Market Attractiveness by Country, 2025-2035
  • Figure 217: Eastern Europe  Market Value (USD Billion) by Machine Type, 2025-2035
  • Figure 218: Eastern Europe  Market Value (USD Billion) by Automation Level, 2025-2035
  • Figure 219: Eastern Europe  Market Value (USD Billion) by Capacity, 2025-2035
  • Figure 220: Eastern Europe  Market Value (USD Billion) by Application, 2025-2035
  • Figure 221: Eastern Europe  Market Value (USD Billion) by End-Use Industry, 2025-2035
  • Figure 222: Eastern Europe  Market Value (USD Billion) by Country, 2025-2035
  • Figure 223: Eastern Europe  Market Value (USD Billion) Analysis by Country, 2020-2035
  • Figure 224: Eastern Europe  Market Volume (Units) Analysis by Country, 2020-2035
  • Figure 225: Eastern Europe  Market Value Share (%) and BPS Analysis by Country, 2025-2035
  • Figure 226: Eastern Europe  Market Y-o-Y Growth (%) Projections by Country, 2025-2035
  • Figure 227: Eastern Europe  Market Value (USD Billion) Analysis by Machine Type, 2020-2035
  • Figure 228: Eastern Europe  Market Volume (Units) Analysis by Machine Type, 2020-2035
  • Figure 229: Eastern Europe  Market Value Share (%) and BPS Analysis by Machine Type, 2025-2035
  • Figure 230: Eastern Europe  Market Y-o-Y Growth (%) Projections by Machine Type, 2025-2035
  • Figure 231: Eastern Europe  Market Value (USD Billion) Analysis by Automation Level, 2020-2035
  • Figure 232: Eastern Europe  Market Volume (Units) Analysis by Automation Level, 2020-2035
  • Figure 233: Eastern Europe  Market Value Share (%) and BPS Analysis by Automation Level, 2025-2035
  • Figure 234: Eastern Europe  Market Y-o-Y Growth (%) Projections by Automation Level, 2025-2035
  • Figure 235: Eastern Europe  Market Value (USD Billion) Analysis by Capacity, 2020-2035
  • Figure 236: Eastern Europe  Market Volume (Units) Analysis by Capacity, 2020-2035
  • Figure 237: Eastern Europe  Market Value Share (%) and BPS Analysis by Capacity, 2025-2035
  • Figure 238: Eastern Europe  Market Y-o-Y Growth (%) Projections by Capacity, 2025-2035
  • Figure 239: Eastern Europe  Market Value (USD Billion) Analysis by Application, 2020-2035
  • Figure 240: Eastern Europe  Market Volume (Units) Analysis by Application, 2020-2035
  • Figure 241: Eastern Europe  Market Value Share (%) and BPS Analysis by Application, 2025-2035
  • Figure 242: Eastern Europe  Market Y-o-Y Growth (%) Projections by Application, 2025-2035
  • Figure 243: Eastern Europe  Market Value (USD Billion) Analysis by End-Use Industry, 2020-2035
  • Figure 244: Eastern Europe  Market Volume (Units) Analysis by End-Use Industry, 2020-2035
  • Figure 245: Eastern Europe  Market Value Share (%) and BPS Analysis by End-Use Industry, 2025-2035
  • Figure 246: Eastern Europe  Market Y-o-Y Growth (%) Projections by End-Use Industry, 2025-2035
  • Figure 247: Eastern Europe  Market Attractiveness by Machine Type, 2025-2035
  • Figure 248: Eastern Europe  Market Attractiveness by Automation Level, 2025-2035
  • Figure 249: Eastern Europe  Market Attractiveness by Capacity, 2025-2035
  • Figure 250: Eastern Europe  Market Attractiveness by Application, 2025-2035
  • Figure 251: Eastern Europe  Market Attractiveness by End-Use Industry, 2025-2035
  • Figure 252: Eastern Europe  Market Attractiveness by Country, 2025-2035
  • Figure 253: Middle East & Africa Market Value (USD Billion) by Machine Type, 2025-2035
  • Figure 254: Middle East & Africa Market Value (USD Billion) by Automation Level, 2025-2035
  • Figure 255: Middle East & Africa Market Value (USD Billion) by Capacity, 2025-2035
  • Figure 256: Middle East & Africa Market Value (USD Billion) by Application, 2025-2035
  • Figure 257: Middle East & Africa Market Value (USD Billion) by End-Use Industry, 2025-2035
  • Figure 258: Middle East & Africa Market Value (USD Billion) by Country, 2025-2035
  • Figure 259: Middle East & Africa Market Value (USD Billion) Analysis by Country, 2020-2035
  • Figure 260: Middle East & Africa Market Volume (Units) Analysis by Country, 2020-2035
  • Figure 261: Middle East & Africa Market Value Share (%) and BPS Analysis by Country, 2025-2035
  • Figure 262: Middle East & Africa Market Y-o-Y Growth (%) Projections by Country, 2025-2035
  • Figure 263: Middle East & Africa Market Value (USD Billion) Analysis by Machine Type, 2020-2035
  • Figure 264: Middle East & Africa Market Volume (Units) Analysis by Machine Type, 2020-2035
  • Figure 265: Middle East & Africa Market Value Share (%) and BPS Analysis by Machine Type, 2025-2035
  • Figure 266: Middle East & Africa Market Y-o-Y Growth (%) Projections by Machine Type, 2025-2035
  • Figure 267: Middle East & Africa Market Value (USD Billion) Analysis by Automation Level, 2020-2035
  • Figure 268: Middle East & Africa Market Volume (Units) Analysis by Automation Level, 2020-2035
  • Figure 269: Middle East & Africa Market Value Share (%) and BPS Analysis by Automation Level, 2025-2035
  • Figure 270: Middle East & Africa Market Y-o-Y Growth (%) Projections by Automation Level, 2025-2035
  • Figure 271: Middle East & Africa Market Value (USD Billion) Analysis by Capacity, 2020-2035
  • Figure 272: Middle East & Africa Market Volume (Units) Analysis by Capacity, 2020-2035
  • Figure 273: Middle East & Africa Market Value Share (%) and BPS Analysis by Capacity, 2025-2035
  • Figure 274: Middle East & Africa Market Y-o-Y Growth (%) Projections by Capacity, 2025-2035
  • Figure 275: Middle East & Africa Market Value (USD Billion) Analysis by Application, 2020-2035
  • Figure 276: Middle East & Africa Market Volume (Units) Analysis by Application, 2020-2035
  • Figure 277: Middle East & Africa Market Value Share (%) and BPS Analysis by Application, 2025-2035
  • Figure 278: Middle East & Africa Market Y-o-Y Growth (%) Projections by Application, 2025-2035
  • Figure 279: Middle East & Africa Market Value (USD Billion) Analysis by End-Use Industry, 2020-2035
  • Figure 280: Middle East & Africa Market Volume (Units) Analysis by End-Use Industry, 2020-2035
  • Figure 281: Middle East & Africa Market Value Share (%) and BPS Analysis by End-Use Industry, 2025-2035
  • Figure 282: Middle East & Africa Market Y-o-Y Growth (%) Projections by End-Use Industry, 2025-2035
  • Figure 283: Middle East & Africa Market Attractiveness by Machine Type, 2025-2035
  • Figure 284: Middle East & Africa Market Attractiveness by Automation Level, 2025-2035
  • Figure 285: Middle East & Africa Market Attractiveness by Capacity, 2025-2035
  • Figure 286: Middle East & Africa Market Attractiveness by Application, 2025-2035
  • Figure 287: Middle East & Africa Market Attractiveness by End-Use Industry, 2025-2035
  • Figure 288: Middle East & Africa Market Attractiveness by Country, 2025-2035

Frequently Asked Questions

How big is the pill pressing machine market in 2025?

The global pill pressing machine market is estimated to be valued at USD 2.8 billion in 2025.

What will be the size of the pill pressing machine market in 2035?

The market size for the pill pressing machine market is projected to reach USD 4.6 billion by 2035.

How much will be the pill pressing machine market growth between 2025 and 2035?

The pill pressing machine market is expected to grow at a CAGR of 5.1% between 2025 and 2035.

What are the key automation levels in the pill pressing machine market?

The key automation levels in the pill pressing machine market include manual, semi-automatic, and fully automatic pill press machines.

Which automation level segment is expected to contribute significant share in the pill pressing machine market in 2025?

The fully automatic pill press machines segment is projected to account for the highest share of 44.5% in the pill pressing machine market in 2025.

Explore Similar Insights

Future Market Insights

Pill Pressing Machine Market

Chat With

MaRIA

Hi There, I am MaRIA, Your Market Research Intelligence Assistant. How may I help you?