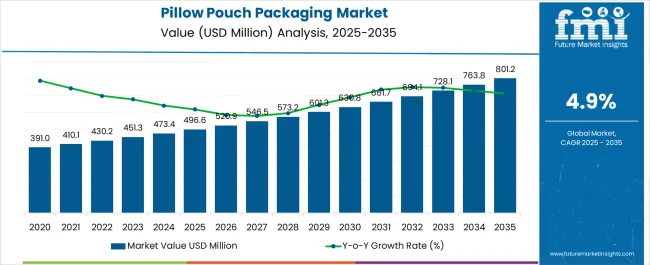
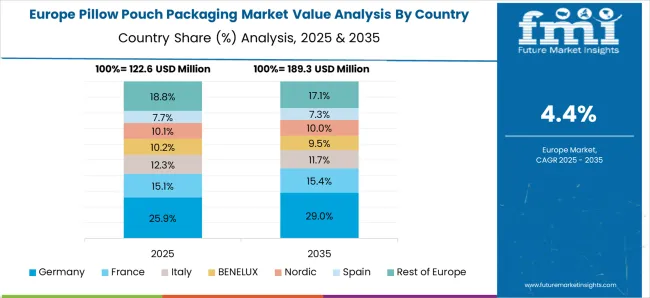
The pillow pouch packaging market size is estimated to be valued at USD 473.4 million in 2024. The market is estimated to cross a valuation of USD 763.9 million by 2034.
Market analysis suggests that the trend of choosing flexible pillow packaging is driven by consumer preferences for lightweight, easily transportable, and visually appealing packaging.
The demand for pillow pouch packaging is likely to expand at a moderate CAGR of 4.9% from 2024 to 2034. The sales analysis indicates a positive outlook for the pillow pouch packaging industry, with potential for further growth as enterprises continue to recognize the benefits of this packaging solution.
Attributes | Details |
---|---|
Pillow Pouch Packaging Market Value for 2024 | USD 473.4 million |
Pillow Pouch Packaging Market Value for 2034 | USD 763.9 million |
Pillow Pouch Packaging Market Forecast CAGR for 2024 to 2034 | 4.9% |
CAGR from 2019 to 2023 | 4.0% |
---|---|
CAGR from 2024 to 2034 | 4.9% |
This section discusses the CAGR for the pillow pouch packaging market over two distinct periods. From 2019 to 2023, the CAGR is 4.0%, indicating a steady but moderate growth trend during this initial timeframe. Moving forward, the CAGR from 2024 to 2034 is projected to increase to 4.9%, signaling an acceleration in the market's growth rate over the long term.
Short-term Analysis of the Pillow Pouch Packaging Market from 2019 to 2023
2019 | USD 386.4 million |
---|---|
2023 | USD 451.2 million |
Witnessing a swift rise, the pillow pouch packaging industry surged from USD 386.4 million in 2019 to USD 451.2 million in 2023. The sales growth was primarily due:
Mid-term Analysis of Pillow Pouch Packaging Market from 2024 to 2029
2024 | USD 473.4 million |
---|---|
2029 | USD 600.85 million |
Maintaining sustained growth, the market value is expected to climb from USD 473.4 million in 2024 to USD 600.85 million in 2029. The demand is likely to rise due to:
Long-term Analysis of the Pillow Pouch Packaging Market from 2029 to 2034
2029 | USD 600.85 million |
---|---|
2034 | USD 763.9 million |
The market is anticipated to reach USD 763.9 million in 2034 from USD 600.85 million in 2029. The adoption of pillow packaging is anticipated to rise due to:
The market is witnessing a significant shift toward sustainable packaging solutions, driven by consumer demand for eco-friendly options. Manufacturers increasingly incorporate recyclable and biodegradable materials, aligning with global environmental consciousness.
The industry is integrating smart packaging features into pillow pouch packaging designs. This includes interactive labels, QR codes, and other innovations to enhance user engagement, traceability, and product information accessibility.
Brands are leveraging pillow pouch packaging as a canvas for creative and customized packaging designs. This trend caters to the growing importance of brand identity, with companies using unique shapes, colors, and graphics to distinguish their products and enhance consumer recognition.
With the rise of online shopping, pillow pouch packaging is adapting to the specific requirements of eCommerce packaging. This includes features like tamper-evident seals and durable materials to ensure product integrity during shipping, reflecting the nature of modern retail.
Pillow pouches are increasingly chosen for packaging health and wellness products. The pouch design allows convenient and precise portioning, appealing to consumers seeking on-the-go, portion-controlled, and health-conscious packaging solutions.
Globalization is influencing pillow pouch packaging designs and material choices. Manufacturers are considering regional preferences, cultural aesthetics, and regulatory standards, leading to various pillow pouch packaging options tailored to specific market demands.
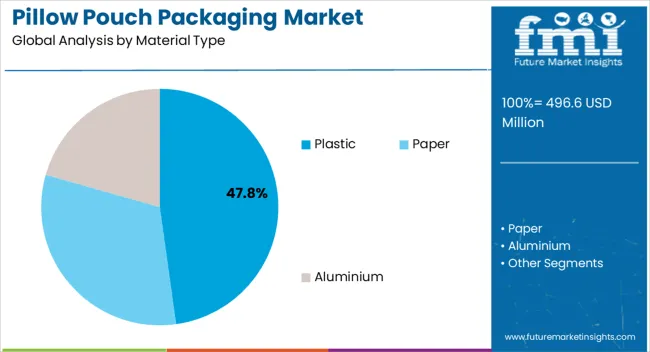
The section discusses various pillow pouch packaging market segments, offering industry players valuable details to inform strategic decisions. By breaking down the key categories, the section sheds light on the dominance of plastic, which holds a commanding market share of 55.80% in 2024.
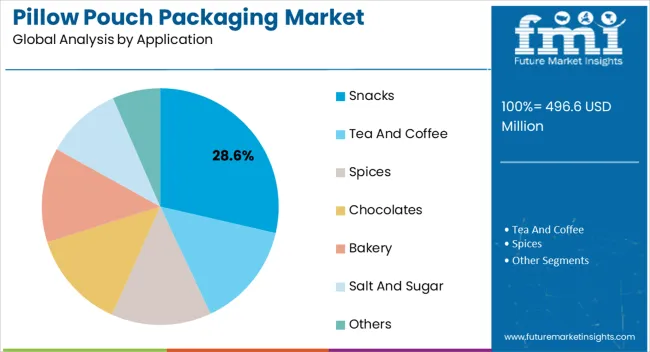
This insight is crucial for manufacturers and suppliers to align their production with prevailing market preferences. Additionally, the focus on the top application reveals that snacks occupy a significant space in the market, capturing a substantial share of 48.90% in 2024.
Attributes | Details |
---|---|
By Material Type | Plastic |
Market Share in 2024 | 55.80% |
Plastic emerges as the go-to material for pillow pouch packaging, resonating with market preferences:
Attributes | Details |
---|---|
Top Application | Snacks |
Market Share in 2024 | 48.90% |
The impressive 48.90% market share mirrors the booming trend of increased consumer snacking, promoting pillow pouch packaging for snacks as a go-to choice for manufacturers.
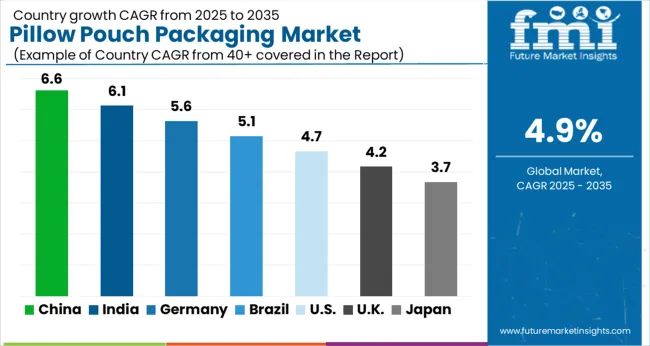
This section analyzes the pillow pouch packaging industry by countries, including the United States, Germany, Japan, Australia, China, India, and the United Kingdom. The table presents the CAGR for each country, indicating the expected growth of the pillow pouch packaging industry in that country through 2034.
Countries | CAGR through 2034 |
---|---|
United States | 4.40% |
Germany | 3.10% |
Japan | 2.50% |
Australia | 3.90% |
China | 6.50% |
India | 7.40% |
United Kingdom | 2.70% |
The pillow pouch packaging industry in the United States is expected to rise at a steady CAGR of 4.40% through 2034.
Germany's pillow pouch packaging industry is expected to grow sluggishly by 3.10% through 2034. However, by observing the shifting demand patterns in Germany, there are chances of growth.
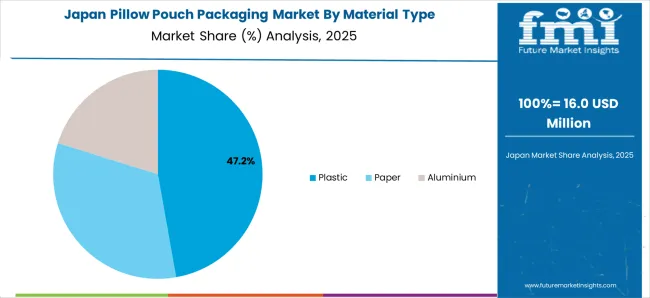
The pillow pouch packaging industry in Japan is expected to witness a moderate CAGR of 2.50% through 2034. The forecast predicts that sales are likely to witness a spike as:
The pillow pouch packaging industry in Australia is expected to witness a steady CAGR of 3.90% through 2034.
China's pillow pouch packaging industry is expected to grow by 6.50% through 2034.
The demand for pillow pouch packaging in India is anticipated to rise at a CAGR of 7.40% through 2034.
The pillow pouch packaging industry in the United Kingdom is expected to witness a CAGR of 2.70% through 2034. The growth rate may be moderate, but things could get interesting for manufacturers as:
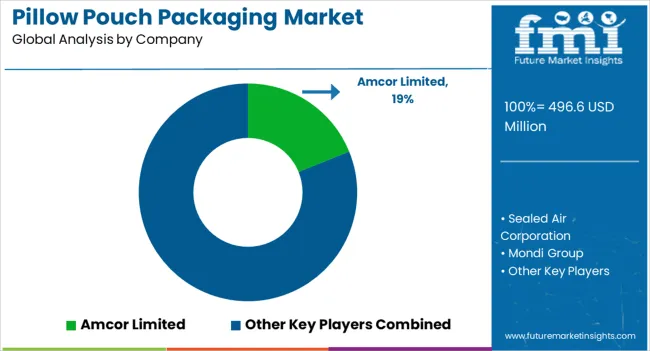
Pillow pouch manufacturers are doubling down on their leadership by employing a range of strategic initiatives. To address the diverse packaging needs of various industries and consumer preferences, they are expanding their product portfolios to include a wider variety of pouch sizes, materials, and features.
For instance, they introduce pillow pouch packaging made from recyclable materials, offer convenient pillow-style bags for easy storage, and incorporate eye-catching designs to enhance product appeal.
Moreover, these manufacturers are investing heavily in research and development to create innovative pillow pouch packaging solutions that are more sustainable, efficient, and appealing to consumers. For example, they are developing pouches with improved barrier properties to extend product shelf life, exploring sustainable alternatives to traditional plastic films, and incorporating smart packaging technologies to track product freshness and provide consumer information.
To reach a broader customer base, pillow pouch packaging manufacturers are strengthening their distribution channels domestically and internationally.
They are forging partnerships with eCommerce platforms to expand their online presence, collaborating with retail chains to ensure their products are readily available at brick-and-mortar stores, and partnering with food service providers to cater to the growing demand for convenient and sustainable packaging solutions in the food service industry.
Recent Developments in the Pillow Pouch Packaging Industry:
Table 1: Global Market Value (US$ million) Forecast by Region, 2019 to 2034
Table 2: Global Market Volume (Units) Forecast by Region, 2019 to 2034
Table 3: Global Market Value (US$ million) Forecast by Material Type, 2019 to 2034
Table 4: Global Market Volume (Units) Forecast by Material Type, 2019 to 2034
Table 5: Global Market Value (US$ million) Forecast by Capacity, 2019 to 2034
Table 6: Global Market Volume (Units) Forecast by Capacity, 2019 to 2034
Table 7: Global Market Value (US$ million) Forecast by End-use, 2019 to 2034
Table 8: Global Market Volume (Units) Forecast by End-use, 2019 to 2034
Table 9: North America Market Value (US$ million) Forecast by Country, 2019 to 2034
Table 10: North America Market Volume (Units) Forecast by Country, 2019 to 2034
Table 11: North America Market Value (US$ million) Forecast by Material Type, 2019 to 2034
Table 12: North America Market Volume (Units) Forecast by Material Type, 2019 to 2034
Table 13: North America Market Value (US$ million) Forecast by Capacity, 2019 to 2034
Table 14: North America Market Volume (Units) Forecast by Capacity, 2019 to 2034
Table 15: North America Market Value (US$ million) Forecast by End-use, 2019 to 2034
Table 16: North America Market Volume (Units) Forecast by End-use, 2019 to 2034
Table 17: Latin America Market Value (US$ million) Forecast by Country, 2019 to 2034
Table 18: Latin America Market Volume (Units) Forecast by Country, 2019 to 2034
Table 19: Latin America Market Value (US$ million) Forecast by Material Type, 2019 to 2034
Table 20: Latin America Market Volume (Units) Forecast by Material Type, 2019 to 2034
Table 21: Latin America Market Value (US$ million) Forecast by Capacity, 2019 to 2034
Table 22: Latin America Market Volume (Units) Forecast by Capacity, 2019 to 2034
Table 23: Latin America Market Value (US$ million) Forecast by End-use, 2019 to 2034
Table 24: Latin America Market Volume (Units) Forecast by End-use, 2019 to 2034
Table 25: Europe Market Value (US$ million) Forecast by Country, 2019 to 2034
Table 26: Europe Market Volume (Units) Forecast by Country, 2019 to 2034
Table 27: Europe Market Value (US$ million) Forecast by Material Type, 2019 to 2034
Table 28: Europe Market Volume (Units) Forecast by Material Type, 2019 to 2034
Table 29: Europe Market Value (US$ million) Forecast by Capacity, 2019 to 2034
Table 30: Europe Market Volume (Units) Forecast by Capacity, 2019 to 2034
Table 31: Europe Market Value (US$ million) Forecast by End-use, 2019 to 2034
Table 32: Europe Market Volume (Units) Forecast by End-use, 2019 to 2034
Table 33: East Asia Market Value (US$ million) Forecast by Country, 2019 to 2034
Table 34: East Asia Market Volume (Units) Forecast by Country, 2019 to 2034
Table 35: East Asia Market Value (US$ million) Forecast by Material Type, 2019 to 2034
Table 36: East Asia Market Volume (Units) Forecast by Material Type, 2019 to 2034
Table 37: East Asia Market Value (US$ million) Forecast by Capacity, 2019 to 2034
Table 38: East Asia Market Volume (Units) Forecast by Capacity, 2019 to 2034
Table 39: East Asia Market Value (US$ million) Forecast by End-use, 2019 to 2034
Table 40: East Asia Market Volume (Units) Forecast by End-use, 2019 to 2034
Table 41: South Asia Market Value (US$ million) Forecast by Country, 2019 to 2034
Table 42: South Asia Market Volume (Units) Forecast by Country, 2019 to 2034
Table 43: South Asia Market Value (US$ million) Forecast by Material Type, 2019 to 2034
Table 44: South Asia Market Volume (Units) Forecast by Material Type, 2019 to 2034
Table 45: South Asia Market Value (US$ million) Forecast by Capacity, 2019 to 2034
Table 46: South Asia Market Volume (Units) Forecast by Capacity, 2019 to 2034
Table 47: South Asia Market Value (US$ million) Forecast by End-use, 2019 to 2034
Table 48: South Asia Market Volume (Units) Forecast by End-use, 2019 to 2034
Table 49: Oceania Market Value (US$ million) Forecast by Country, 2019 to 2034
Table 50: Oceania Market Volume (Units) Forecast by Country, 2019 to 2034
Table 51: Oceania Market Value (US$ million) Forecast by Material Type, 2019 to 2034
Table 52: Oceania Market Volume (Units) Forecast by Material Type, 2019 to 2034
Table 53: Oceania Market Value (US$ million) Forecast by Capacity, 2019 to 2034
Table 54: Oceania Market Volume (Units) Forecast by Capacity, 2019 to 2034
Table 55: Oceania Market Value (US$ million) Forecast by End-use, 2019 to 2034
Table 56: Oceania Market Volume (Units) Forecast by End-use, 2019 to 2034
Table 57: MEA Market Value (US$ million) Forecast by Country, 2019 to 2034
Table 58: MEA Market Volume (Units) Forecast by Country, 2019 to 2034
Table 59: MEA Market Value (US$ million) Forecast by Material Type, 2019 to 2034
Table 60: MEA Market Volume (Units) Forecast by Material Type, 2019 to 2034
Table 61: MEA Market Value (US$ million) Forecast by Capacity, 2019 to 2034
Table 62: MEA Market Volume (Units) Forecast by Capacity, 2019 to 2034
Table 63: MEA Market Value (US$ million) Forecast by End-use, 2019 to 2034
Table 64: MEA Market Volume (Units) Forecast by End-use, 2019 to 2034
Figure 1: Global Market Value (US$ million) by Material Type, 2024 to 2034
Figure 2: Global Market Value (US$ million) by Capacity, 2024 to 2034
Figure 3: Global Market Value (US$ million) by End-use, 2024 to 2034
Figure 4: Global Market Value (US$ million) by Region, 2024 to 2034
Figure 5: Global Market Value (US$ million) Analysis by Region, 2019 to 2034
Figure 6: Global Market Volume (Units) Analysis by Region, 2019 to 2034
Figure 7: Global Market Value Share (%) and BPS Analysis by Region, 2024 to 2034
Figure 8: Global Market Y-o-Y Growth (%) Projections by Region, 2024 to 2034
Figure 9: Global Market Value (US$ million) Analysis by Material Type, 2019 to 2034
Figure 10: Global Market Volume (Units) Analysis by Material Type, 2019 to 2034
Figure 11: Global Market Value Share (%) and BPS Analysis by Material Type, 2024 to 2034
Figure 12: Global Market Y-o-Y Growth (%) Projections by Material Type, 2024 to 2034
Figure 13: Global Market Value (US$ million) Analysis by Capacity, 2019 to 2034
Figure 14: Global Market Volume (Units) Analysis by Capacity, 2019 to 2034
Figure 15: Global Market Value Share (%) and BPS Analysis by Capacity, 2024 to 2034
Figure 16: Global Market Y-o-Y Growth (%) Projections by Capacity, 2024 to 2034
Figure 17: Global Market Value (US$ million) Analysis by End-use, 2019 to 2034
Figure 18: Global Market Volume (Units) Analysis by End-use, 2019 to 2034
Figure 19: Global Market Value Share (%) and BPS Analysis by End-use, 2024 to 2034
Figure 20: Global Market Y-o-Y Growth (%) Projections by End-use, 2024 to 2034
Figure 21: Global Market Attractiveness by Material Type, 2024 to 2034
Figure 22: Global Market Attractiveness by Capacity, 2024 to 2034
Figure 23: Global Market Attractiveness by End-use, 2024 to 2034
Figure 24: Global Market Attractiveness by Region, 2024 to 2034
Figure 25: North America Market Value (US$ million) by Material Type, 2024 to 2034
Figure 26: North America Market Value (US$ million) by Capacity, 2024 to 2034
Figure 27: North America Market Value (US$ million) by End-use, 2024 to 2034
Figure 28: North America Market Value (US$ million) by Country, 2024 to 2034
Figure 29: North America Market Value (US$ million) Analysis by Country, 2019 to 2034
Figure 30: North America Market Volume (Units) Analysis by Country, 2019 to 2034
Figure 31: North America Market Value Share (%) and BPS Analysis by Country, 2024 to 2034
Figure 32: North America Market Y-o-Y Growth (%) Projections by Country, 2024 to 2034
Figure 33: North America Market Value (US$ million) Analysis by Material Type, 2019 to 2034
Figure 34: North America Market Volume (Units) Analysis by Material Type, 2019 to 2034
Figure 35: North America Market Value Share (%) and BPS Analysis by Material Type, 2024 to 2034
Figure 36: North America Market Y-o-Y Growth (%) Projections by Material Type, 2024 to 2034
Figure 37: North America Market Value (US$ million) Analysis by Capacity, 2019 to 2034
Figure 38: North America Market Volume (Units) Analysis by Capacity, 2019 to 2034
Figure 39: North America Market Value Share (%) and BPS Analysis by Capacity, 2024 to 2034
Figure 40: North America Market Y-o-Y Growth (%) Projections by Capacity, 2024 to 2034
Figure 41: North America Market Value (US$ million) Analysis by End-use, 2019 to 2034
Figure 42: North America Market Volume (Units) Analysis by End-use, 2019 to 2034
Figure 43: North America Market Value Share (%) and BPS Analysis by End-use, 2024 to 2034
Figure 44: North America Market Y-o-Y Growth (%) Projections by End-use, 2024 to 2034
Figure 45: North America Market Attractiveness by Material Type, 2024 to 2034
Figure 46: North America Market Attractiveness by Capacity, 2024 to 2034
Figure 47: North America Market Attractiveness by End-use, 2024 to 2034
Figure 48: North America Market Attractiveness by Country, 2024 to 2034
Figure 49: Latin America Market Value (US$ million) by Material Type, 2024 to 2034
Figure 50: Latin America Market Value (US$ million) by Capacity, 2024 to 2034
Figure 51: Latin America Market Value (US$ million) by End-use, 2024 to 2034
Figure 52: Latin America Market Value (US$ million) by Country, 2024 to 2034
Figure 53: Latin America Market Value (US$ million) Analysis by Country, 2019 to 2034
Figure 54: Latin America Market Volume (Units) Analysis by Country, 2019 to 2034
Figure 55: Latin America Market Value Share (%) and BPS Analysis by Country, 2024 to 2034
Figure 56: Latin America Market Y-o-Y Growth (%) Projections by Country, 2024 to 2034
Figure 57: Latin America Market Value (US$ million) Analysis by Material Type, 2019 to 2034
Figure 58: Latin America Market Volume (Units) Analysis by Material Type, 2019 to 2034
Figure 59: Latin America Market Value Share (%) and BPS Analysis by Material Type, 2024 to 2034
Figure 60: Latin America Market Y-o-Y Growth (%) Projections by Material Type, 2024 to 2034
Figure 61: Latin America Market Value (US$ million) Analysis by Capacity, 2019 to 2034
Figure 62: Latin America Market Volume (Units) Analysis by Capacity, 2019 to 2034
Figure 63: Latin America Market Value Share (%) and BPS Analysis by Capacity, 2024 to 2034
Figure 64: Latin America Market Y-o-Y Growth (%) Projections by Capacity, 2024 to 2034
Figure 65: Latin America Market Value (US$ million) Analysis by End-use, 2019 to 2034
Figure 66: Latin America Market Volume (Units) Analysis by End-use, 2019 to 2034
Figure 67: Latin America Market Value Share (%) and BPS Analysis by End-use, 2024 to 2034
Figure 68: Latin America Market Y-o-Y Growth (%) Projections by End-use, 2024 to 2034
Figure 69: Latin America Market Attractiveness by Material Type, 2024 to 2034
Figure 70: Latin America Market Attractiveness by Capacity, 2024 to 2034
Figure 71: Latin America Market Attractiveness by End-use, 2024 to 2034
Figure 72: Latin America Market Attractiveness by Country, 2024 to 2034
Figure 73: Europe Market Value (US$ million) by Material Type, 2024 to 2034
Figure 74: Europe Market Value (US$ million) by Capacity, 2024 to 2034
Figure 75: Europe Market Value (US$ million) by End-use, 2024 to 2034
Figure 76: Europe Market Value (US$ million) by Country, 2024 to 2034
Figure 77: Europe Market Value (US$ million) Analysis by Country, 2019 to 2034
Figure 78: Europe Market Volume (Units) Analysis by Country, 2019 to 2034
Figure 79: Europe Market Value Share (%) and BPS Analysis by Country, 2024 to 2034
Figure 80: Europe Market Y-o-Y Growth (%) Projections by Country, 2024 to 2034
Figure 81: Europe Market Value (US$ million) Analysis by Material Type, 2019 to 2034
Figure 82: Europe Market Volume (Units) Analysis by Material Type, 2019 to 2034
Figure 83: Europe Market Value Share (%) and BPS Analysis by Material Type, 2024 to 2034
Figure 84: Europe Market Y-o-Y Growth (%) Projections by Material Type, 2024 to 2034
Figure 85: Europe Market Value (US$ million) Analysis by Capacity, 2019 to 2034
Figure 86: Europe Market Volume (Units) Analysis by Capacity, 2019 to 2034
Figure 87: Europe Market Value Share (%) and BPS Analysis by Capacity, 2024 to 2034
Figure 88: Europe Market Y-o-Y Growth (%) Projections by Capacity, 2024 to 2034
Figure 89: Europe Market Value (US$ million) Analysis by End-use, 2019 to 2034
Figure 90: Europe Market Volume (Units) Analysis by End-use, 2019 to 2034
Figure 91: Europe Market Value Share (%) and BPS Analysis by End-use, 2024 to 2034
Figure 92: Europe Market Y-o-Y Growth (%) Projections by End-use, 2024 to 2034
Figure 93: Europe Market Attractiveness by Material Type, 2024 to 2034
Figure 94: Europe Market Attractiveness by Capacity, 2024 to 2034
Figure 95: Europe Market Attractiveness by End-use, 2024 to 2034
Figure 96: Europe Market Attractiveness by Country, 2024 to 2034
Figure 97: East Asia Market Value (US$ million) by Material Type, 2024 to 2034
Figure 98: East Asia Market Value (US$ million) by Capacity, 2024 to 2034
Figure 99: East Asia Market Value (US$ million) by End-use, 2024 to 2034
Figure 100: East Asia Market Value (US$ million) by Country, 2024 to 2034
Figure 101: East Asia Market Value (US$ million) Analysis by Country, 2019 to 2034
Figure 102: East Asia Market Volume (Units) Analysis by Country, 2019 to 2034
Figure 103: East Asia Market Value Share (%) and BPS Analysis by Country, 2024 to 2034
Figure 104: East Asia Market Y-o-Y Growth (%) Projections by Country, 2024 to 2034
Figure 105: East Asia Market Value (US$ million) Analysis by Material Type, 2019 to 2034
Figure 106: East Asia Market Volume (Units) Analysis by Material Type, 2019 to 2034
Figure 107: East Asia Market Value Share (%) and BPS Analysis by Material Type, 2024 to 2034
Figure 108: East Asia Market Y-o-Y Growth (%) Projections by Material Type, 2024 to 2034
Figure 109: East Asia Market Value (US$ million) Analysis by Capacity, 2019 to 2034
Figure 110: East Asia Market Volume (Units) Analysis by Capacity, 2019 to 2034
Figure 111: East Asia Market Value Share (%) and BPS Analysis by Capacity, 2024 to 2034
Figure 112: East Asia Market Y-o-Y Growth (%) Projections by Capacity, 2024 to 2034
Figure 113: East Asia Market Value (US$ million) Analysis by End-use, 2019 to 2034
Figure 114: East Asia Market Volume (Units) Analysis by End-use, 2019 to 2034
Figure 115: East Asia Market Value Share (%) and BPS Analysis by End-use, 2024 to 2034
Figure 116: East Asia Market Y-o-Y Growth (%) Projections by End-use, 2024 to 2034
Figure 117: East Asia Market Attractiveness by Material Type, 2024 to 2034
Figure 118: East Asia Market Attractiveness by Capacity, 2024 to 2034
Figure 119: East Asia Market Attractiveness by End-use, 2024 to 2034
Figure 120: East Asia Market Attractiveness by Country, 2024 to 2034
Figure 121: South Asia Market Value (US$ million) by Material Type, 2024 to 2034
Figure 122: South Asia Market Value (US$ million) by Capacity, 2024 to 2034
Figure 123: South Asia Market Value (US$ million) by End-use, 2024 to 2034
Figure 124: South Asia Market Value (US$ million) by Country, 2024 to 2034
Figure 125: South Asia Market Value (US$ million) Analysis by Country, 2019 to 2034
Figure 126: South Asia Market Volume (Units) Analysis by Country, 2019 to 2034
Figure 127: South Asia Market Value Share (%) and BPS Analysis by Country, 2024 to 2034
Figure 128: South Asia Market Y-o-Y Growth (%) Projections by Country, 2024 to 2034
Figure 129: South Asia Market Value (US$ million) Analysis by Material Type, 2019 to 2034
Figure 130: South Asia Market Volume (Units) Analysis by Material Type, 2019 to 2034
Figure 131: South Asia Market Value Share (%) and BPS Analysis by Material Type, 2024 to 2034
Figure 132: South Asia Market Y-o-Y Growth (%) Projections by Material Type, 2024 to 2034
Figure 133: South Asia Market Value (US$ million) Analysis by Capacity, 2019 to 2034
Figure 134: South Asia Market Volume (Units) Analysis by Capacity, 2019 to 2034
Figure 135: South Asia Market Value Share (%) and BPS Analysis by Capacity, 2024 to 2034
Figure 136: South Asia Market Y-o-Y Growth (%) Projections by Capacity, 2024 to 2034
Figure 137: South Asia Market Value (US$ million) Analysis by End-use, 2019 to 2034
Figure 138: South Asia Market Volume (Units) Analysis by End-use, 2019 to 2034
Figure 139: South Asia Market Value Share (%) and BPS Analysis by End-use, 2024 to 2034
Figure 140: South Asia Market Y-o-Y Growth (%) Projections by End-use, 2024 to 2034
Figure 141: South Asia Market Attractiveness by Material Type, 2024 to 2034
Figure 142: South Asia Market Attractiveness by Capacity, 2024 to 2034
Figure 143: South Asia Market Attractiveness by End-use, 2024 to 2034
Figure 144: South Asia Market Attractiveness by Country, 2024 to 2034
Figure 145: Oceania Market Value (US$ million) by Material Type, 2024 to 2034
Figure 146: Oceania Market Value (US$ million) by Capacity, 2024 to 2034
Figure 147: Oceania Market Value (US$ million) by End-use, 2024 to 2034
Figure 148: Oceania Market Value (US$ million) by Country, 2024 to 2034
Figure 149: Oceania Market Value (US$ million) Analysis by Country, 2019 to 2034
Figure 150: Oceania Market Volume (Units) Analysis by Country, 2019 to 2034
Figure 151: Oceania Market Value Share (%) and BPS Analysis by Country, 2024 to 2034
Figure 152: Oceania Market Y-o-Y Growth (%) Projections by Country, 2024 to 2034
Figure 153: Oceania Market Value (US$ million) Analysis by Material Type, 2019 to 2034
Figure 154: Oceania Market Volume (Units) Analysis by Material Type, 2019 to 2034
Figure 155: Oceania Market Value Share (%) and BPS Analysis by Material Type, 2024 to 2034
Figure 156: Oceania Market Y-o-Y Growth (%) Projections by Material Type, 2024 to 2034
Figure 157: Oceania Market Value (US$ million) Analysis by Capacity, 2019 to 2034
Figure 158: Oceania Market Volume (Units) Analysis by Capacity, 2019 to 2034
Figure 159: Oceania Market Value Share (%) and BPS Analysis by Capacity, 2024 to 2034
Figure 160: Oceania Market Y-o-Y Growth (%) Projections by Capacity, 2024 to 2034
Figure 161: Oceania Market Value (US$ million) Analysis by End-use, 2019 to 2034
Figure 162: Oceania Market Volume (Units) Analysis by End-use, 2019 to 2034
Figure 163: Oceania Market Value Share (%) and BPS Analysis by End-use, 2024 to 2034
Figure 164: Oceania Market Y-o-Y Growth (%) Projections by End-use, 2024 to 2034
Figure 165: Oceania Market Attractiveness by Material Type, 2024 to 2034
Figure 166: Oceania Market Attractiveness by Capacity, 2024 to 2034
Figure 167: Oceania Market Attractiveness by End-use, 2024 to 2034
Figure 168: Oceania Market Attractiveness by Country, 2024 to 2034
Figure 169: MEA Market Value (US$ million) by Material Type, 2024 to 2034
Figure 170: MEA Market Value (US$ million) by Capacity, 2024 to 2034
Figure 171: MEA Market Value (US$ million) by End-use, 2024 to 2034
Figure 172: MEA Market Value (US$ million) by Country, 2024 to 2034
Figure 173: MEA Market Value (US$ million) Analysis by Country, 2019 to 2034
Figure 174: MEA Market Volume (Units) Analysis by Country, 2019 to 2034
Figure 175: MEA Market Value Share (%) and BPS Analysis by Country, 2024 to 2034
Figure 176: MEA Market Y-o-Y Growth (%) Projections by Country, 2024 to 2034
Figure 177: MEA Market Value (US$ million) Analysis by Material Type, 2019 to 2034
Figure 178: MEA Market Volume (Units) Analysis by Material Type, 2019 to 2034
Figure 179: MEA Market Value Share (%) and BPS Analysis by Material Type, 2024 to 2034
Figure 180: MEA Market Y-o-Y Growth (%) Projections by Material Type, 2024 to 2034
Figure 181: MEA Market Value (US$ million) Analysis by Capacity, 2019 to 2034
Figure 182: MEA Market Volume (Units) Analysis by Capacity, 2019 to 2034
Figure 183: MEA Market Value Share (%) and BPS Analysis by Capacity, 2024 to 2034
Figure 184: MEA Market Y-o-Y Growth (%) Projections by Capacity, 2024 to 2034
Figure 185: MEA Market Value (US$ million) Analysis by End-use, 2019 to 2034
Figure 186: MEA Market Volume (Units) Analysis by End-use, 2019 to 2034
Figure 187: MEA Market Value Share (%) and BPS Analysis by End-use, 2024 to 2034
Figure 188: MEA Market Y-o-Y Growth (%) Projections by End-use, 2024 to 2034
Figure 189: MEA Market Attractiveness by Material Type, 2024 to 2034
Figure 190: MEA Market Attractiveness by Capacity, 2024 to 2034
Figure 191: MEA Market Attractiveness by End-use, 2024 to 2034
Figure 192: MEA Market Attractiveness by Country, 2024 to 2034
The pillow pouch packaging market is projected to expand at a CAGR of 4.9% between 2024 and 2034.
The snack packaging segment dominates the pillow pouch packaging market.
Amcor Limited, Sealed Air Corporation, and Mondi Group are top pillow pouch packaging manufacturers.
The pillow pouch packaging market is anticipated to surpass USD 763.9 million by 2034.
Convenience, portability, and adaptability to diverse products fueling the demand for pillow pouch packaging.
The increasing demand for sustainable packaging options and eco-friendly materials is propelling the sales of paper pillow pouch packaging.
Explore Packaging Formats Insights
Thank you!
You will receive an email from our Business Development Manager. Please be sure to check your SPAM/JUNK folder too.