Pollution-Fighting Urban Skincare Market Size and Share Forecast Outlook 2025 to 2035

A valuation of USD 3,002.5 million has been projected for the Pollution-Fighting Urban Skincare Market in 2025, while the market is expected to advance to USD 9,405.6 million by 2035. This expansion reflects an increase of USD 6,403.1 million over the decade, equivalent to a threefold rise. A CAGR of 12.1% is anticipated during the period, underscoring the steady pace of adoption as pollution-linked skincare concerns intensify worldwide.
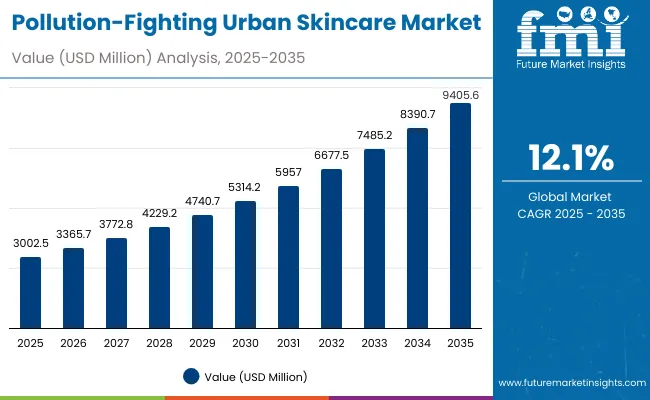
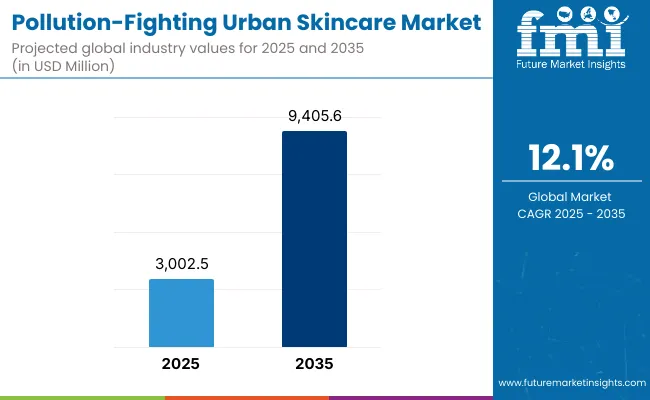
Pollution Fighting Urban Skincare Market Value Analysis

Quick Stats For Pollution-Fighting Urban Skincare Market

  • Market Value (2025): USD 3,002.5 million
  • Forecast Value (2035): USD 9,405.6 million
  • Forecast CAGR (2025 to 2035): 12.1%
  • Leading Segment in 2025: SPF-included claims (55.7%)
  • Key Growth Regions: China, India, United States, Germany, Japan
  • Top Key Players: Clarins, L’Oréal, Estée Lauder, Shiseido, The Body Shop, Innisfree, Clinique, Kiehl’s, Laneige, Olay

Pollution Fighting Urban Skincare Market

Pollution-Fighting Urban Skincare Market Key Takeaways

Metric Value
Pollution-Fighting Urban Skincare Market Estimated Value In (2025E) USD 3,002.5 million
Pollution-Fighting Urban Skincare Market Forecast Value In (2035F) USD 9,405.6 million
Forecast CAGR (2025 to 2035) 12.1%

Between 2025 and 2030, the market is set to grow from USD 3,002.5 million to USD 5,314.2 million, adding USD 2,311.7 million in value. This first half of the forecast period will account for 36% of overall decade growth. Demand will be shaped by rising consumer awareness of pollution-induced skin damage, coupled with regulatory emphasis on protective skincare formulations.

During this phase, SPF-included claims are expected to dominate with a 55.7% share, reflecting the growing appeal of multifunctional protection. Anti-pollution shield and antioxidant-based solutions will also lead by function with a 54.5% share in 2025, setting the tone for functional dominance.

In the second half, from 2030 to 2035, market revenues are forecast to expand further by USD 4,091.4 million, representing 64% of decade growth. The surge will be powered by accelerating demand in Asia-Pacific markets, particularly China and India, where CAGR levels are projected at 20.5% and 23.6% respectively. Expanding e-commerce penetration, premium beauty retail, and increased preference for scientifically validated formulations

From 2020 to 2024, the market expanded steadily as pollution-driven skincare awareness gained momentum across major urban centers. By 2025, demand for multi-protection products is projected to strengthen, with SPF-included claims and anti-pollution antioxidant shields anchoring the largest shares. Between 2025 and 2030, significant acceleration is anticipated in China and India, where CAGRs of 20.5% and 23.6% respectively are forecast, highlighting Asia-Pacific as the fastest-growing region.

By 2035, the market is expected to more than triple, powered by rising disposable incomes, evolving beauty routines, and heightened consumer demand for scientifically validated protective solutions. Competitive intensity will remain high, as established brands enhance portfolios with antioxidant complexes and sustainability-focused claims. The long-term advantage is likely to be defined not just by brand recognition but by innovation in multifunctional actives, digital consumer engagement, and clinical validation.

Why the Pollution-Fighting Urban Skincare Market is growing?

The growth of the Pollution-Fighting Urban Skincare Market is being fueled by rising awareness of environmental stressors and their adverse impact on skin health. Increasing levels of urban air pollution, combined with heightened concerns over particulate matter such as PM2.5, have elevated consumer demand for preventative skincare solutions.

Advances in active ingredient systems, including antioxidants, vitamin complexes, and bioactive proteins, are being adopted to provide multi-layered defense. Strong preference for SPF-included claims reflects the desire for convenience, as multifunctional products that combine sun and pollution protection are being prioritized.

Rapid expansion in Asia-Pacific, particularly in China and India, is being supported by urbanization, disposable income growth, and higher pollution exposure. E-commerce penetration and digital-first retail channels are further accelerating accessibility and adoption. Continued clinical validation and alignment with clean-label and sustainable formulations are expected to reinforce consumer trust, ensuring long-term momentum for pollution-fighting skincare solutions.

Segmental Analysis

The Pollution-Fighting Urban Skincare Market has been segmented across claim, function, and product type, reflecting how consumer preferences are being shaped by protective efficacy, active formulations, and daily usability. Claim segmentation underscores the rising importance of SPF-backed products, while function classification highlights the demand for antioxidant-rich solutions.

Product type segmentation emphasizes the relevance of moisturizers with SPF and their essential role in everyday skincare. Each dimension of segmentation demonstrates how consumer adoption is influenced by the convergence of environmental awareness, regulatory momentum, and lifestyle-driven choices. The interplay between these segments is expected to define the pace and direction of growth through 2035.
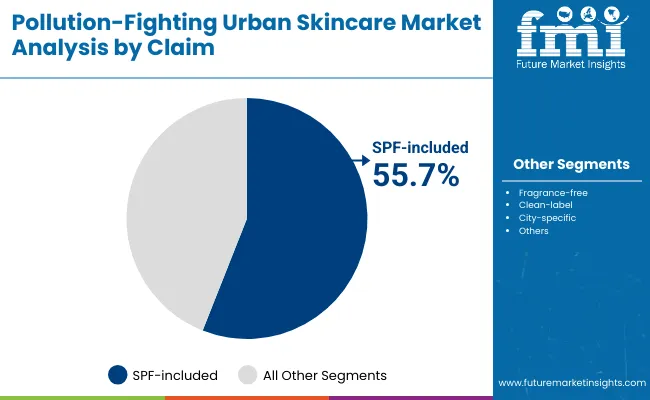
Insights into the Claim Segment with SPF-included Leading in Market Share

Pollution Fighting Urban Skincare Market By Claim

Segment Market Value Share, 2025
SPF-included 55.7%
Others 44.3%

The SPF-included segment is projected to capture 55.7% of market revenues in 2025, reaching USD 1,575.8 million. Its dominance is being reinforced by the growing consumer need for multifunctional skincare that protects against both sun exposure and pollution. The preference for SPF-included claims is expected to remain strong as awareness of UV and pollution synergy deepens.

The “Others” category, with 44.3% share, is anticipated to maintain steady growth through clean-label and fragrance-free claims, appealing to consumers seeking skin compatibility. Across both categories, trust in efficacy and regulatory backing is expected to accelerate adoption, ensuring sustained relevance of claim-driven positioning in the decade ahead.
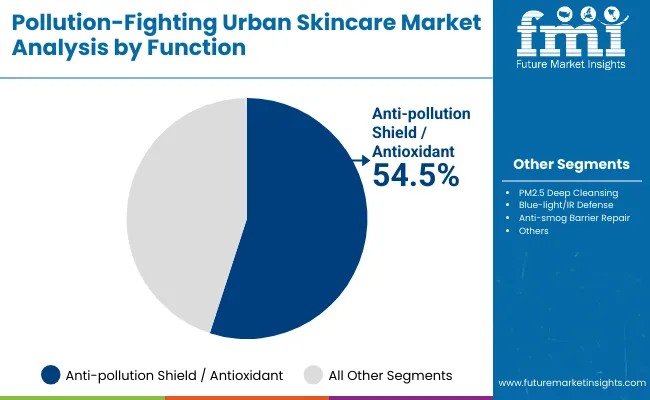
Insights into the Function Segment with Anti-pollution Shield/Antioxidant Leading in Market Share

Pollution Fighting Urban Skincare Market By Function

Segment Market Value Share, 2025
Anti-pollution shield/antioxidant 54.5%
Others 45.5%

Anti-pollution shield and antioxidant formulations are forecasted to lead with 54.5% share in 2025, equivalent to USD 1,636.4 million. Their position is being strengthened by increasing consumer recognition of oxidative stress as a primary contributor to premature aging and skin sensitivity. The adoption of antioxidants and protective actives is anticipated to accelerate as urban exposure intensifies.

The “Others” category, valued at USD 1,367.5 million with a 45.5% share, will remain competitive by addressing skin repair and detoxification needs. Innovation in functional blends, such as bioactive complexes and repair-focused actives, is expected to expand this space. Together, these functions highlight how science-backed efficacy will drive market evolution in the coming decade.
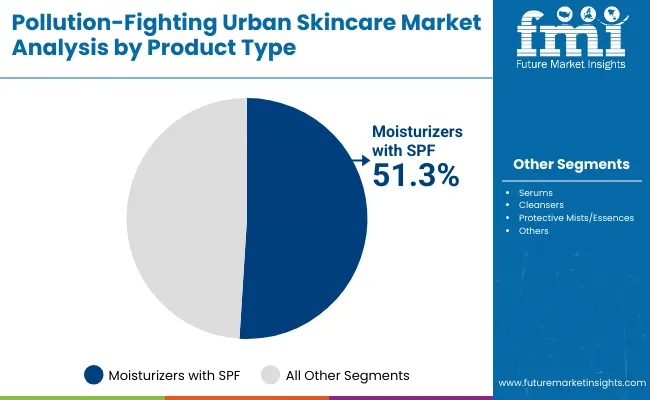
Insights into the Product Type Segment with Moisturizers with SPF Dominating in 2025

Pollution Fighting Urban Skincare Market By Product Type

Segment Market Value Share, 2025
Moisturizers with SPF 51.3%
Others 48.7%

Moisturizers with SPF are projected to dominate with a 51.3% share in 2025, valued at USD 1,484.8 million. Their leadership reflects their role as essential daily-use products that integrate hydration with protective defense against pollution and sun exposure. The demand for lightweight, multifunctional moisturizers is expected to rise significantly among urban consumers.

Other product types, with a 48.7% share worth USD 1,463.6 million, are anticipated to contribute strongly through serums, mists, and cleansers designed for targeted protection and barrier repair. Diversification of skincare routines and innovations in portable, easy-to-apply formats are likely to reinforce their presence. This segmentation highlights the balanced contribution of product formats to overall market expansion.

What are the Drivers, Restraints, and Key Trends of the Pollution-Fighting Urban Skincare Market?

The market is being influenced by evolving consumer expectations, regulatory pressures, and technological advancements, creating opportunities while also exposing structural limitations that shape the long-term growth trajectory.

Scientific Validation of Pollution-Linked Skin Aging

Market expansion is being accelerated as scientific evidence linking air pollutants and fine particulate matter to skin aging and inflammatory conditions is increasingly validated through clinical research. Dermatological studies highlighting oxidative stress pathways have enhanced consumer awareness and created trust in advanced formulations.

This driver is not only redefining marketing narratives but is also compelling brands to invest in R&D pipelines that integrate antioxidants, vitamins, and bioactives with proven efficacy. As clinical data continues to be disseminated, a stronger alignment between medical dermatology and consumer skincare is expected to emerge, reinforcing demand for pollution-defense products in both mass and premium categories.

High Costs of Innovation in Bioactive Ingredients

The cost of developing next-generation bioactive complexes such as ectoin, moringa seed proteins, and resveratrol-based systems is acting as a restraint. Formulating multi-active blends with sustainable sourcing, clinical trials, and regulatory compliance creates significant price pressures for both manufacturers and end consumers.

Premium positioning often limits accessibility in price-sensitive regions, slowing broader adoption. Unless cost efficiencies are achieved through biotechnological advances and scaled production, the affordability challenge is expected to temper growth in emerging economies, despite rising consumer interest in protective skincare.
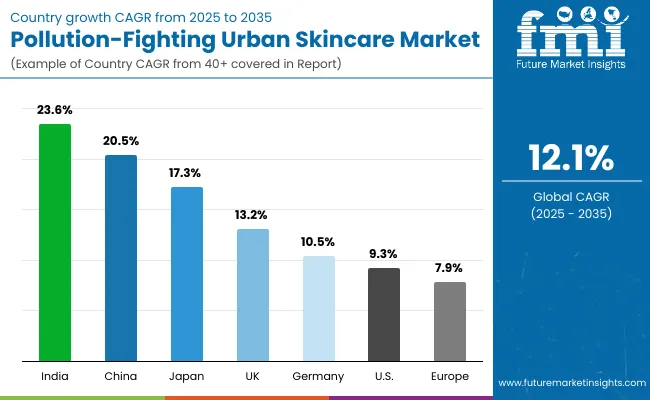
Analysis of Pollution-Fighting Urban Skincare Market By Key Countries

Pollution Fighting Urban Skincare Market Country Wise Analysis

Country CAGR
China 20.5%
USA 9.3%
India 23.6%
UK 13.2%
Germany 10.5%
Japan 17.3%

The Pollution-Fighting Urban Skincare Market is showing distinct country-level growth dynamics, shaped by environmental stress levels, regulatory frameworks, and consumer adoption of advanced skincare routines. India is projected to lead with a CAGR of 23.6% between 2025 and 2035, supported by rising disposable incomes, rapid urbanization, and heightened awareness of pollution-linked skin concerns in highly populated metropolitan areas.

China is expected to follow closely at 20.5% CAGR, where severe air quality challenges, combined with government-backed sustainability initiatives, are creating fertile ground for the adoption of scientifically validated skincare solutions.

Japan, advancing at 17.3% CAGR, is positioned strongly due to consumer inclination toward technology-driven skincare and preference for clinically proven, multifunctional formats. The UK is expected to expand at 13.2%, driven by increasing urban wellness awareness and premium beauty investments. Germany, with a CAGR of 10.5%, is anticipated to grow steadily, supported by dermatology-focused retail channels and rising demand for clean-label claims.

The USA shows moderate growth at 9.3% CAGR, reflecting maturity of the skincare sector but steady adoption of anti-pollution claims in urban centers such as New York and Los Angeles. Collectively, Asia-Pacific markets are expected to set the pace for global adoption, while Europe and North America maintain steady yet differentiated growth trajectories.
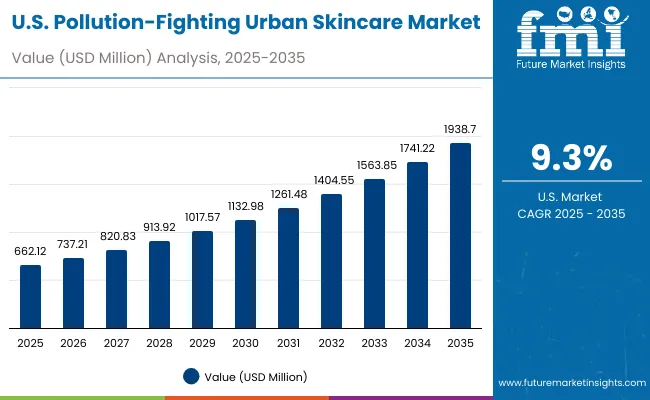
Sales Outlook for Pollution-Fighting Urban Skincare in the United States

Usa Pollution Fighting Urban Skincare Market

Year USA Pollution-Fighting Urban Skincare Market (USD Million)
2025 662.12
2026 737.21
2027 820.83
2028 913.92
2029 1,017.57
2030 1,132.98
2031 1,261.48
2032 1,404.55
2033 1,563.85
2034 1,741.22
2035 1,938.70

The USA Pollution-Fighting Urban Skincare Market is projected to grow at a CAGR of 11.0% from 2025 to 2035, expanding from USD 662.12 million in 2025 to USD 1,938.70 million by 2035. This threefold rise underscores how demand for multifunctional protection is being accelerated by worsening urban pollution and greater consumer awareness of skin health risks.

Sales are anticipated to strengthen consistently, reaching USD 1,132.98 million by 2030, before further advancing to USD 1,938.70 million in 2035. The decade’s expansion will be shaped by SPF-included products, which are increasingly positioned as daily-use essentials. Premium ranges featuring antioxidants and dermatologist-backed formulations are also expected to capture growing consumer interest.

Digital-first retail strategies, coupled with rising e-commerce penetration, will enhance accessibility and create new engagement models. Clinical skincare channels, including dermatology clinics, are projected to reinforce trust in scientifically validated products. By the end of the forecast period, the USA market will reflect a more balanced mix of premium skincare adoption and mass-market accessibility, driven by sustainability, clean-label claims, and multifunctional innovation.

  • SPF-included claims will define consumer preference in the USA market.
  • Premiumization and dermatologist-endorsed formulations will strengthen late-decade demand.
  • E-commerce and omni-channel adoption will be central to nationwide market expansion.

Growth and Expansion Outlook For Pollution-Fighting Urban Skincare Market in the United Kingdom

The UK Pollution-Fighting Urban Skincare Market is projected to grow at a CAGR of 13.2% from 2025 to 2035, reflecting steady expansion driven by rising urban wellness awareness and a preference for premium skincare solutions. Market revenues are expected to increase consistently as pollution-related skin damage becomes a priority among urban populations.

Adoption is anticipated to be influenced strongly by dermatologist-endorsed products and advanced formulations featuring antioxidants and SPF inclusion. Premium retail channels are projected to expand their influence, with e-commerce gaining traction as a key growth driver. Demand for fragrance-free and clean-label claims is expected to strengthen consumer trust, particularly among younger demographics seeking safety and transparency.

  • Premium beauty retail is expected to dominate distribution in the UK.
  • Dermatologist-backed claims will build credibility in high-value segments.
  • E-commerce adoption will accelerate growth, especially in urban centers.
  • Clean-label formulations are likely to reinforce brand trust.

Growth and Expansion Outlook for Pollution-Fighting Urban Skincare Market in India

The India Pollution-Fighting Urban Skincare Market is projected to grow at a CAGR of 23.6% from 2025 to 2035, marking the fastest growth among major countries. Expansion is expected to be fueled by rapid urbanization, rising disposable incomes, and severe air pollution levels across metropolitan regions.

By 2030, significant adoption is anticipated as skincare routines become increasingly aligned with preventative health and wellness priorities. Demand is expected to be led by multifunctional products combining SPF and antioxidants, with premiumization gaining traction in metropolitan cities. Local and international brands are projected to scale operations rapidly, leveraging e-commerce channels and digital campaigns to reach younger demographics.

  • Highest CAGR globally signals massive growth potential.
  • E-commerce and digital-first models will drive accessibility.
  • SPF-included and antioxidant products will dominate demand.
  • Urban pollution and lifestyle shifts will sustain long-term adoption.

Sales Outlook for Pollution-Fighting Urban Skincare in China

The China Pollution-Fighting Urban Skincare Market is projected to grow at a CAGR of 20.5% between 2025 and 2035, underscoring its position as one of the fastest-expanding markets globally. Growth is expected to be driven by severe pollution exposure, strong consumer awareness, and regulatory support for sustainable skincare practices.

China’s urban population is anticipated to embrace multifunctional products such as moisturizers with SPF, while premium beauty retail and e-commerce platforms are expected to fuel distribution. Local innovation, supported by biotechnology and advanced formulation science, is likely to shape the competitive landscape. By 2035, China is forecasted to be among the largest contributors to global market revenues.
  • High CAGR reflects rapid and sustained growth trajectory.
  • E-commerce dominance will boost nationwide product penetration.
  • Local innovations will compete with global premium brands.
  • Severe pollution challenges will continue to fuel consumer demand.

In-depth Analysis of Pollution-Fighting Urban Skincare in Germany

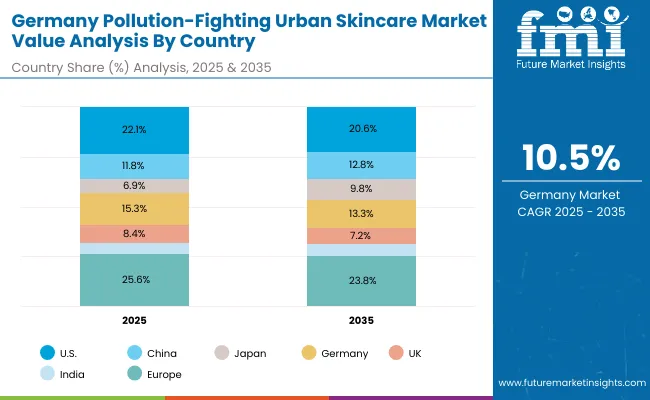
Germany Pollution Fighting Urban Skincare Market

Country 2025
USA 22.1%
China 11.8%
Japan 6.9%
Germany 15.3%
UK 8.4%
India 5.2%
Country 2035
USA 20.6%
China 12.8%
Japan 9.8%
Germany 13.3%
UK 7.2%
India 5.9%

The Germany Pollution-Fighting Urban Skincare Market is projected to grow at a CAGR of 10.5% from 2025 to 2035, reflecting stable yet significant expansion. Growth is expected to be anchored by high consumer trust in dermatologist-tested products and a strong inclination toward clean-label and fragrance-free claims.

Germany’s premium skincare sector is anticipated to record strong adoption of SPF-included and antioxidant-rich formulations, with pharmacies and dermatology clinics projected to play a central role in distribution. Regulatory emphasis on safety, sustainability, and product validation is expected to further reinforce consumer confidence.
  • Dermatology-led distribution will remain central in Germany.
  • Clean-label and fragrance-free claims will drive preference.
  • Premium positioning will strengthen late-decade revenues.
  • Sustainability compliance is expected to boost long-term trust.

Growth Outlook for Pollution-Fighting Urban Skincare Market in USA

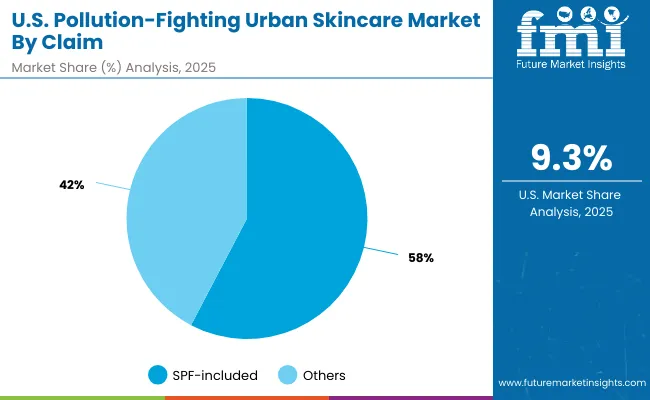
Usa Pollution Fighting Urban Skincare Market By Claim

Segment Market Value Share, 2025
SPF-included 57.7%
Others 42.3%

The Pollution-Fighting Urban Skincare Market in the United States is projected at USD 662.12 million in 2025. SPF-included products contribute 57.7%, valued at USD 381.9 million, while other claims account for 42.3%, valued at USD 280.2 million. This dominance of SPF-included products highlights the consumer preference for multifunctional skincare that combines pollution protection with sun defense. The prioritization of SPF stems from the growing awareness of combined UV and pollution damage, which accelerates skin aging and sensitivity.

A structural shift is expected as USA consumers increasingly demand dermatologist-endorsed and clinically validated solutions, particularly in metropolitan areas with higher pollution exposure. Premium skincare positioned with antioxidant enrichment is also projected to support growth. As sustainability and clean-label formulations gain traction, adoption is anticipated to rise further. The decade ahead will be defined by innovation in lightweight moisturizers, advanced barrier-protection formats, and digital-first retail distribution.
  • Market in the USA valued at USD 662.12 million in 2025
  • SPF-included claims lead with 57.7% share
  • Others hold 42.3% share, maintaining relevance in niche segments
  • Growth reinforced by clinical validation and premium positioning

Opportunity Analysis of China Pollution-Fighting Urban Skincare Market

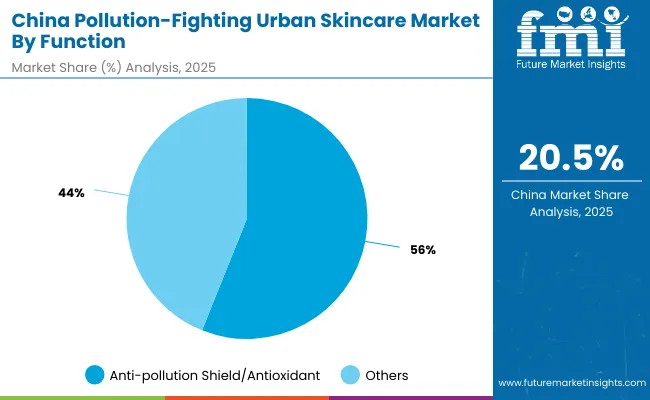
China Pollution Fighting Urban Skincare Market By Function

Segment Market Value Share, 2025
Anti-pollution shield/antioxidant 56.1%
Others 43.9%

The Pollution-Fighting Urban Skincare Market in China is projected at USD 353.20 million in 2025. Anti-pollution shield and antioxidant-based products contribute 56.1%, valued at USD 198.3 million, while other functions account for 43.9%, valued at USD 154.9 million. This functional dominance highlights the strong consumer inclination toward products that counter oxidative stress and strengthen skin barriers against severe pollution exposure.

Growth in China is expected to be accelerated by increasing disposable incomes, widespread urbanization, and heightened public awareness of skin damage linked to particulate matter and smog. Premium skincare formats offering clinically validated antioxidant protection are anticipated to gain wider adoption, while e-commerce platforms and digital-first retail strategies are projected to expand product accessibility nationwide.

The decade ahead will likely be defined by advanced formulation technologies, local R&D investments, and integration of bioactive ingredients tailored to urban Chinese consumers. As sustainability and regulatory compliance gain momentum, trust in protective skincare is expected to solidify further, positioning China as one of the most dynamic markets globally.
  • China market valued at USD 353.20 million in 2025
  • Anti-pollution shield/antioxidant leads with 56.1% share
  • Others retain 43.9% share, supporting repair and hydration needs
  • Growth driven by urbanization, e-commerce expansion, and premium positioning

Competitive Landscape of Pollution-Fighting Urban Skincare Market

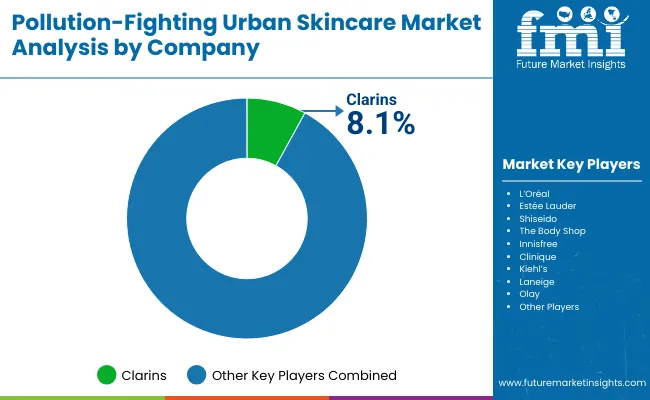
Pollution Fighting Urban Skincare Market  By Company

Company Global Value Share 2025
Clarins 8.1%
Others 91.9%

The Pollution-Fighting Urban Skincare Market is moderately fragmented, with global leaders, mid-sized innovators, and regional specialists competing for share across diverse consumer bases. Global beauty leaders such as Clarins, L’Oréal, Estée Lauder, and Shiseido are positioned strongly due to their extensive R&D pipelines, established distribution networks, and premium brand equity. Their strategies are increasingly centered on integrating antioxidants, multifunctional SPF products, and sustainable formulations, ensuring alignment with consumer expectations for efficacy and clean-label transparency.

Clarins, holding 8.1% of global value share in 2025, has emerged as the leading player, reflecting its early focus on pollution-defense skincare. This leadership is expected to have been consolidated from 2024, when its share was already dominant in the category.

Mid-sized innovators such as The Body Shop, Innisfree, Clinique, and Kiehl’s are addressing the demand for accessible, eco-conscious, and dermatology-backed solutions. Their ability to balance affordability with functional efficacy positions them favorably in both developed and emerging markets.

Niche-focused brands including Laneige and Olay are emphasizing product innovation in lightweight moisturizers and urban-targeted formulations. Their strength lies in regional adaptability, particularly in Asia-Pacific where consumer awareness of pollution-linked skin concerns is expanding rapidly.

Competitive differentiation is expected to shift from brand heritage alone toward evidence-based claims, clinical validation, and digital-first engagement strategies. Ecosystem integration through omni-channel distribution and sustainability-focused packaging will remain decisive in shaping long-term leadership.

Key Developments in Pollution-Fighting Urban Skincare Market

  • Codex Labs’ Bia Ultra-Hydrating Soothing Lotion was awarded Microbiome-Friendly Certification and the National Eczema Association Seal of Acceptance. This development was enabled by its formulation focused on barrier protection and clean actives.
  • Codex Labs was granted USA Patent No. 12,194,068 for Shaant ClearSkin Probiotic 2.0, an oral synbiotic supplement intended for managing oily and acne-prone skin. Innovation in ingestible skincare was thereby reinforced.

Scope of the Report

Item Value
Quantitative Units USD 3,002.5 million (2025) - USD 9,405.6 million (2035)
By Claim SPF-included, Others
By Function Anti-pollution shield/antioxidant, Others
By Product Type Moisturizers with SPF, Serums, Cleansers, Protective mists/essences
By Active System Ectoin/moringa seed proteins, Vitamin C + Niacinamide, Algae/charcoal complexes, Resveratrol/ferulic systems
By Channel Pharmacies, E-commerce, Premium beauty retail, Dermatology clinics
Regions Covered North America, Europe, Asia-Pacific, Latin America, Middle East & Africa
Countries Covered United States, China, India, Japan, Germany, United Kingdom, Brazil, South Africa
Key Companies Profiled Clarins, L’Oréal, Estée Lauder, Shiseido, The Body Shop, Innisfree, Clinique, Kiehl’s, Laneige, Olay
Additional Attributes Dollar sales by claim, function, and product type; adoption of SPF-included multifunctional products; rising demand in urban centers with severe pollution exposure; e-commerce and digital-first retail expansion; premiumization trends in Asia-Pacific; clinical validation and dermatologist endorsements; sustainability and clean-label innovation shaping long-term competitive advantage.

Key Segments

By Function:

  • Anti-pollution shield/antioxidant
  • PM2.5 deep cleansing
  • Anti-smog barrier repair
  • Blue-light/IR defense

By Product Type:

  • Moisturizers with SPF
  • Serums
  • Cleansers
  • Protective mists/essences

By Active System:

  • Ectoin/moringa seed proteins
  • Vitamin C + niacinamide
  • Resveratrol/ferulic systems
  • Algae/charcoal complexes

By Channel:

  • Pharmacies
  • E-commerce
  • Premium beauty retail
  • Dermatology clinics

By Claim:

  • SPF-included
  • Fragrance-free
  • Clean-label
  • City-specific

By Region:

  • North America
  • Latin America
  • Europe
  • East Asia
  • South Asia & Pacific
  • Middle East and Africa

Table of Content

  1. Executive Summary
    • Global Market Outlook
    • Demand-side Trends
    • Supply-side Trends
    • Technology Roadmap Analysis
    • Analysis and Recommendations
  2. Market Overview
    • Market Coverage / Taxonomy
    • Market Definition / Scope / Limitations
  3. Market Background
    • Market Dynamics
      • Drivers
      • Restraints
      • Opportunity
      • Trends
    • Scenario Forecast
      • Demand in Optimistic Scenario
      • Demand in Likely Scenario
      • Demand in Conservative Scenario
    • Opportunity Map Analysis
    • Product Life Cycle Analysis
    • Supply Chain Analysis
    • Investment Feasibility Matrix
    • Value Chain Analysis
    • PESTLE and Porter’s Analysis
    • Regulatory Landscape
    • Regional Parent Market Outlook
    • Production and Consumption Statistics
    • Import and Export Statistics
  4. Global Analysis 2020 to 2024 and Forecast, 2025 to 2035
    • Historical Market Size Value (USD Million) Analysis, 2020 to 2024
    • Current and Future Market Size Value (USD Million) Projections, 2025 to 2035
      • Y-o-Y Growth Trend Analysis
      • Absolute $ Opportunity Analysis
  5. Global Pricing Analysis 2020 to 2024 and Forecast 2025 to 2035
  6. Global Analysis 2020 to 2024 and Forecast 2025 to 2035, By Function
    • Introduction / Key Findings
    • Historical Market Size Value (USD Million) Analysis By Function, 2020 to 2024
    • Current and Future Market Size Value (USD Million) Analysis and Forecast By Function, 2025 to 2035
      • Anti-pollution shield/antioxidant
      • PM2.5 deep cleansing
      • Anti-smog barrier repair
      • Blue-light/IR defense
    • Y-o-Y Growth Trend Analysis By Function, 2020 to 2024
    • Absolute $ Opportunity Analysis By Function, 2025 to 2035
  7. Global Analysis 2020 to 2024 and Forecast 2025 to 2035, By Product Type
    • Introduction / Key Findings
    • Historical Market Size Value (USD Million) Analysis By Product Type, 2020 to 2024
    • Current and Future Market Size Value (USD Million) Analysis and Forecast By Product Type, 2025 to 2035
      • Moisturizers with SPF
      • Serums
      • Cleansers
      • Protective mists/essences
    • Y-o-Y Growth Trend Analysis By Product Type, 2020 to 2024
    • Absolute $ Opportunity Analysis By Product Type, 2025 to 2035
  8. Global Analysis 2020 to 2024 and Forecast 2025 to 2035, By Active System
    • Introduction / Key Findings
    • Historical Market Size Value (USD Million) Analysis By Active System, 2020 to 2024
    • Current and Future Market Size Value (USD Million) Analysis and Forecast By Active System, 2025 to 2035
      • Ectoin/moringa seed proteins
      • Vitamin C + niacinamide
      • Resveratrol/ferulic systems
      • Algae/charcoal complexes
    • Y-o-Y Growth Trend Analysis By Active System, 2020 to 2024
    • Absolute $ Opportunity Analysis By Active System, 2025 to 2035
  9. Global Analysis 2020 to 2024 and Forecast 2025 to 2035, By Channel
    • Introduction / Key Findings
    • Historical Market Size Value (USD Million) Analysis By Channel, 2020 to 2024
    • Current and Future Market Size Value (USD Million) Analysis and Forecast By Channel, 2025 to 2035
      • Pharmacies
      • E-commerce
      • Premium beauty retail
      • Dermatology clinics
    • Y-o-Y Growth Trend Analysis By Channel, 2020 to 2024
    • Absolute $ Opportunity Analysis By Channel, 2025 to 2035
  10. Global Analysis 2020 to 2024 and Forecast 2025 to 2035, By Claim
    • Introduction / Key Findings
    • Historical Market Size Value (USD Million) Analysis By Claim, 2020 to 2024
    • Current and Future Market Size Value (USD Million) Analysis and Forecast By Claim, 2025 to 2035
      • SPF-included
      • Fragrance-free
      • Clean-label
      • City-specific
    • Y-o-Y Growth Trend Analysis By Claim, 2020 to 2024
    • Absolute $ Opportunity Analysis By Claim, 2025 to 2035
  11. Global Analysis 2020 to 2024 and Forecast 2025 to 2035, By Region
    • Introduction
    • Historical Market Size Value (USD Million) Analysis By Region, 2020 to 2024
    • Current Market Size Value (USD Million) Analysis and Forecast By Region, 2025 to 2035
      • North America
      • Latin America
      • Europe
      • East Asia
      • South Asia & Pacific
      • Middle East and Africa
    • Market Attractiveness Analysis By Region
  12. North America Analysis 2020 to 2024 and Forecast 2025 to 2035, By Country
    • Historical Market Size Value (USD Million) Trend Analysis By Market Taxonomy, 2020 to 2024
    • Market Size Value (USD Million) Forecast By Market Taxonomy, 2025 to 2035
      • By Country
        • USA
        • Canada
      • By Function
      • By Product Type
      • By Active System
      • By Channel
      • By Claim
    • Market Attractiveness Analysis
      • By Country
      • By Function
      • By Product Type
      • By Active System
      • By Channel
      • By Claim
    • Key Takeaways
  13. Latin America Analysis 2020 to 2024 and Forecast 2025 to 2035, By Country
    • Historical Market Size Value (USD Million) Trend Analysis By Market Taxonomy, 2020 to 2024
    • Market Size Value (USD Million) Forecast By Market Taxonomy, 2025 to 2035
      • By Country
        • Brazil
        • Mexico
        • Colombia
        • Rest of Latin America
      • By Function
      • By Product Type
      • By Active System
      • By Channel
      • By Claim
    • Market Attractiveness Analysis
      • By Country
      • By Function
      • By Product Type
      • By Active System
      • By Channel
      • By Claim
    • Key Takeaways
  14. Europe Analysis 2020 to 2024 and Forecast 2025 to 2035, By Country
    • Historical Market Size Value (USD Million) Trend Analysis By Market Taxonomy, 2020 to 2024
    • Market Size Value (USD Million) Forecast By Market Taxonomy, 2025 to 2035
      • By Country
        • Germany
        • UK
        • France
        • Italy
        • Spain
        • Belgium
        • Netherlands
        • Nordic
        • Switzerland
        • Russia
        • Poland
        • Rest of Europe
      • By Function
      • By Product Type
      • By Active System
      • By Channel
      • By Claim
    • Market Attractiveness Analysis
      • By Country
      • By Function
      • By Product Type
      • By Active System
      • By Channel
      • By Claim
    • Key Takeaways
  15. East Asia Analysis 2020 to 2024 and Forecast 2025 to 2035, By Country
    • Historical Market Size Value (USD Million) Trend Analysis By Market Taxonomy, 2020 to 2024
    • Market Size Value (USD Million) Forecast By Market Taxonomy, 2025 to 2035
      • By Country
        • China
        • Japan
        • South Korea
      • By Function
      • By Product Type
      • By Active System
      • By Channel
      • By Claim
    • Market Attractiveness Analysis
      • By Country
      • By Function
      • By Product Type
      • By Active System
      • By Channel
      • By Claim
    • Key Takeaways
  16. South Asia & Pacific Analysis 2020 to 2024 and Forecast 2025 to 2035, By Country
    • Historical Market Size Value (USD Million) Trend Analysis By Market Taxonomy, 2020 to 2024
    • Market Size Value (USD Million) Forecast By Market Taxonomy, 2025 to 2035
      • By Country
        • India
        • Thailand
        • Malaysia
        • Indonesia
        • Singapore
        • Vietnam
        • Australia
        • New Zealand
        • Rest of South Asia
      • By Function
      • By Product Type
      • By Active System
      • By Channel
      • By Claim
    • Market Attractiveness Analysis
      • By Country
      • By Function
      • By Product Type
      • By Active System
      • By Channel
      • By Claim
    • Key Takeaways
  17. Middle East and Africa Analysis 2020 to 2024 and Forecast 2025 to 2035, By Country
    • Historical Market Size Value (USD Million) Trend Analysis By Market Taxonomy, 2020 to 2024
    • Market Size Value (USD Million) Forecast By Market Taxonomy, 2025 to 2035
      • By Country
        • Turkey
        • UAE
        • Saudi Arabia
        • Israel
        • Other GCC Countries
        • North Africa
        • South Africa
      • By Function
      • By Product Type
      • By Active System
      • By Channel
      • By Claim
    • Market Attractiveness Analysis
      • By Country
      • By Function
      • By Product Type
      • By Active System
      • By Channel
      • By Claim
    • Key Takeaways
  18. Key Countries Analysis
    • USA
      • Pricing Analysis
      • Market Share Analysis, 2024
        • By Function
        • By Product Type
        • By Active System
        • By Channel
        • By Claim
    • Canada
      • Pricing Analysis
      • Market Share Analysis, 2024
        • By Function
        • By Product Type
        • By Active System
        • By Channel
        • By Claim
    • Mexico
      • Pricing Analysis
      • Market Share Analysis, 2024
        • By Function
        • By Product Type
        • By Active System
        • By Channel
        • By Claim
    • Brazil
      • Pricing Analysis
      • Market Share Analysis, 2024
        • By Function
        • By Product Type
        • By Active System
        • By Channel
        • By Claim
    • Chile
      • Pricing Analysis
      • Market Share Analysis, 2024
        • By Function
        • By Product Type
        • By Active System
        • By Channel
        • By Claim
    • Germany
      • Pricing Analysis
      • Market Share Analysis, 2024
        • By Function
        • By Product Type
        • By Active System
        • By Channel
        • By Claim
    • UK
      • Pricing Analysis
      • Market Share Analysis, 2024
        • By Function
        • By Product Type
        • By Active System
        • By Channel
        • By Claim
    • Italy
      • Pricing Analysis
      • Market Share Analysis, 2024
        • By Function
        • By Product Type
        • By Active System
        • By Channel
        • By Claim
    • Spain
      • Pricing Analysis
      • Market Share Analysis, 2024
        • By Function
        • By Product Type
        • By Active System
        • By Channel
        • By Claim
    • France
      • Pricing Analysis
      • Market Share Analysis, 2024
        • By Function
        • By Product Type
        • By Active System
        • By Channel
        • By Claim
    • India
      • Pricing Analysis
      • Market Share Analysis, 2024
        • By Function
        • By Product Type
        • By Active System
        • By Channel
        • By Claim
    • ASEAN
      • Pricing Analysis
      • Market Share Analysis, 2024
        • By Function
        • By Product Type
        • By Active System
        • By Channel
        • By Claim
    • Australia & New Zealand
      • Pricing Analysis
      • Market Share Analysis, 2024
        • By Function
        • By Product Type
        • By Active System
        • By Channel
        • By Claim
    • China
      • Pricing Analysis
      • Market Share Analysis, 2024
        • By Function
        • By Product Type
        • By Active System
        • By Channel
        • By Claim
    • Japan
      • Pricing Analysis
      • Market Share Analysis, 2024
        • By Function
        • By Product Type
        • By Active System
        • By Channel
        • By Claim
    • South Korea
      • Pricing Analysis
      • Market Share Analysis, 2024
        • By Function
        • By Product Type
        • By Active System
        • By Channel
        • By Claim
    • Russia
      • Pricing Analysis
      • Market Share Analysis, 2024
        • By Function
        • By Product Type
        • By Active System
        • By Channel
        • By Claim
    • Poland
      • Pricing Analysis
      • Market Share Analysis, 2024
        • By Function
        • By Product Type
        • By Active System
        • By Channel
        • By Claim
    • Hungary
      • Pricing Analysis
      • Market Share Analysis, 2024
        • By Function
        • By Product Type
        • By Active System
        • By Channel
        • By Claim
    • Kingdom of Saudi Arabia
      • Pricing Analysis
      • Market Share Analysis, 2024
        • By Function
        • By Product Type
        • By Active System
        • By Channel
        • By Claim
    • Turkiye
      • Pricing Analysis
      • Market Share Analysis, 2024
        • By Function
        • By Product Type
        • By Active System
        • By Channel
        • By Claim
    • South Africa
      • Pricing Analysis
      • Market Share Analysis, 2024
        • By Function
        • By Product Type
        • By Active System
        • By Channel
        • By Claim
  19. Market Structure Analysis
    • Competition Dashboard
    • Competition Benchmarking
    • Market Share Analysis of Top Players
      • By Regional
      • By Function
      • By Product Type
      • By Active System
      • By Channel
      • By Claim
  20. Competition Analysis
    • Competition Deep Dive
      • Clarins
        • Overview
        • Product Portfolio
        • Profitability by Market Segments (Product/Age /Sales Channel/Region)
        • Sales Footprint
        • Strategy Overview
        • L’Oréal
        • Estée Lauder
        • Shiseido
        • The Body Shop
        • Innisfree
        • Clinique
        • Kiehl’s
        • Laneige
        • Olay
  21. Assumptions & Acronyms Used
  22. Research Methodology

List of Tables

  • Table 1: Global Value (USD Million) Forecast by Region, 2020-2035
  • Table 2: Global Value (USD Million) Forecast by Function, 2020-2035
  • Table 3: Global Value (USD Million) Forecast by Product Type, 2020-2035
  • Table 4: Global Value (USD Million) Forecast by Active System, 2020-2035
  • Table 5: Global Value (USD Million) Forecast by Channel, 2020-2035
  • Table 6: Global Value (USD Million) Forecast by Claim, 2020-2035
  • Table 7: North America Value (USD Million) Forecast by Country, 2020-2035
  • Table 8: North America Value (USD Million) Forecast by Function, 2020-2035
  • Table 9: North America Value (USD Million) Forecast by Product Type, 2020-2035
  • Table 10: North America Value (USD Million) Forecast by Active System, 2020-2035
  • Table 11: North America Value (USD Million) Forecast by Channel, 2020-2035
  • Table 12: North America Value (USD Million) Forecast by Claim, 2020-2035
  • Table 13: Latin America Value (USD Million) Forecast by Country, 2020-2035
  • Table 14: Latin America Value (USD Million) Forecast by Function, 2020-2035
  • Table 15: Latin America Value (USD Million) Forecast by Product Type, 2020-2035
  • Table 16: Latin America Value (USD Million) Forecast by Active System, 2020-2035
  • Table 17: Latin America Value (USD Million) Forecast by Channel, 2020-2035
  • Table 18: Latin America Value (USD Million) Forecast by Claim, 2020-2035
  • Table 19: Europe Value (USD Million) Forecast by Country, 2020-2035
  • Table 20: Europe Value (USD Million) Forecast by Function, 2020-2035
  • Table 21: Europe Value (USD Million) Forecast by Product Type, 2020-2035
  • Table 22: Europe Value (USD Million) Forecast by Active System, 2020-2035
  • Table 23: Europe Value (USD Million) Forecast by Channel, 2020-2035
  • Table 24: Europe Value (USD Million) Forecast by Claim, 2020-2035
  • Table 25: East Asia Value (USD Million) Forecast by Country, 2020-2035
  • Table 26: East Asia Value (USD Million) Forecast by Function, 2020-2035
  • Table 27: East Asia Value (USD Million) Forecast by Product Type, 2020-2035
  • Table 28: East Asia Value (USD Million) Forecast by Active System, 2020-2035
  • Table 29: East Asia Value (USD Million) Forecast by Channel, 2020-2035
  • Table 30: East Asia Value (USD Million) Forecast by Claim, 2020-2035
  • Table 31: South Asia & Pacific Value (USD Million) Forecast by Country, 2020-2035
  • Table 32: South Asia & Pacific Value (USD Million) Forecast by Function, 2020-2035
  • Table 33: South Asia & Pacific Value (USD Million) Forecast by Product Type, 2020-2035
  • Table 34: South Asia & Pacific Value (USD Million) Forecast by Active System, 2020-2035
  • Table 35: South Asia & Pacific Value (USD Million) Forecast by Channel, 2020-2035
  • Table 36: South Asia & Pacific Value (USD Million) Forecast by Claim, 2020-2035
  • Table 37: Middle East and Africa Value (USD Million) Forecast by Country, 2020-2035
  • Table 38: Middle East and Africa Value (USD Million) Forecast by Function, 2020-2035
  • Table 39: Middle East and Africa Value (USD Million) Forecast by Product Type, 2020-2035
  • Table 40: Middle East and Africa Value (USD Million) Forecast by Active System, 2020-2035
  • Table 41: Middle East and Africa Value (USD Million) Forecast by Channel, 2020-2035
  • Table 42: Middle East and Africa Value (USD Million) Forecast by Claim, 2020-2035

List of Figures

  • Figure 1: Global Pricing Analysis
  • Figure 2: Global Value (USD Million) Forecast 2020-2035
  • Figure 3: Global Value Share and BPS Analysis by Function, 2025 and 2035
  • Figure 4: Global Y-o-Y Growth Comparison by Function, 2025-2035
  • Figure 5: Global Attractiveness Analysis by Function
  • Figure 6: Global Value Share and BPS Analysis by Product Type, 2025 and 2035
  • Figure 7: Global Y-o-Y Growth Comparison by Product Type, 2025-2035
  • Figure 8: Global Attractiveness Analysis by Product Type
  • Figure 9: Global Value Share and BPS Analysis by Active System, 2025 and 2035
  • Figure 10: Global Y-o-Y Growth Comparison by Active System, 2025-2035
  • Figure 11: Global Attractiveness Analysis by Active System
  • Figure 12: Global Value Share and BPS Analysis by Channel, 2025 and 2035
  • Figure 13: Global Y-o-Y Growth Comparison by Channel, 2025-2035
  • Figure 14: Global Attractiveness Analysis by Channel
  • Figure 15: Global Value Share and BPS Analysis by Claim, 2025 and 2035
  • Figure 16: Global Y-o-Y Growth Comparison by Claim, 2025-2035
  • Figure 17: Global Attractiveness Analysis by Claim
  • Figure 18: Global Value (USD Million) Share and BPS Analysis by Region, 2025 and 2035
  • Figure 19: Global Y-o-Y Growth Comparison by Region, 2025-2035
  • Figure 20: Global Attractiveness Analysis by Region
  • Figure 21: North America Incremental $ Opportunity, 2025-2035
  • Figure 22: Latin America Incremental $ Opportunity, 2025-2035
  • Figure 23: Europe Incremental $ Opportunity, 2025-2035
  • Figure 24: East Asia Incremental $ Opportunity, 2025-2035
  • Figure 25: South Asia & Pacific Incremental $ Opportunity, 2025-2035
  • Figure 26: Middle East and Africa Incremental $ Opportunity, 2025-2035
  • Figure 27: North America Value Share and BPS Analysis by Country, 2025 and 2035
  • Figure 28: North America Value Share and BPS Analysis by Function, 2025 and 2035
  • Figure 29: North America Y-o-Y Growth Comparison by Function, 2025-2035
  • Figure 30: North America Attractiveness Analysis by Function
  • Figure 31: North America Value Share and BPS Analysis by Product Type, 2025 and 2035
  • Figure 32: North America Y-o-Y Growth Comparison by Product Type, 2025-2035
  • Figure 33: North America Attractiveness Analysis by Product Type
  • Figure 34: North America Value Share and BPS Analysis by Active System, 2025 and 2035
  • Figure 35: North America Y-o-Y Growth Comparison by Active System, 2025-2035
  • Figure 36: North America Attractiveness Analysis by Active System
  • Figure 37: North America Value Share and BPS Analysis by Channel, 2025 and 2035
  • Figure 38: North America Y-o-Y Growth Comparison by Channel, 2025-2035
  • Figure 39: North America Attractiveness Analysis by Channel
  • Figure 40: North America Value Share and BPS Analysis by Claim, 2025 and 2035
  • Figure 41: North America Y-o-Y Growth Comparison by Claim, 2025-2035
  • Figure 42: North America Attractiveness Analysis by Claim
  • Figure 43: Latin America Value Share and BPS Analysis by Country, 2025 and 2035
  • Figure 44: Latin America Value Share and BPS Analysis by Function, 2025 and 2035
  • Figure 45: Latin America Y-o-Y Growth Comparison by Function, 2025-2035
  • Figure 46: Latin America Attractiveness Analysis by Function
  • Figure 47: Latin America Value Share and BPS Analysis by Product Type, 2025 and 2035
  • Figure 48: Latin America Y-o-Y Growth Comparison by Product Type, 2025-2035
  • Figure 49: Latin America Attractiveness Analysis by Product Type
  • Figure 50: Latin America Value Share and BPS Analysis by Active System, 2025 and 2035
  • Figure 51: Latin America Y-o-Y Growth Comparison by Active System, 2025-2035
  • Figure 52: Latin America Attractiveness Analysis by Active System
  • Figure 53: Latin America Value Share and BPS Analysis by Channel, 2025 and 2035
  • Figure 54: Latin America Y-o-Y Growth Comparison by Channel, 2025-2035
  • Figure 55: Latin America Attractiveness Analysis by Channel
  • Figure 56: Latin America Value Share and BPS Analysis by Claim, 2025 and 2035
  • Figure 57: Latin America Y-o-Y Growth Comparison by Claim, 2025-2035
  • Figure 58: Latin America Attractiveness Analysis by Claim
  • Figure 59: Europe Value Share and BPS Analysis by Country, 2025 and 2035
  • Figure 60: Europe Value Share and BPS Analysis by Function, 2025 and 2035
  • Figure 61: Europe Y-o-Y Growth Comparison by Function, 2025-2035
  • Figure 62: Europe Attractiveness Analysis by Function
  • Figure 63: Europe Value Share and BPS Analysis by Product Type, 2025 and 2035
  • Figure 64: Europe Y-o-Y Growth Comparison by Product Type, 2025-2035
  • Figure 65: Europe Attractiveness Analysis by Product Type
  • Figure 66: Europe Value Share and BPS Analysis by Active System, 2025 and 2035
  • Figure 67: Europe Y-o-Y Growth Comparison by Active System, 2025-2035
  • Figure 68: Europe Attractiveness Analysis by Active System
  • Figure 69: Europe Value Share and BPS Analysis by Channel, 2025 and 2035
  • Figure 70: Europe Y-o-Y Growth Comparison by Channel, 2025-2035
  • Figure 71: Europe Attractiveness Analysis by Channel
  • Figure 72: Europe Value Share and BPS Analysis by Claim, 2025 and 2035
  • Figure 73: Europe Y-o-Y Growth Comparison by Claim, 2025-2035
  • Figure 74: Europe Attractiveness Analysis by Claim
  • Figure 75: East Asia Value Share and BPS Analysis by Country, 2025 and 2035
  • Figure 76: East Asia Value Share and BPS Analysis by Function, 2025 and 2035
  • Figure 77: East Asia Y-o-Y Growth Comparison by Function, 2025-2035
  • Figure 78: East Asia Attractiveness Analysis by Function
  • Figure 79: East Asia Value Share and BPS Analysis by Product Type, 2025 and 2035
  • Figure 80: East Asia Y-o-Y Growth Comparison by Product Type, 2025-2035
  • Figure 81: East Asia Attractiveness Analysis by Product Type
  • Figure 82: East Asia Value Share and BPS Analysis by Active System, 2025 and 2035
  • Figure 83: East Asia Y-o-Y Growth Comparison by Active System, 2025-2035
  • Figure 84: East Asia Attractiveness Analysis by Active System
  • Figure 85: East Asia Value Share and BPS Analysis by Channel, 2025 and 2035
  • Figure 86: East Asia Y-o-Y Growth Comparison by Channel, 2025-2035
  • Figure 87: East Asia Attractiveness Analysis by Channel
  • Figure 88: East Asia Value Share and BPS Analysis by Claim, 2025 and 2035
  • Figure 89: East Asia Y-o-Y Growth Comparison by Claim, 2025-2035
  • Figure 90: East Asia Attractiveness Analysis by Claim
  • Figure 91: South Asia & Pacific Value Share and BPS Analysis by Country, 2025 and 2035
  • Figure 92: South Asia & Pacific Value Share and BPS Analysis by Function, 2025 and 2035
  • Figure 93: South Asia & Pacific Y-o-Y Growth Comparison by Function, 2025-2035
  • Figure 94: South Asia & Pacific Attractiveness Analysis by Function
  • Figure 95: South Asia & Pacific Value Share and BPS Analysis by Product Type, 2025 and 2035
  • Figure 96: South Asia & Pacific Y-o-Y Growth Comparison by Product Type, 2025-2035
  • Figure 97: South Asia & Pacific Attractiveness Analysis by Product Type
  • Figure 98: South Asia & Pacific Value Share and BPS Analysis by Active System, 2025 and 2035
  • Figure 99: South Asia & Pacific Y-o-Y Growth Comparison by Active System, 2025-2035
  • Figure 100: South Asia & Pacific Attractiveness Analysis by Active System
  • Figure 101: South Asia & Pacific Value Share and BPS Analysis by Channel, 2025 and 2035
  • Figure 102: South Asia & Pacific Y-o-Y Growth Comparison by Channel, 2025-2035
  • Figure 103: South Asia & Pacific Attractiveness Analysis by Channel
  • Figure 104: South Asia & Pacific Value Share and BPS Analysis by Claim, 2025 and 2035
  • Figure 105: South Asia & Pacific Y-o-Y Growth Comparison by Claim, 2025-2035
  • Figure 106: South Asia & Pacific Attractiveness Analysis by Claim
  • Figure 107: Middle East and Africa Value Share and BPS Analysis by Country, 2025 and 2035
  • Figure 108: Middle East and Africa Value Share and BPS Analysis by Function, 2025 and 2035
  • Figure 109: Middle East and Africa Y-o-Y Growth Comparison by Function, 2025-2035
  • Figure 110: Middle East and Africa Attractiveness Analysis by Function
  • Figure 111: Middle East and Africa Value Share and BPS Analysis by Product Type, 2025 and 2035
  • Figure 112: Middle East and Africa Y-o-Y Growth Comparison by Product Type, 2025-2035
  • Figure 113: Middle East and Africa Attractiveness Analysis by Product Type
  • Figure 114: Middle East and Africa Value Share and BPS Analysis by Active System, 2025 and 2035
  • Figure 115: Middle East and Africa Y-o-Y Growth Comparison by Active System, 2025-2035
  • Figure 116: Middle East and Africa Attractiveness Analysis by Active System
  • Figure 117: Middle East and Africa Value Share and BPS Analysis by Channel, 2025 and 2035
  • Figure 118: Middle East and Africa Y-o-Y Growth Comparison by Channel, 2025-2035
  • Figure 119: Middle East and Africa Attractiveness Analysis by Channel
  • Figure 120: Middle East and Africa Value Share and BPS Analysis by Claim, 2025 and 2035
  • Figure 121: Middle East and Africa Y-o-Y Growth Comparison by Claim, 2025-2035
  • Figure 122: Middle East and Africa Attractiveness Analysis by Claim
  • Figure 123: Global - Tier Structure Analysis
  • Figure 124: Global - Company Share Analysis

Frequently Asked Questions

How big is the Pollution-Fighting Urban Skincare Market in 2025?

The global Pollution-Fighting Urban Skincare Market is estimated to be valued at USD 3,002.5 million in 2025.

What will be the size of the Pollution-Fighting Urban Skincare Market in 2035?

The market size for the Pollution-Fighting Urban Skincare Market is projected to reach USD 9,405.6 million by 2035.

How much will be the Pollution-Fighting Urban Skincare Market growth between 2025 and 2035?

The Pollution-Fighting Urban Skincare Market is expected to grow at a CAGR of 12.1% between 2025 and 2035.

What are the key product types in the Pollution-Fighting Urban Skincare Market?

The key product types in the Pollution-Fighting Urban Skincare Market are moisturizers with SPF, serums, cleansers, and protective mists/essences.

Which segment is expected to contribute the largest share in the Pollution-Fighting Urban Skincare Market in 2025?

In terms of claims, SPF-included products are expected to command 55.7% share in the Pollution-Fighting Urban Skincare Market in 2025.

Explore Similar Insights

Future Market Insights

Pollution-Fighting Urban Skincare Market

Chat With

MaRIA

Hi There, I am MaRIA, Your Market Research Intelligence Assistant. How may I help you?