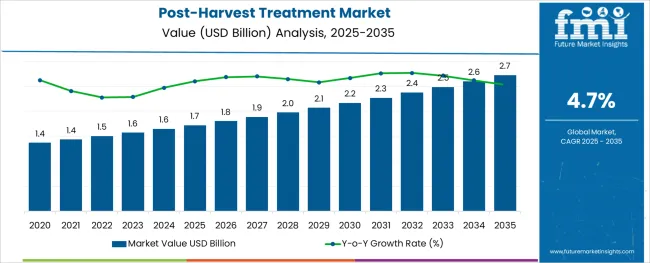
The Post-Harvest Treatment Market is estimated to be valued at USD 1.7 billion in 2025 and is projected to reach USD 2.7 billion by 2035, registering a compound annual growth rate (CAGR) of 4.7% over the forecast period.

The stainless steel valve tag market is expanding steadily as industrial sectors prioritize asset management, safety compliance, and equipment traceability. Increasing investments in infrastructure and process automation have heightened demand for robust and clear identification solutions capable of withstanding harsh environments.
The shift toward digital transformation in industries such as oil and gas, manufacturing, and utilities is encouraging the adoption of advanced tagging systems that support maintenance and audit operations. Growing awareness around regulatory compliance for equipment labeling and enhanced safety protocols is also influencing market expansion.
The rise of e-commerce platforms has facilitated easier procurement of valve tags, increasing accessibility for small to medium enterprises and broadening geographic reach. Material innovations and customization options continue to enhance product longevity and visibility, creating opportunities for market penetration across diverse industrial applications.
The market is segmented by Category and Product Type and region. By Category, the market is divided into Fruits and Vegetables. In terms of Product Type, the market is classified into Coatings, Cleaners, Sanitizers, Fungicides, Sprout Inhibitors, and Ethylene Blockers. Regionally, the market is classified into North America, Latin America, Western Europe, Eastern Europe, Balkan & Baltic Countries, Russia & Belarus, Central Asia, East Asia, South Asia & Pacific, and the Middle East & Africa.
The market is segmented by Category and Product Type and region. By Category, the market is divided into Fruits and Vegetables. In terms of Product Type, the market is classified into Coatings, Cleaners, Sanitizers, Fungicides, Sprout Inhibitors, and Ethylene Blockers. Regionally, the market is classified into North America, Latin America, Western Europe, Eastern Europe, Balkan & Baltic Countries, Russia & Belarus, Central Asia, East Asia, South Asia & Pacific, and the Middle East & Africa.
The less than 30 mm thickness segment is expected to hold 41.3% of the revenue share in 2025 within the thickness category. This segment’s leadership is supported by its suitability for a wide range of valve sizes and equipment types, providing sufficient durability while minimizing material costs.
The thinner tags offer flexibility in installation, especially in tight spaces and complex piping systems, making them preferable for industries where compactness is critical. Their compatibility with standard mounting hardware and ability to endure corrosion and wear have reinforced demand in sectors emphasizing both performance and cost efficiency.
This balance between robustness and adaptability has contributed to the segment’s dominant position.

Within the product type category, engraved valve tags are projected to command 57.8% of the market revenue share in 2025, marking them as the leading product form. The prominence of engraved tags is due to their superior legibility, permanence, and resistance to environmental degradation such as fading, scratching, and chemical exposure.
Engraving allows precise and customizable marking, meeting stringent industry standards for traceability and safety. The technique supports complex information including serial numbers, barcodes, and QR codes, enhancing integration with digital asset management systems.
Manufacturers’ emphasis on delivering long-lasting, tamper-proof tags that reduce maintenance costs has reinforced the adoption of engraved tags in heavy industries.
Opportunity for the post-harvest treatment sector in the Asia Pacific The Asia Pacific has become the dominant region in the global post-harvest treatment industry. India and China are major exporters and manufacturers of fruits and vegetables such as potatoes, grapes, tomatoes, mangoes, cucumbers, and apples. Increased consumption and export of such fruits and vegetables in the region may present an opportunity for the post-harvest treatment sector.
The United States is likely to dominate the market for post-harvest treatment. Concerns about the safety and quality of food in the United States are increasing the demand for high-quality food items. This is projected to increase the desire for harvest treatment and solutions to sustain agricultural production. As a result, demand for post-harvest treatment is likely to surge in the United States.
Leading global producers of post-harvest solutions are working on protective coverings for fruits and vegetables that are precisely developed to help prevent moisture loss and optimize taste retention from the packinghouse to the export market.
Furthermore, Fresh Produce Technologies (FPT) collaborates with merchants and other businesses to supply high-quality fruits and vegetables to consumers worldwide. They produce high-speed labelers, coaters, scrubbers, mixers, dryers, cleaners, sealers, and other products.
Companies are dedicated to creating a future in which biodiversity coexists with humanity, where starvation and global warming are historical concepts. Where farms are more sustainable, with more adaptable and resilient plants, to enable families and communities to live better lives. In summary, agriculture contributes to the answer. As new agricultural leaders, we have the chance and the obligation to seize this moment.
Producers are creating an organic plant-based covering that helps produce fresher for extended periods while reducing food loss and waste. Furthermore, an integrated digital platform that leverages aggregated data, machine learning, and artificial intelligence to reduce food waste and generate quality and supply chain insights will enable real-time choices with live analytics.
Furthermore, participants have reaffirmed their commitment to providing solutions that increase product quality, aid in reducing food waste, and promote sustainability for our consumers, community, and planet.
Startups provide the insights required to improve post-harvest quality. Data from sensors within the stored product is coupled with environmental information and prediction algorithms to prescribe necessary adjustments to enhance the quality of the stored crop.
Furthermore, data on post-harvest crop conditions is recorded, saved, and available at the touch of a button, allowing for quality reporting from farm to fork while enhancing traceability and proof-of-provenance.
As per Future Market Insights (FM), the global post-harvest treatment is predicted to witness positive growth over the forecast period (2025 to 2035). Post-harvest treatment offers the best sensory quality crops, vegetables, and fruits to consumers. Demand for post-harvest treatment is projected to increase as the need to maintain good crop quality is surging for senescence and ripening processes in harvested crops and goods.
The risk of contamination or microbial development is lowered since all physiological processes are halted. These treatment procedures are also used to manage water loss, reduce ethylene damage, and control insects. Hence, the demand for post-harvest treatments is gaining traction amid growing adoption of organic products.
Another factor improving the demand in post-harvest treatment market is rising need to keep the food at an appropriate temperature, limit moisture loss, slow down unwanted chemical changes, and avoid physical damage such as bruising in order to delay rotting.
A pre-harvest system is a compilation of existing agricultural raw material producing methods. In the conventional agriculture system, pre- and post-harvest technologies are frequently of different social and economic structure.
This treatment not only improves the shelf life of fruits and vegetables, but it also protects them against infections, poor storage conditions, and pests while in transit. The global post-harvest treatment market is slated to witness steady growth in response to the growing consumption of bio-based product or organic products.
According to the USA Food and Agriculture Organization, global food waste and losses are around 40%-50% for root crops, vegetables and fruits and, 30% for cereals, 20% for oilseeds, meat, and dairy, and more than 35% for seafood each year.
As a result, consumers are getting concerned about reducing the post-harvest losses. Hence, to curb the losses in crops and vegetation, the demand for post-harvest treatment solution is surging, propelling the growth in the market.

Growing Consumption of High Quality Food Items to Spur Post-Harvest Treatment Solution Sales
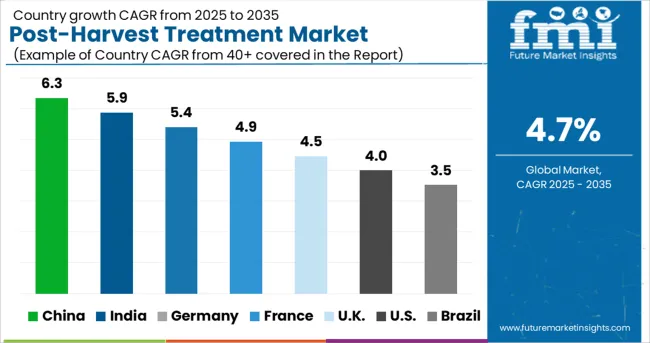
As per FMI, the USA is expected to dominate the post-harvest treatment market holding around 83.7% share in 2025. Sales in the USA market are expected to grow at a CAGR of 5.7% over the forecast period.
Growing concern about the safety and quality of the food in the USA is driving the demand for high quality food products. This is expected to augment the demand for harvest treatment and solutions to maintain the quality of the crops. On the back of this, the demand for post-harvest treatment is expected to rise in the USA
Increasing Demand for Organic Food Products to Push Post-Harvest Treatment Demand
Germany is expected to dominate the Europe post-harvest treatment market, as per the study. Sales of post-harvest treatment in Germany are expected to contribute 19.4% of demand share in 2025 and is expected to grow at a 4.9% CAGR over the forecast period.
Besides this, rising demand for organic food products is the key factor aiding the growth in Germany post-harvest treatment market. With rising consumption of organic and natural food products, the need to maintain the crops and food fresh is burgeoning. This will facilitate the growth in the market.
Need for High Yield in Agriculture Sector will Facilitate the Demand in India Post-Harvest Treatment Market
As per FMI, India is expected to spearhead the growth in South Asia post-harvest treatment market. India post-harvest treatment market is expected to account for 30.3% of revenue share in 2025 and is slated to expand at a CAGR of 5.5% over the forecast period.
Growing population is fueling the demand for food which is encouraging the farmers to focus on higher yield agricultural practices. Furthermore, after observing loss of fruits and vegetables after harvest, they are adopting post-harvest treatment solutions. This is expected to drive the demand in India post-harvest treatment market.
Adoption of Post-Harvest Treatment for Fruits to Increase at 3.2% CAGR through 2035
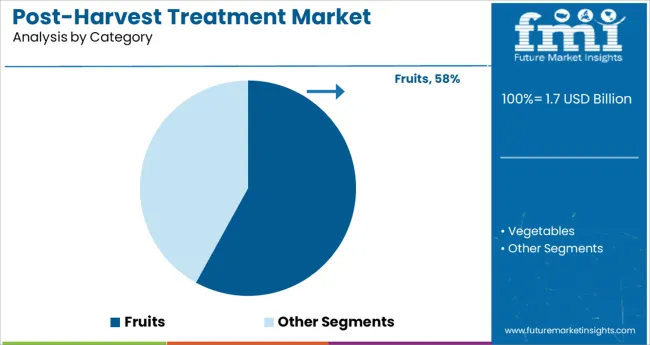
Among the category type, the fruits segment is dominating the post-harvest treatment market holding 67.4% share in 2025. Sales in the segment are expected to grow at a CAGR of 3.2% over the forecast period. Fruits are highly perishable products thus in order to increase the shelf life and to increase its nutritional value, demand for post-harvest treatment is anticipated to surge.
More than 2 out of 5 Post-Harvest Treatment Sales to Concentrate in Coatings Segment
Based on the product type, the coatings segment is expected to dominate the post-harvest treatment market holding 43.6% share in 2025 and it is expected to grow with CAGR of 2.9% over the forecast period.
Coatings are commonly used to extend the shelf life of fruits and vegetables and reduce quality and quantity losses during the packaging process. The introduction of coatings has made it easier to preserve the product's softness, color, odor, and flavor. These are some of the key factors improving the demand in coatings segment.

Key players profiled in the post-harvest treatment market are focusing on merger and acquisition activities in order to gain competitive advantage in the market.
In addition to this, these key players are investing in research and development to develop innovative technologies to maintain the food quality and expand their product portfolio.
For Instance -
| Attribute | Details |
|---|---|
| Expected Market Size (2025E) | 1.7 billion |
| Market Projected Size (2035F) | 2.7 billion |
| Value CAGR (2025 to 2035) | 4.7% |
| Forecast Period | 2025 to 2035 |
| Historical Data Available for | 2020 to 2025 |
| Market Analysis | billion for Value and MT for Volume |
| Key Regions Covered | North America; Latin America; Europe; East Asia; South Asia; Oceania; and the Middle East & Africa |
| Key Countries Covered | USA, Canada, Brazil, Mexico, Chile, Peru, Argentina, Germany, Italy, France, UK, Spain, Russia, BENELUX, Nordic, Poland, China, Japan, South Korea, India, Thailand, Indonesia, Malaysia, Singapore, Australia, New Zealand, GCC Countries, Turkey, South Africa, North Africa, and Central Africa |
| Key Segments Covered | Category, Product Type, and Region |
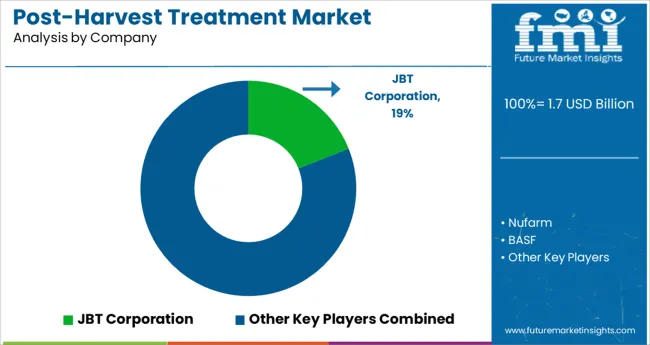
| Key Companies Profiled | JBT Corporation; Nufarm; BASF; Bayer; Syngenta; AgroFresh; Pace International; Futureco Bioscience; Post Harvest Solution LTD; Xeda International |
| Report Coverage | Market Forecast, Company Share Analysis, Competition Intelligence, DROT Analysis, Market Dynamics and Challenges, and Strategic Growth Initiatives |
The global post-harvest treatment market is estimated to be valued at USD 1.7 billion in 2025.
It is projected to reach USD 2.7 billion by 2035.
The market is expected to grow at a 4.7% CAGR between 2025 and 2035.
The key product types are fruits and vegetables.
coatings segment is expected to dominate with a 24.0% industry share in 2025.


Our Research Products

The "Full Research Suite" delivers actionable market intel, deep dives on markets or technologies, so clients act faster, cut risk, and unlock growth.

The Leaderboard benchmarks and ranks top vendors, classifying them as Established Leaders, Leading Challengers, or Disruptors & Challengers.

Locates where complements amplify value and substitutes erode it, forecasting net impact by horizon

We deliver granular, decision-grade intel: market sizing, 5-year forecasts, pricing, adoption, usage, revenue, and operational KPIs—plus competitor tracking, regulation, and value chains—across 60 countries broadly.

Spot the shifts before they hit your P&L. We track inflection points, adoption curves, pricing moves, and ecosystem plays to show where demand is heading, why it is changing, and what to do next across high-growth markets and disruptive tech

Real-time reads of user behavior. We track shifting priorities, perceptions of today’s and next-gen services, and provider experience, then pace how fast tech moves from trial to adoption, blending buyer, consumer, and channel inputs with social signals (#WhySwitch, #UX).

Partner with our analyst team to build a custom report designed around your business priorities. From analysing market trends to assessing competitors or crafting bespoke datasets, we tailor insights to your needs.
Supplier Intelligence
Discovery & Profiling
Capacity & Footprint
Performance & Risk
Compliance & Governance
Commercial Readiness
Who Supplies Whom
Scorecards & Shortlists
Playbooks & Docs
Category Intelligence
Definition & Scope
Demand & Use Cases
Cost Drivers
Market Structure
Supply Chain Map
Trade & Policy
Operating Norms
Deliverables
Buyer Intelligence
Account Basics
Spend & Scope
Procurement Model
Vendor Requirements
Terms & Policies
Entry Strategy
Pain Points & Triggers
Outputs
Pricing Analysis
Benchmarks
Trends
Should-Cost
Indexation
Landed Cost
Commercial Terms
Deliverables
Brand Analysis
Positioning & Value Prop
Share & Presence
Customer Evidence
Go-to-Market
Digital & Reputation
Compliance & Trust
KPIs & Gaps
Outputs
Full Research Suite comprises of:
Market outlook & trends analysis
Interviews & case studies
Strategic recommendations
Vendor profiles & capabilities analysis
5-year forecasts
8 regions and 60+ country-level data splits
Market segment data splits
12 months of continuous data updates
DELIVERED AS:
PDF EXCEL ONLINE
Treatment-Resistant Hypertension Management Market Size and Share Forecast Outlook 2025 to 2035
Treatment-Resistant Depression Treatment Market Size and Share Forecast Outlook 2025 to 2035
Treatment Pumps Market Insights Growth & Demand Forecast 2025 to 2035
Pretreatment Coatings Market Size and Share Forecast Outlook 2025 to 2035
Air Treatment Ozone Generator Market Size and Share Forecast Outlook 2025 to 2035
CNS Treatment and Therapy Market Insights - Trends & Growth Forecast 2025 to 2035
Seed Treatment Materials Market Size and Share Forecast Outlook 2025 to 2035
Acne Treatment Solutions Market Size and Share Forecast Outlook 2025 to 2035
Scar Treatment Market Overview - Growth & Demand Forecast 2025 to 2035
Soil Treatment Chemicals Market
Water Treatment System Market Size and Share Forecast Outlook 2025 to 2035
Water Treatment Chemical Market Size and Share Forecast Outlook 2025 to 2035
Algae Treatment Chemical Market Forecast and Outlook 2025 to 2035
Water Treatment Market Size and Share Forecast Outlook 2025 to 2035
Water Treatment Ozone Generator Market Size and Share Forecast Outlook 2025 to 2035
Water Treatment Equipment Market Size and Share Forecast Outlook 2025 to 2035
Burns Treatment Market Overview – Growth, Demand & Forecast 2025 to 2035
CRBSI Treatment Market Insights - Growth, Trends & Forecast 2025 to 2035
Water Treatment Polymers Market Growth & Demand 2025 to 2035
Asthma Treatment Market Forecast and Outlook 2025 to 2035

Thank you!
You will receive an email from our Business Development Manager. Please be sure to check your SPAM/JUNK folder too.
Chat With
MaRIA