Reports

- Global Locations -

Headquarters

Future Market Insights, Inc.

Christiana Corporate, 200
Continental Drive, Suite 401,
Newark, Delaware - 19713,
United States

T: +1-845-579-5705

Americas

Future Market Insights, Inc.

616 Corporate Way, Suite 2-9018,
Valley Cottage, NY 10989, United States

T: +1-347-918-3531

MEA

Future Market Insights

1602-6 Jumeirah Bay X2 Tower, Plot No: JLT-PH2-X2A,
Jumeirah Lakes Towers, Dubai,
United Arab Emirates

Europe

Future Market Insights

3rd Floor, 207 Regent Street,
W1B 3HH London
United Kingdom

T: + 44 (0) 20 8123 9659
D: +44 (0) 20 3287 4268

Asia Pacific

Future Market Insights

IndiaLand Global Tech Park, Unit UG-1, Behind Grand HighStreet, Phase 1, Hinjawadi, MH, Pune – 411057, India

Primary Hyperoxaluria Treatment Market Snapshot (2023 to 2033)

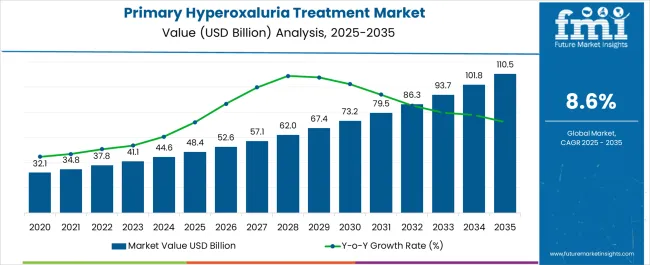
The global primary hyperoxaluria treatment market is expected to garner a market value of US$ 18 million in 2023 and is expected to accumulate a market value of US$ 41.07 million by registering a CAGR of 8.6% in the forecast period 2023 to 2033. The market for primary hyperoxaluria treatment registered a CAGR of 5.2% in the historical period 2018 to 2022.

Primary hyperoxaluria (PH) is a rare genetic disorder that affects the liver's ability to metabolize oxalate, leading to the formation of kidney stones and progressive kidney damage. The primary hyperoxaluria treatment market includes drugs and therapies aimed at reducing the production of oxalate in the body, managing symptoms, and preventing complications.

Some of the primary hyperoxaluria treatments available in the market include Lumasiran (Oxlumo), an RNA interference (RNAi) therapeutic that works by blocking the production of the enzyme that produces oxalate in the liver. The drug was approved by the FDA in 2020 for the treatment of PH type 1 in children and adults; Oxalate-degrading enzymes that can break down oxalate in the gut, reducing the amount of oxalate that is absorbed into the bloodstream; Kidney stone management and Dialysis and kidney transplant.

The primary hyperoxaluria treatment market is relatively small due to the rarity of the disease, but with the approval of Lumasiran, there is a growing focus on developing new therapies for the condition. Some companies currently working on PH treatments include Dicerna Pharmaceuticals, Alnylam Pharmaceuticals, and Allena Pharmaceuticals.

Report Attribute Details
Expected Market Value (2023) US$ 18 million
Anticipated Forecast Value (2033) US$ 41.07 million
Projected Growth Rate (2023 to 2033) 8.6% CAGR

Don't pay for what you don't need

Customize your report by selecting specific countries or regions and save 30%!

2018 to 2022 Primary Hyperoxaluria Treatment Market Demand Analysis vs. Forecast 2023 to 2033

According to market research and competitive intelligence provider, Future Market Insights- the market for Primary Hyperoxaluria Treatment reflected a value CAGR of 5.2% during the historical period, 2018 to 2022. One of the key drivers of market growth is the increasing prevalence of primary hyperoxaluria. While the condition is rare, its incidence has been steadily increasing in recent years, which is expected to drive demand for effective treatments.

The approval of Lumasiran in 2020 has also been a major boost to the market, as it represents the first targeted therapy for primary hyperoxaluria type 1. The drug has shown promising results in clinical trials, and its approval is expected to drive further research and development in the field.

In addition, the growing focus on precision medicine and personalized treatments is expected to drive innovation in the primary hyperoxaluria treatment market. With the increasing availability of genetic testing and personalized medicine, there is an opportunity to develop targeted therapies that are tailored to individual patients' genetic profiles.

The primary hyperoxaluria treatment market is expected to continue to grow in the coming years as new treatments are developed and approved, and as the demand for effective therapies for this rare disease continues to increase. Overall, the market for Primary Hyperoxaluria Treatment is expected to register a CAGR of 8.6% in the forecast period ranging from 2023 to 2033.

Which are Some Prominent Drivers of the Primary Hyperoxaluria Treatment Market?

Increasing Prevalence of Primary Hyperoxaluria to push market growth

The increasing prevalence of primary hyperoxaluria is expected to be a significant driver of market growth in the primary hyperoxaluria treatment market. While the condition is considered rare, its incidence has been steadily increasing in recent years.

Primary hyperoxaluria is a genetic disorder that affects the liver's ability to metabolize oxalate, which can lead to the formation of kidney stones and progressive kidney damage. According to the National Institutes of Health (NIH), the estimated prevalence of primary hyperoxaluria ranges from 1 in 100,000 to 1 in 1,000,000 individuals worldwide.

However, recent studies have suggested that the actual prevalence of the condition may be higher than previously thought. For example, a study published in the American Journal of Kidney Diseases in 2019 estimated that the incidence of primary hyperoxaluria in the United States is closer to 1 in 45,000 individuals.

As the prevalence of primary hyperoxaluria continues to increase, there is likely to be greater demand for diagnosis and treatment of the condition, which is expected to drive growth in the primary hyperoxaluria treatment market. In addition, as more people are diagnosed with the condition, there is likely to be greater interest and investment in research and development of new treatments, which could further boost market growth.

Overall, the increasing prevalence of primary hyperoxaluria is expected to be a significant driver of market growth, as it is likely to lead to greater demand for effective treatments and increased investment in the development of new therapies.

Sabyasachi Ghosh
Sabyasachi Ghosh

Principal Consultant

Talk to Analyst

Find your sweet spots for generating winning opportunities in this market.

What are the Challenges Faced by the Primary Hyperoxaluria Treatment Market?

Expensive Cost of Treatment to restrict Market Growth

One of the significant challenges faced by the PKU therapeutics market is the lack of awareness and underdiagnosis of the disorder. Primary hyperoxaluria is a rare disease, and as a result, there is limited awareness of the condition among healthcare providers and the general public. This can lead to delays in diagnosis and treatment, which can negatively impact patient outcomes.

Moreover, developing new treatments for rare diseases such as primary hyperoxaluria can be challenging, as the regulatory environment can be complex and uncertain. This can lead to delays in bringing new therapies to market. Overall, while there have been some recent advances in the primary hyperoxaluria treatment market, there are still several challenges that need to be addressed to improve patient outcomes and ensure the development of more effective and accessible treatments.
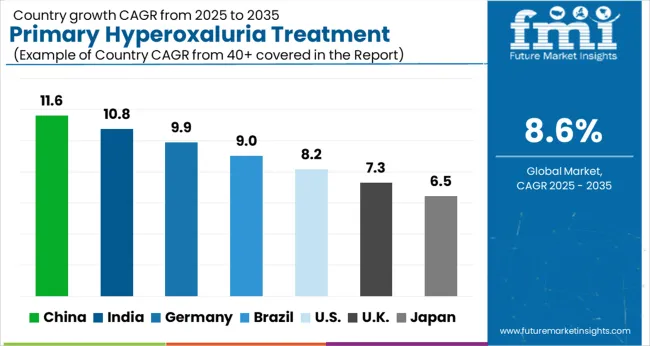
Region-Wise Insights

How is the Primary Hyperoxaluria Treatment Market Turning Out in the South & East Asia Region?

Increasing awareness and diagnosis of the condition Shaping Landscape for Primary Hyperoxaluria Treatment in South & East Asia

The primary hyperoxaluria treatment market is still developing in the South & East Asia region, and there is limited data available on the prevalence and treatment of the condition in the region. However, there have been some recent developments that suggest that the market is starting to grow in this region.

For example, in 2020, the pharmaceutical company Alnylam Pharmaceuticals announced that its drug Lumasiran, the first targeted therapy for primary hyperoxaluria type 1, had received regulatory approval in Japan. This was a significant development, as Japan is a major market in the South & East Asia region and has a well-established healthcare system. The approval of Lumasiran in Japan is likely to increase awareness of primary hyperoxaluria in the region and could lead to greater demand for diagnosis and treatment of the condition.

In addition, there have been some recent studies that suggest that the prevalence of primary hyperoxaluria may be higher in certain parts of the South & East Asia region than previously thought. For example, a study published in the Journal of the American Society of Nephrology in 2020 found that the prevalence of primary hyperoxaluria type 1 was higher in parts of India than previously reported. This suggests that there may be a significant unmet need for primary hyperoxaluria treatment in the region.

Overall, while the primary hyperoxaluria treatment market is still developing in the South & East Asia region, recent developments suggest that there is growing interest and investment in this area. As awareness of the condition increases and more effective treatments become available, it is likely that the market will continue to grow in the region.

What are the Factors Boosting the Market for Primary Hyperoxaluria Treatment in North America?

Increasing Focus on Technological Advancements shaping Landscape for Primary Hyperoxaluria Treatment in North America

The market for primary hyperoxaluria treatment in North America is expected to grow due to several factors. One of the primary drivers of market growth is the relatively high prevalence of primary hyperoxaluria in the region, particularly primary hyperoxaluria type 1. According to the National Institutes of Health (NIH), the estimated prevalence of primary hyperoxaluria type 1 in the United States is approximately 1 in 100,000 individuals. This high prevalence of the condition is expected to drive demand for effective treatments in the region.

Another factor that is contributing to market growth in North America is the increasing awareness and diagnosis of primary hyperoxaluria. There is growing recognition of the condition among healthcare professionals, which is leading to more accurate diagnosis and treatment of the condition. This is particularly true for primary hyperoxaluria type 1, which is often diagnosed in childhood. As more people are diagnosed with the condition, there is likely to be greater demand for effective treatments.

Advances in the development of treatments for primary hyperoxaluria are also driving market growth in North America. Lumasiran, a drug that targets the underlying genetic cause of primary hyperoxaluria type 1, was approved by the USA Food and Drug Administration (FDA) in 2020. This has led to greater interest and investment in the development of new therapies, which is expected to boost market growth.

In addition, favorable reimbursement policies in North America are making primary hyperoxaluria treatment more accessible to patients. For example, kidney transplantation, which is a treatment option for some patients with end-stage renal disease caused by primary hyperoxaluria, is typically covered by insurance in North America. This makes it easier for patients to access the treatment they need.

Finally, North America has a strong healthcare infrastructure that is able to support the development and delivery of new treatments for primary hyperoxaluria. This includes specialized centers for the treatment of rare diseases, which can provide comprehensive care for patients with the condition. The strong healthcare infrastructure in North America is expected to contribute to continued growth in the primary hyperoxaluria treatment market in the region.

Overall, the combination of high prevalence, increasing awareness and diagnosis, advances in treatment options, favorable reimbursement policies, and a strong healthcare infrastructure is expected to drive growth in the primary hyperoxaluria treatment market in North America.

Get the data you need at a Fraction of the cost

Personalize your report by choosing insights you need
and save 40%!

Category-Wise Insights

By Route of Administration, Which Segment is Likely to Account for a Significant Share?

Parenteral route of administration to hold a significant share and push market growth

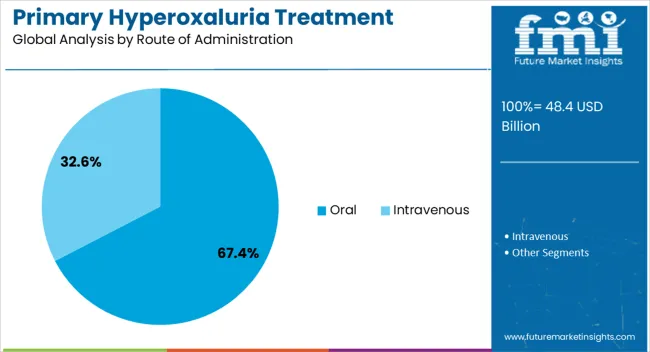
The injectable route of administration is likely to account for a significant share of the Primary Hyperoxaluria Treatment market. Currently, the only approved therapy for the treatment of primary hyperoxaluria is Lumasiran, which is administered via subcutaneous injection. Therefore, the subcutaneous injection route of administration is expected to account for a significant share of the primary hyperoxaluria treatment market.

However, there are also other therapies currently in development for the treatment of primary hyperoxaluria that may use different routes of administration. For example, some gene therapy approaches are being developed that would involve the delivery of a therapeutic gene via a viral vector. These therapies may use an intravenous infusion or other routes of administration. Overall, while the subcutaneous injection route of administration is currently dominant in the primary hyperoxaluria treatment market, the development of new therapies may lead to the use of different routes of administration in the future.

By Distribution Channel, Which Segment is Likely to Account for a Significant Share?

Hospital pharmacies segment to hold a significant share and push market growth

Hospitals and specialty clinics are often the first point of contact for patients with Primary Hyperoxaluria, as they provide specialized care and access to diagnostic tools and treatments. These facilities also have the expertise and resources to provide comprehensive care to patients with complex or severe cases of Primary Hyperoxaluria.

In addition, many of the treatments for Primary Hyperoxaluria require specialized administration or monitoring, such as intravitreal injections or electroretinography testing, which are typically performed in hospitals or specialty clinics. This further contributes to the dominance of these distribution channels in the Primary Hyperoxaluria Treatment market.

Overall, hospitals and specialty clinics are likely to continue to account for a significant share of the Primary Hyperoxaluria Treatment market, driven by the specialized care and expertise they provide. However, as patient preferences and healthcare delivery models continue to evolve, the market share of the various distribution channels may shift over time.
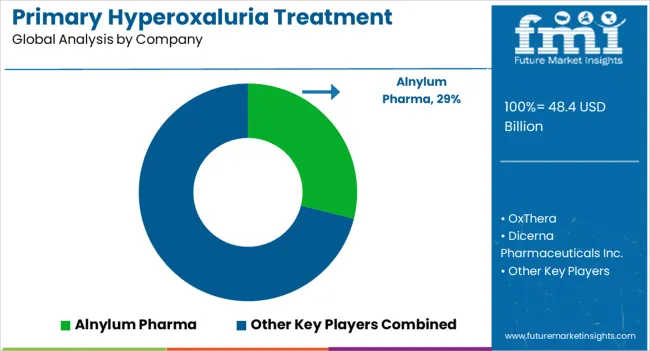
Market Competition

Key players in the market include companies such as Competition Deep Dive, Alnylum Pharma, OxThera, Dicerna Pharmaceuticals, Inc., Allena Pharmaceuticals, Biocodex, Tecoland Corporation, Zhejiang Tianxin Pharmaceutical Co., Takeda Pharmaceuticals, Wuxi Further Pharmaceutical Co Ltd, Genentech, along with healthcare providers and technology companies among other global players.

  • In 2020, The United States Food and Drug Administration (FDA) gave the green light to Oxlumo (lumasiran) as the initial treatment for primary hyperoxaluria type 1 (PH1), a rare hereditary disorder. This groundbreaking approval is the culmination of the work of specialists and community members coordinated by the Oxalosis & Hyperoxaluria Foundation and the Kidney Health Initiative.
  • The approval of Oxlumo was a result of input from patients, treating physicians, experts, and sponsors at a patient-focused drug development meeting and through other collaborative efforts. Oxlumo's function is to reduce the production of oxalate in patients with PH1. The drug was evaluated in two separate trials in PH1 patients: a randomized, placebo-controlled trial in patients aged six years and older, and an open-label study in patients under six years old. The patients ranged in age from four months to 61 years at the start of treatment.

Report Scope

Report Attribute Details
Market Value in 2023 US$ 18 million
Market Value in 2033 US$ 41.07 million
Growth Rate CAGR of 8.6% from 2023 to 2033
Base Year for Estimation 2022
Historical Data 2018 to 2022
Forecast Period 2023 to 2033
Quantitative Units Revenue in US$ Million and CAGR from 2023 to 2033
Report Coverage Revenue Forecast, Volume Forecast, Company Ranking, Competitive Landscape, Growth Factors, Trends, and Pricing Analysis
Segments Covered
  • Type
  • Route of Administration
  • Distribution Channel
  • Drug Class
  • Region
Regions Covered
  • North America
  • Latin America
  • Europe
  • South Asia
  • East Asia
  • Oceania
  • Middle East & Africa
Key Countries Profiled
  • United States
  • Canada
  • Brazil
  • Mexico
  • Germany
  • United Kingdom
  • France
  • Spain
  • Italy
  • Malaysia
  • Singapore
  • India
  • Thailand
  • China
  • Japan
  • South Korea
  • Australia
  • New Zealand
  • GCC Countries
  • South Africa
  • Israel
Key Companies Profiled
  • Alnylum Pharma
  • OxThera
  • Dicerna Pharmaceuticals Inc.
  • Allena Pharmaceuticals
  • Biocodex
  • Tecoland Corporation
  • Zhejiang Tianxin Pharmaceutical Co.
  • Takeda Pharmaceuticals
  • Wuxi Further Pharmaceutical Co Ltd
  • Genentech
Customization Available Upon Request

Key Segments Profiled in the Primary Hyperoxaluria Treatment Industry Survey

Type:

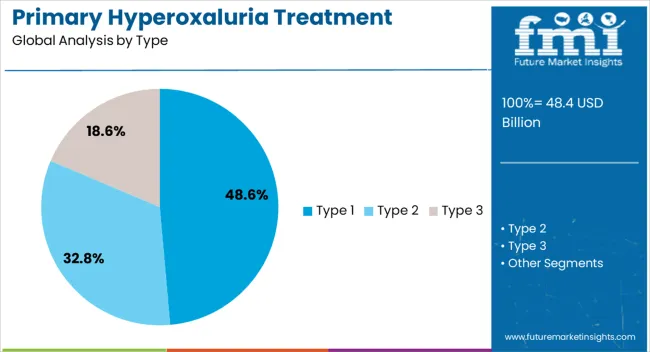
  • Type 1
  • Type 2
  • Type 3

Drug Class:

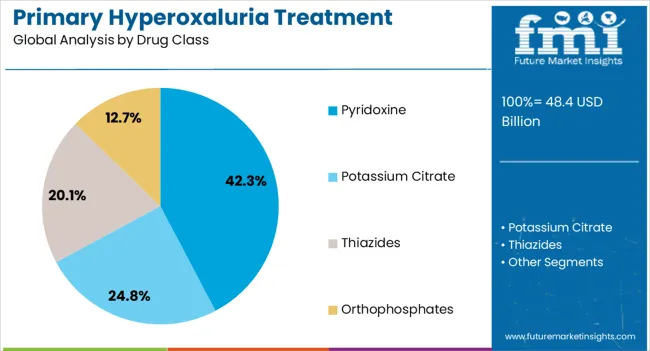
  • Pyridoxine
  • Potassium Citrate
  • Thiazides
  • Orthophosphates

Route of Administration:

  • Oral
  • Intravenous

Distribution Channel:

  • Hospital Pharmacies
  • Retail Pharmacies
  • Online Pharmacies

Region:

  • North America
  • Latin America
  • Europe
  • East Asia
  • South Asia
  • Oceania
  • Middle East & Africa

Frequently Asked Questions

How Big is the Primary Hyperoxaluria Treatment Market?

The market value reaches US$ 18 million in 2023.

What are the Projected Dimensions of the Market by 2033?

The market is anticipated to surpass US$ 41.07 million by 2033, with a CAGR of 8.6%.

Which is the Top Trend in the Primary Hyperoxaluria Treatment Market?

Advancing innovative enzyme replacement therapies is the current market trend.

Which Country Holds High Lucrativeness for Primary Hyperoxaluria Treatment?

The United States shines as a lucrative primary hyperoxaluria treatment hub.

How was the Historical Performance of the Primary Hyperoxaluria Treatment Market?

The market experienced a CAGR of 5.2% between 2018 and 2022.

Table of Content

1. Executive Summary | Primary Hyperoxaluria Treatment Market

    1.1. Global Market Outlook

    1.2. Demand-side Trends

    1.3. Supply-side Trends

    1.4. Technology Roadmap Analysis

    1.5. Analysis and Recommendations

2. Market Overview

    2.1. Market Coverage / Taxonomy

    2.2. Market Definition / Scope / Limitations

3. Market Background

    3.1. Market Dynamics

        3.1.1. Drivers

        3.1.2. Restraints

        3.1.3. Opportunity

        3.1.4. Trends

    3.2. Scenario Forecast

        3.2.1. Demand in Optimistic Scenario

        3.2.2. Demand in Likely Scenario

        3.2.3. Demand in Conservative Scenario

    3.3. Opportunity Map Analysis

    3.4. Investment Feasibility Matrix

    3.5. PESTLE and Porter’s Analysis

    3.6. Regulatory Landscape

        3.6.1. By Key Regions

        3.6.2. By Key Countries

    3.7. Regional Parent Market Outlook

4. Global Market Analysis 2018 to 2022 and Forecast, 2023 to 2033

    4.1. Historical Market Size Value (US$ Million) Analysis, 2018 to 2022

    4.2. Current and Future Market Size Value (US$ Million) Projections, 2023 to 2033

        4.2.1. Y-o-Y Growth Trend Analysis

        4.2.2. Absolute $ Opportunity Analysis

5. Global Market Analysis 2018 to 2022 and Forecast 2023 to 2033, By Type

    5.1. Introduction / Key Findings

    5.2. Historical Market Size Value (US$ Million) Analysis By Type, 2018 to 2022

    5.3. Current and Future Market Size Value (US$ Million) Analysis and Forecast By Type, 2023 to 2033

        5.3.1. Type 1

        5.3.2. Type 2

        5.3.3. Type 3

    5.4. Y-o-Y Growth Trend Analysis By Type, 2018 to 2022

    5.5. Absolute $ Opportunity Analysis By Type, 2023 to 2033

6. Global Market Analysis 2018 to 2022 and Forecast 2023 to 2033, By Drug Class

    6.1. Introduction / Key Findings

    6.2. Historical Market Size Value (US$ Million) Analysis By Drug Class, 2018 to 2022

    6.3. Current and Future Market Size Value (US$ Million) Analysis and Forecast By Drug Class, 2023 to 2033

        6.3.1. Pyridoxine

        6.3.2. Potassium Citrate

        6.3.3. Thiazides

        6.3.4. Orthophosphates

    6.4. Y-o-Y Growth Trend Analysis By Drug Class, 2018 to 2022

    6.5. Absolute $ Opportunity Analysis By Drug Class, 2023 to 2033

7. Global Market Analysis 2018 to 2022 and Forecast 2023 to 2033, By Route of Administration 

    7.1. Introduction / Key Findings

    7.2. Historical Market Size Value (US$ Million) Analysis By Route of Administration , 2018 to 2022

    7.3. Current and Future Market Size Value (US$ Million) Analysis and Forecast By Route of Administration , 2023 to 2033

        7.3.1. Oral

        7.3.2. Intravenous

    7.4. Y-o-Y Growth Trend Analysis By Route of Administration , 2018 to 2022

    7.5. Absolute $ Opportunity Analysis By Route of Administration , 2023 to 2033

8. Global Market Analysis 2018 to 2022 and Forecast 2023 to 2033, By Distribution Channel

    8.1. Introduction / Key Findings

    8.2. Historical Market Size Value (US$ Million) Analysis By Distribution Channel, 2018 to 2022

    8.3. Current and Future Market Size Value (US$ Million) Analysis and Forecast By Distribution Channel, 2023 to 2033

        8.3.1. Hospital pharmacies

        8.3.2. Retail pharmacies

        8.3.3. Online pharmacies

    8.4. Y-o-Y Growth Trend Analysis By Distribution Channel, 2018 to 2022

    8.5. Absolute $ Opportunity Analysis By Distribution Channel, 2023 to 2033

9. Global Market Analysis 2018 to 2022 and Forecast 2023 to 2033, By Region

    9.1. Introduction

    9.2. Historical Market Size Value (US$ Million) Analysis By Region, 2018 to 2022

    9.3. Current Market Size Value (US$ Million) Analysis and Forecast By Region, 2023 to 2033

        9.3.1. North America

        9.3.2. Latin America

        9.3.3. Europe

        9.3.4. South Asia

        9.3.5. East Asia

        9.3.6. Oceania

        9.3.7. Middle East & Africa

    9.4. Market Attractiveness Analysis By Region

10. North America Market Analysis 2018 to 2022 and Forecast 2023 to 2033, By Country

    10.1. Historical Market Size Value (US$ Million) Trend Analysis By Market Taxonomy, 2018 to 2022

    10.2. Market Size Value (US$ Million) Forecast By Market Taxonomy, 2023 to 2033

        10.2.1. By Country

            10.2.1.1. United States

            10.2.1.2. Canada

        10.2.2. By Type

        10.2.3. By Drug Class

        10.2.4. By Route of Administration

        10.2.5. By Distribution Channel

    10.3. Market Attractiveness Analysis

        10.3.1. By Country

        10.3.2. By Type

        10.3.3. By Drug Class

        10.3.4. By Route of Administration

        10.3.5. By Distribution Channel

    10.4. Key Takeaways

11. Latin America Market Analysis 2018 to 2022 and Forecast 2023 to 2033, By Country

    11.1. Historical Market Size Value (US$ Million) Trend Analysis By Market Taxonomy, 2018 to 2022

    11.2. Market Size Value (US$ Million) Forecast By Market Taxonomy, 2023 to 2033

        11.2.1. By Country

            11.2.1.1. Brazil

            11.2.1.2. Mexico

            11.2.1.3. Rest of Latin America

        11.2.2. By Type

        11.2.3. By Drug Class

        11.2.4. By Route of Administration

        11.2.5. By Distribution Channel

    11.3. Market Attractiveness Analysis

        11.3.1. By Country

        11.3.2. By Type

        11.3.3. By Drug Class

        11.3.4. By Route of Administration

        11.3.5. By Distribution Channel

    11.4. Key Takeaways

12. Europe Market Analysis 2018 to 2022 and Forecast 2023 to 2033, By Country

    12.1. Historical Market Size Value (US$ Million) Trend Analysis By Market Taxonomy, 2018 to 2022

    12.2. Market Size Value (US$ Million) Forecast By Market Taxonomy, 2023 to 2033

        12.2.1. By Country

            12.2.1.1. Germany

            12.2.1.2. United Kingdom

            12.2.1.3. France

            12.2.1.4. Spain

            12.2.1.5. Italy

            12.2.1.6. Rest of Europe

        12.2.2. By Type

        12.2.3. By Drug Class

        12.2.4. By Route of Administration

        12.2.5. By Distribution Channel

    12.3. Market Attractiveness Analysis

        12.3.1. By Country

        12.3.2. By Type

        12.3.3. By Drug Class

        12.3.4. By Route of Administration

        12.3.5. By Distribution Channel

    12.4. Key Takeaways

13. South Asia Market Analysis 2018 to 2022 and Forecast 2023 to 2033, By Country

    13.1. Historical Market Size Value (US$ Million) Trend Analysis By Market Taxonomy, 2018 to 2022

    13.2. Market Size Value (US$ Million) Forecast By Market Taxonomy, 2023 to 2033

        13.2.1. By Country

            13.2.1.1. India

            13.2.1.2. Malaysia

            13.2.1.3. Singapore

            13.2.1.4. Thailand

            13.2.1.5. Rest of South Asia

        13.2.2. By Type

        13.2.3. By Drug Class

        13.2.4. By Route of Administration

        13.2.5. By Distribution Channel

    13.3. Market Attractiveness Analysis

        13.3.1. By Country

        13.3.2. By Type

        13.3.3. By Drug Class

        13.3.4. By Route of Administration

        13.3.5. By Distribution Channel

    13.4. Key Takeaways

14. East Asia Market Analysis 2018 to 2022 and Forecast 2023 to 2033, By Country

    14.1. Historical Market Size Value (US$ Million) Trend Analysis By Market Taxonomy, 2018 to 2022

    14.2. Market Size Value (US$ Million) Forecast By Market Taxonomy, 2023 to 2033

        14.2.1. By Country

            14.2.1.1. China

            14.2.1.2. Japan

            14.2.1.3. South Korea

        14.2.2. By Type

        14.2.3. By Drug Class

        14.2.4. By Route of Administration

        14.2.5. By Distribution Channel

    14.3. Market Attractiveness Analysis

        14.3.1. By Country

        14.3.2. By Type

        14.3.3. By Drug Class

        14.3.4. By Route of Administration

        14.3.5. By Distribution Channel

    14.4. Key Takeaways

15. Oceania Market Analysis 2018 to 2022 and Forecast 2023 to 2033, By Country

    15.1. Historical Market Size Value (US$ Million) Trend Analysis By Market Taxonomy, 2018 to 2022

    15.2. Market Size Value (US$ Million) Forecast By Market Taxonomy, 2023 to 2033

        15.2.1. By Country

            15.2.1.1. Australia

            15.2.1.2. New Zealand

        15.2.2. By Type

        15.2.3. By Drug Class

        15.2.4. By Route of Administration

        15.2.5. By Distribution Channel

    15.3. Market Attractiveness Analysis

        15.3.1. By Country

        15.3.2. By Type

        15.3.3. By Drug Class

        15.3.4. By Route of Administration

        15.3.5. By Distribution Channel

    15.4. Key Takeaways

16. MEA Market Analysis 2018 to 2022 and Forecast 2023 to 2033, By Country

    16.1. Historical Market Size Value (US$ Million) Trend Analysis By Market Taxonomy, 2018 to 2022

    16.2. Market Size Value (US$ Million) Forecast By Market Taxonomy, 2023 to 2033

        16.2.1. By Country

            16.2.1.1. GCC Countries

            16.2.1.2. South Africa

            16.2.1.3. Israel

            16.2.1.4. Rest of MEA

        16.2.2. By Type

        16.2.3. By Drug Class

        16.2.4. By Route of Administration

        16.2.5. By Distribution Channel

    16.3. Market Attractiveness Analysis

        16.3.1. By Country

        16.3.2. By Type

        16.3.3. By Drug Class

        16.3.4. By Route of Administration

        16.3.5. By Distribution Channel

    16.4. Key Takeaways

17. Key Countries Market Analysis

    17.1. USA

        17.1.1. Pricing Analysis

        17.1.2. Market Share Analysis, 2022

            17.1.2.1. By Type

            17.1.2.2. By Drug Class

            17.1.2.3. By Route of Administration

            17.1.2.4. By Distribution Channel

    17.2. Canada

        17.2.1. Pricing Analysis

        17.2.2. Market Share Analysis, 2022

            17.2.2.1. By Type

            17.2.2.2. By Drug Class

            17.2.2.3. By Route of Administration

            17.2.2.4. By Distribution Channel

    17.3. Brazil

        17.3.1. Pricing Analysis

        17.3.2. Market Share Analysis, 2022

            17.3.2.1. By Type

            17.3.2.2. By Drug Class

            17.3.2.3. By Route of Administration

            17.3.2.4. By Distribution Channel

    17.4. Mexico

        17.4.1. Pricing Analysis

        17.4.2. Market Share Analysis, 2022

            17.4.2.1. By Type

            17.4.2.2. By Drug Class

            17.4.2.3. By Route of Administration

            17.4.2.4. By Distribution Channel

    17.5. Germany

        17.5.1. Pricing Analysis

        17.5.2. Market Share Analysis, 2022

            17.5.2.1. By Type

            17.5.2.2. By Drug Class

            17.5.2.3. By Route of Administration

            17.5.2.4. By Distribution Channel

    17.6. United kingdom

        17.6.1. Pricing Analysis

        17.6.2. Market Share Analysis, 2022

            17.6.2.1. By Type

            17.6.2.2. By Drug Class

            17.6.2.3. By Route of Administration

            17.6.2.4. By Distribution Channel

    17.7. France

        17.7.1. Pricing Analysis

        17.7.2. Market Share Analysis, 2022

            17.7.2.1. By Type

            17.7.2.2. By Drug Class

            17.7.2.3. By Route of Administration

            17.7.2.4. By Distribution Channel

    17.8. Spain

        17.8.1. Pricing Analysis

        17.8.2. Market Share Analysis, 2022

            17.8.2.1. By Type

            17.8.2.2. By Drug Class

            17.8.2.3. By Route of Administration

            17.8.2.4. By Distribution Channel

    17.9. Italy

        17.9.1. Pricing Analysis

        17.9.2. Market Share Analysis, 2022

            17.9.2.1. By Type

            17.9.2.2. By Drug Class

            17.9.2.3. By Route of Administration

            17.9.2.4. By Distribution Channel

    17.10. India

        17.10.1. Pricing Analysis

        17.10.2. Market Share Analysis, 2022

            17.10.2.1. By Type

            17.10.2.2. By Drug Class

            17.10.2.3. By Route of Administration

            17.10.2.4. By Distribution Channel

    17.11. Malaysia

        17.11.1. Pricing Analysis

        17.11.2. Market Share Analysis, 2022

            17.11.2.1. By Type

            17.11.2.2. By Drug Class

            17.11.2.3. By Route of Administration

            17.11.2.4. By Distribution Channel

    17.12. Singapore

        17.12.1. Pricing Analysis

        17.12.2. Market Share Analysis, 2022

            17.12.2.1. By Type

            17.12.2.2. By Drug Class

            17.12.2.3. By Route of Administration

            17.12.2.4. By Distribution Channel

    17.13. Thailand

        17.13.1. Pricing Analysis

        17.13.2. Market Share Analysis, 2022

            17.13.2.1. By Type

            17.13.2.2. By Drug Class

            17.13.2.3. By Route of Administration

            17.13.2.4. By Distribution Channel

    17.14. China

        17.14.1. Pricing Analysis

        17.14.2. Market Share Analysis, 2022

            17.14.2.1. By Type

            17.14.2.2. By Drug Class

            17.14.2.3. By Route of Administration

            17.14.2.4. By Distribution Channel

    17.15. Japan

        17.15.1. Pricing Analysis

        17.15.2. Market Share Analysis, 2022

            17.15.2.1. By Type

            17.15.2.2. By Drug Class

            17.15.2.3. By Route of Administration

            17.15.2.4. By Distribution Channel

    17.16. South Korea

        17.16.1. Pricing Analysis

        17.16.2. Market Share Analysis, 2022

            17.16.2.1. By Type

            17.16.2.2. By Drug Class

            17.16.2.3. By Route of Administration

            17.16.2.4. By Distribution Channel

    17.17. Australia

        17.17.1. Pricing Analysis

        17.17.2. Market Share Analysis, 2022

            17.17.2.1. By Type

            17.17.2.2. By Drug Class

            17.17.2.3. By Route of Administration

            17.17.2.4. By Distribution Channel

    17.18. New Zealand

        17.18.1. Pricing Analysis

        17.18.2. Market Share Analysis, 2022

            17.18.2.1. By Type

            17.18.2.2. By Drug Class

            17.18.2.3. By Route of Administration

            17.18.2.4. By Distribution Channel

    17.19. GCC Countries

        17.19.1. Pricing Analysis

        17.19.2. Market Share Analysis, 2022

            17.19.2.1. By Type

            17.19.2.2. By Drug Class

            17.19.2.3. By Route of Administration

            17.19.2.4. By Distribution Channel

    17.20. South Africa

        17.20.1. Pricing Analysis

        17.20.2. Market Share Analysis, 2022

            17.20.2.1. By Type

            17.20.2.2. By Drug Class

            17.20.2.3. By Route of Administration

            17.20.2.4. By Distribution Channel

    17.21. Israel

        17.21.1. Pricing Analysis

        17.21.2. Market Share Analysis, 2022

            17.21.2.1. By Type

            17.21.2.2. By Drug Class

            17.21.2.3. By Route of Administration

            17.21.2.4. By Distribution Channel

18. Market Structure Analysis

    18.1. Competition Dashboard

    18.2. Competition Benchmarking

    18.3. Market Share Analysis of Top Players

        18.3.1. By Regional

        18.3.2. By Type

        18.3.3. By Drug Class

        18.3.4. By Route of Administration

        18.3.5. By Distribution Channel

19. Competition Analysis

    19.1. Competition Deep Dive

        19.1.1. Alnylum Pharma

            19.1.1.1. Overview

            19.1.1.2. Product Portfolio

            19.1.1.3. Profitability by Market Segments

            19.1.1.4. Sales Footprint

            19.1.1.5. Strategy Overview

                19.1.1.5.1. Marketing Strategy

        19.1.2. OxThera

            19.1.2.1. Overview

            19.1.2.2. Product Portfolio

            19.1.2.3. Profitability by Market Segments

            19.1.2.4. Sales Footprint

            19.1.2.5. Strategy Overview

                19.1.2.5.1. Marketing Strategy

        19.1.3. Dicerna Pharmaceuticals, Inc.

            19.1.3.1. Overview

            19.1.3.2. Product Portfolio

            19.1.3.3. Profitability by Market Segments

            19.1.3.4. Sales Footprint

            19.1.3.5. Strategy Overview

                19.1.3.5.1. Marketing Strategy

        19.1.4. Allena Pharmaceuticals

            19.1.4.1. Overview

            19.1.4.2. Product Portfolio

            19.1.4.3. Profitability by Market Segments

            19.1.4.4. Sales Footprint

            19.1.4.5. Strategy Overview

                19.1.4.5.1. Marketing Strategy

        19.1.5. Biocodex

            19.1.5.1. Overview

            19.1.5.2. Product Portfolio

            19.1.5.3. Profitability by Market Segments

            19.1.5.4. Sales Footprint

            19.1.5.5. Strategy Overview

                19.1.5.5.1. Marketing Strategy

        19.1.6. Tecoland Corporation

            19.1.6.1. Overview

            19.1.6.2. Product Portfolio

            19.1.6.3. Profitability by Market Segments

            19.1.6.4. Sales Footprint

            19.1.6.5. Strategy Overview

                19.1.6.5.1. Marketing Strategy

        19.1.7. Zhejiang Tianxin Pharmaceutical Co.

            19.1.7.1. Overview

            19.1.7.2. Product Portfolio

            19.1.7.3. Profitability by Market Segments

            19.1.7.4. Sales Footprint

            19.1.7.5. Strategy Overview

                19.1.7.5.1. Marketing Strategy

        19.1.8. Takeda Pharmaceuticals

            19.1.8.1. Overview

            19.1.8.2. Product Portfolio

            19.1.8.3. Profitability by Market Segments

            19.1.8.4. Sales Footprint

            19.1.8.5. Strategy Overview

                19.1.8.5.1. Marketing Strategy

        19.1.9. Wuxi Further Pharmaceutical Co Ltd

            19.1.9.1. Overview

            19.1.9.2. Product Portfolio

            19.1.9.3. Profitability by Market Segments

            19.1.9.4. Sales Footprint

            19.1.9.5. Strategy Overview

                19.1.9.5.1. Marketing Strategy

        19.1.10. Genentech

            19.1.10.1. Overview

            19.1.10.2. Product Portfolio

            19.1.10.3. Profitability by Market Segments

            19.1.10.4. Sales Footprint

            19.1.10.5. Strategy Overview

                19.1.10.5.1. Marketing Strategy

20. Assumptions & Acronyms Used

21. Research Methodology

Don't pay for what you don't need

Customize your report by selecting specific countries or regions and save 30%!

List of Tables

Table 1: Global Market Value (US$ Million) Forecast by Region, 2018 to 2033

Table 2: Global Market Value (US$ Million) Forecast by Type, 2018 to 2033

Table 3: Global Market Value (US$ Million) Forecast by Drug Class, 2018 to 2033

Table 4: Global Market Value (US$ Million) Forecast by Route of Administration , 2018 to 2033

Table 5: Global Market Value (US$ Million) Forecast by Distribution Channel, 2018 to 2033

Table 6: North America Market Value (US$ Million) Forecast by Country, 2018 to 2033

Table 7: North America Market Value (US$ Million) Forecast by Type, 2018 to 2033

Table 8: North America Market Value (US$ Million) Forecast by Drug Class, 2018 to 2033

Table 9: North America Market Value (US$ Million) Forecast by Route of Administration , 2018 to 2033

Table 10: North America Market Value (US$ Million) Forecast by Distribution Channel, 2018 to 2033

Table 11: Latin America Market Value (US$ Million) Forecast by Country, 2018 to 2033

Table 12: Latin America Market Value (US$ Million) Forecast by Type, 2018 to 2033

Table 13: Latin America Market Value (US$ Million) Forecast by Drug Class, 2018 to 2033

Table 14: Latin America Market Value (US$ Million) Forecast by Route of Administration , 2018 to 2033

Table 15: Latin America Market Value (US$ Million) Forecast by Distribution Channel, 2018 to 2033

Table 16: Europe Market Value (US$ Million) Forecast by Country, 2018 to 2033

Table 17: Europe Market Value (US$ Million) Forecast by Type, 2018 to 2033

Table 18: Europe Market Value (US$ Million) Forecast by Drug Class, 2018 to 2033

Table 19: Europe Market Value (US$ Million) Forecast by Route of Administration , 2018 to 2033

Table 20: Europe Market Value (US$ Million) Forecast by Distribution Channel, 2018 to 2033

Table 21: South Asia Market Value (US$ Million) Forecast by Country, 2018 to 2033

Table 22: South Asia Market Value (US$ Million) Forecast by Type, 2018 to 2033

Table 23: South Asia Market Value (US$ Million) Forecast by Drug Class, 2018 to 2033

Table 24: South Asia Market Value (US$ Million) Forecast by Route of Administration , 2018 to 2033

Table 25: South Asia Market Value (US$ Million) Forecast by Distribution Channel, 2018 to 2033

Table 26: East Asia Market Value (US$ Million) Forecast by Country, 2018 to 2033

Table 27: East Asia Market Value (US$ Million) Forecast by Type, 2018 to 2033

Table 28: East Asia Market Value (US$ Million) Forecast by Drug Class, 2018 to 2033

Table 29: East Asia Market Value (US$ Million) Forecast by Route of Administration , 2018 to 2033

Table 30: East Asia Market Value (US$ Million) Forecast by Distribution Channel, 2018 to 2033

Table 31: Oceania Market Value (US$ Million) Forecast by Country, 2018 to 2033

Table 32: Oceania Market Value (US$ Million) Forecast by Type, 2018 to 2033

Table 33: Oceania Market Value (US$ Million) Forecast by Drug Class, 2018 to 2033

Table 34: Oceania Market Value (US$ Million) Forecast by Route of Administration , 2018 to 2033

Table 35: Oceania Market Value (US$ Million) Forecast by Distribution Channel, 2018 to 2033

Table 36: MEA Market Value (US$ Million) Forecast by Country, 2018 to 2033

Table 37: MEA Market Value (US$ Million) Forecast by Type, 2018 to 2033

Table 38: MEA Market Value (US$ Million) Forecast by Drug Class, 2018 to 2033

Table 39: MEA Market Value (US$ Million) Forecast by Route of Administration , 2018 to 2033

Table 40: MEA Market Value (US$ Million) Forecast by Distribution Channel, 2018 to 2033
Sabyasachi Ghosh
Sabyasachi Ghosh

Principal Consultant

Talk to Analyst

Find your sweet spots for generating winning opportunities in this market.

List of Charts

Figure 1: Global Market Value (US$ Million) by Type, 2023 to 2033

Figure 2: Global Market Value (US$ Million) by Drug Class, 2023 to 2033

Figure 3: Global Market Value (US$ Million) by Route of Administration, 2023 to 2033

Figure 4: Global Market Value (US$ Million) by Distribution Channel, 2023 to 2033

Figure 5: Global Market Value (US$ Million) by Region, 2023 to 2033

Figure 6: Global Market Value (US$ Million) Analysis by Region, 2018 to 2033

Figure 7: Global Market Value Share (%) and BPS Analysis by Region, 2023 to 2033

Figure 8: Global Market Y-o-Y Growth (%) Projections by Region, 2023 to 2033

Figure 9: Global Market Value (US$ Million) Analysis by Type, 2018 to 2033

Figure 10: Global Market Value Share (%) and BPS Analysis by Type, 2023 to 2033

Figure 11: Global Market Y-o-Y Growth (%) Projections by Type, 2023 to 2033

Figure 12: Global Market Value (US$ Million) Analysis by Drug Class, 2018 to 2033

Figure 13: Global Market Value Share (%) and BPS Analysis by Drug Class, 2023 to 2033

Figure 14: Global Market Y-o-Y Growth (%) Projections by Drug Class, 2023 to 2033

Figure 15: Global Market Value (US$ Million) Analysis by Route of Administration , 2018 to 2033

Figure 16: Global Market Value Share (%) and BPS Analysis by Route of Administration , 2023 to 2033

Figure 17: Global Market Y-o-Y Growth (%) Projections by Route of Administration , 2023 to 2033

Figure 18: Global Market Value (US$ Million) Analysis by Distribution Channel, 2018 to 2033

Figure 19: Global Market Value Share (%) and BPS Analysis by Distribution Channel, 2023 to 2033

Figure 20: Global Market Y-o-Y Growth (%) Projections by Distribution Channel, 2023 to 2033

Figure 21: Global Market Attractiveness by Type, 2023 to 2033

Figure 22: Global Market Attractiveness by Drug Class, 2023 to 2033

Figure 23: Global Market Attractiveness by Route of Administration , 2023 to 2033

Figure 24: Global Market Attractiveness by Distribution Channel, 2023 to 2033

Figure 25: Global Market Attractiveness by Region, 2023 to 2033

Figure 26: North America Market Value (US$ Million) by Type, 2023 to 2033

Figure 27: North America Market Value (US$ Million) by Drug Class, 2023 to 2033

Figure 28: North America Market Value (US$ Million) by Route of Administration , 2023 to 2033

Figure 29: North America Market Value (US$ Million) by Distribution Channel, 2023 to 2033

Figure 30: North America Market Value (US$ Million) by Country, 2023 to 2033

Figure 31: North America Market Value (US$ Million) Analysis by Country, 2018 to 2033

Figure 32: North America Market Value Share (%) and BPS Analysis by Country, 2023 to 2033

Figure 33: North America Market Y-o-Y Growth (%) Projections by Country, 2023 to 2033

Figure 34: North America Market Value (US$ Million) Analysis by Type, 2018 to 2033

Figure 35: North America Market Value Share (%) and BPS Analysis by Type, 2023 to 2033

Figure 36: North America Market Y-o-Y Growth (%) Projections by Type, 2023 to 2033

Figure 37: North America Market Value (US$ Million) Analysis by Drug Class, 2018 to 2033

Figure 38: North America Market Value Share (%) and BPS Analysis by Drug Class, 2023 to 2033

Figure 39: North America Market Y-o-Y Growth (%) Projections by Drug Class, 2023 to 2033

Figure 40: North America Market Value (US$ Million) Analysis by Route of Administration , 2018 to 2033

Figure 41: North America Market Value Share (%) and BPS Analysis by Route of Administration , 2023 to 2033

Figure 42: North America Market Y-o-Y Growth (%) Projections by Route of Administration , 2023 to 2033

Figure 43: North America Market Value (US$ Million) Analysis by Distribution Channel, 2018 to 2033

Figure 44: North America Market Value Share (%) and BPS Analysis by Distribution Channel, 2023 to 2033

Figure 45: North America Market Y-o-Y Growth (%) Projections by Distribution Channel, 2023 to 2033

Figure 46: North America Market Attractiveness by Type, 2023 to 2033

Figure 47: North America Market Attractiveness by Drug Class, 2023 to 2033

Figure 48: North America Market Attractiveness by Route of Administration , 2023 to 2033

Figure 49: North America Market Attractiveness by Distribution Channel, 2023 to 2033

Figure 50: North America Market Attractiveness by Country, 2023 to 2033

Figure 51: Latin America Market Value (US$ Million) by Type, 2023 to 2033

Figure 52: Latin America Market Value (US$ Million) by Drug Class, 2023 to 2033

Figure 53: Latin America Market Value (US$ Million) by Route of Administration , 2023 to 2033

Figure 54: Latin America Market Value (US$ Million) by Distribution Channel, 2023 to 2033

Figure 55: Latin America Market Value (US$ Million) by Country, 2023 to 2033

Figure 56: Latin America Market Value (US$ Million) Analysis by Country, 2018 to 2033

Figure 57: Latin America Market Value Share (%) and BPS Analysis by Country, 2023 to 2033

Figure 58: Latin America Market Y-o-Y Growth (%) Projections by Country, 2023 to 2033

Figure 59: Latin America Market Value (US$ Million) Analysis by Type, 2018 to 2033

Figure 60: Latin America Market Value Share (%) and BPS Analysis by Type, 2023 to 2033

Figure 61: Latin America Market Y-o-Y Growth (%) Projections by Type, 2023 to 2033

Figure 62: Latin America Market Value (US$ Million) Analysis by Drug Class, 2018 to 2033

Figure 63: Latin America Market Value Share (%) and BPS Analysis by Drug Class, 2023 to 2033

Figure 64: Latin America Market Y-o-Y Growth (%) Projections by Drug Class, 2023 to 2033

Figure 65: Latin America Market Value (US$ Million) Analysis by Route of Administration , 2018 to 2033

Figure 66: Latin America Market Value Share (%) and BPS Analysis by Route of Administration , 2023 to 2033

Figure 67: Latin America Market Y-o-Y Growth (%) Projections by Route of Administration , 2023 to 2033

Figure 68: Latin America Market Value (US$ Million) Analysis by Distribution Channel, 2018 to 2033

Figure 69: Latin America Market Value Share (%) and BPS Analysis by Distribution Channel, 2023 to 2033

Figure 70: Latin America Market Y-o-Y Growth (%) Projections by Distribution Channel, 2023 to 2033

Figure 71: Latin America Market Attractiveness by Type, 2023 to 2033

Figure 72: Latin America Market Attractiveness by Drug Class, 2023 to 2033

Figure 73: Latin America Market Attractiveness by Route of Administration , 2023 to 2033

Figure 74: Latin America Market Attractiveness by Distribution Channel, 2023 to 2033

Figure 75: Latin America Market Attractiveness by Country, 2023 to 2033

Figure 76: Europe Market Value (US$ Million) by Type, 2023 to 2033

Figure 77: Europe Market Value (US$ Million) by Drug Class, 2023 to 2033

Figure 78: Europe Market Value (US$ Million) by Route of Administration , 2023 to 2033

Figure 79: Europe Market Value (US$ Million) by Distribution Channel, 2023 to 2033

Figure 80: Europe Market Value (US$ Million) by Country, 2023 to 2033

Figure 81: Europe Market Value (US$ Million) Analysis by Country, 2018 to 2033

Figure 82: Europe Market Value Share (%) and BPS Analysis by Country, 2023 to 2033

Figure 83: Europe Market Y-o-Y Growth (%) Projections by Country, 2023 to 2033

Figure 84: Europe Market Value (US$ Million) Analysis by Type, 2018 to 2033

Figure 85: Europe Market Value Share (%) and BPS Analysis by Type, 2023 to 2033

Figure 86: Europe Market Y-o-Y Growth (%) Projections by Type, 2023 to 2033

Figure 87: Europe Market Value (US$ Million) Analysis by Drug Class, 2018 to 2033

Figure 88: Europe Market Value Share (%) and BPS Analysis by Drug Class, 2023 to 2033

Figure 89: Europe Market Y-o-Y Growth (%) Projections by Drug Class, 2023 to 2033

Figure 90: Europe Market Value (US$ Million) Analysis by Route of Administration , 2018 to 2033

Figure 91: Europe Market Value Share (%) and BPS Analysis by Route of Administration , 2023 to 2033

Figure 92: Europe Market Y-o-Y Growth (%) Projections by Route of Administration , 2023 to 2033

Figure 93: Europe Market Value (US$ Million) Analysis by Distribution Channel, 2018 to 2033

Figure 94: Europe Market Value Share (%) and BPS Analysis by Distribution Channel, 2023 to 2033

Figure 95: Europe Market Y-o-Y Growth (%) Projections by Distribution Channel, 2023 to 2033

Figure 96: Europe Market Attractiveness by Type, 2023 to 2033

Figure 97: Europe Market Attractiveness by Drug Class, 2023 to 2033

Figure 98: Europe Market Attractiveness by Route of Administration , 2023 to 2033

Figure 99: Europe Market Attractiveness by Distribution Channel, 2023 to 2033

Figure 100: Europe Market Attractiveness by Country, 2023 to 2033

Figure 101: South Asia Market Value (US$ Million) by Type, 2023 to 2033

Figure 102: South Asia Market Value (US$ Million) by Drug Class, 2023 to 2033

Figure 103: South Asia Market Value (US$ Million) by Route of Administration , 2023 to 2033

Figure 104: South Asia Market Value (US$ Million) by Distribution Channel, 2023 to 2033

Figure 105: South Asia Market Value (US$ Million) by Country, 2023 to 2033

Figure 106: South Asia Market Value (US$ Million) Analysis by Country, 2018 to 2033

Figure 107: South Asia Market Value Share (%) and BPS Analysis by Country, 2023 to 2033

Figure 108: South Asia Market Y-o-Y Growth (%) Projections by Country, 2023 to 2033

Figure 109: South Asia Market Value (US$ Million) Analysis by Type, 2018 to 2033

Figure 110: South Asia Market Value Share (%) and BPS Analysis by Type, 2023 to 2033

Figure 111: South Asia Market Y-o-Y Growth (%) Projections by Type, 2023 to 2033

Figure 112: South Asia Market Value (US$ Million) Analysis by Drug Class, 2018 to 2033

Figure 113: South Asia Market Value Share (%) and BPS Analysis by Drug Class, 2023 to 2033

Figure 114: South Asia Market Y-o-Y Growth (%) Projections by Drug Class, 2023 to 2033

Figure 115: South Asia Market Value (US$ Million) Analysis by Route of Administration , 2018 to 2033

Figure 116: South Asia Market Value Share (%) and BPS Analysis by Route of Administration , 2023 to 2033

Figure 117: South Asia Market Y-o-Y Growth (%) Projections by Route of Administration , 2023 to 2033

Figure 118: South Asia Market Value (US$ Million) Analysis by Distribution Channel, 2018 to 2033

Figure 119: South Asia Market Value Share (%) and BPS Analysis by Distribution Channel, 2023 to 2033

Figure 120: South Asia Market Y-o-Y Growth (%) Projections by Distribution Channel, 2023 to 2033

Figure 121: South Asia Market Attractiveness by Type, 2023 to 2033

Figure 122: South Asia Market Attractiveness by Drug Class, 2023 to 2033

Figure 123: South Asia Market Attractiveness by Route of Administration , 2023 to 2033

Figure 124: South Asia Market Attractiveness by Distribution Channel, 2023 to 2033

Figure 125: South Asia Market Attractiveness by Country, 2023 to 2033

Figure 126: East Asia Market Value (US$ Million) by Type, 2023 to 2033

Figure 127: East Asia Market Value (US$ Million) by Drug Class, 2023 to 2033

Figure 128: East Asia Market Value (US$ Million) by Route of Administration , 2023 to 2033

Figure 129: East Asia Market Value (US$ Million) by Distribution Channel, 2023 to 2033

Figure 130: East Asia Market Value (US$ Million) by Country, 2023 to 2033

Figure 131: East Asia Market Value (US$ Million) Analysis by Country, 2018 to 2033

Figure 132: East Asia Market Value Share (%) and BPS Analysis by Country, 2023 to 2033

Figure 133: East Asia Market Y-o-Y Growth (%) Projections by Country, 2023 to 2033

Figure 134: East Asia Market Value (US$ Million) Analysis by Type, 2018 to 2033

Figure 135: East Asia Market Value Share (%) and BPS Analysis by Type, 2023 to 2033

Figure 136: East Asia Market Y-o-Y Growth (%) Projections by Type, 2023 to 2033

Figure 137: East Asia Market Value (US$ Million) Analysis by Drug Class, 2018 to 2033

Figure 138: East Asia Market Value Share (%) and BPS Analysis by Drug Class, 2023 to 2033

Figure 139: East Asia Market Y-o-Y Growth (%) Projections by Drug Class, 2023 to 2033

Figure 140: East Asia Market Value (US$ Million) Analysis by Route of Administration , 2018 to 2033

Figure 141: East Asia Market Value Share (%) and BPS Analysis by Route of Administration , 2023 to 2033

Figure 142: East Asia Market Y-o-Y Growth (%) Projections by Route of Administration , 2023 to 2033

Figure 143: East Asia Market Value (US$ Million) Analysis by Distribution Channel, 2018 to 2033

Figure 144: East Asia Market Value Share (%) and BPS Analysis by Distribution Channel, 2023 to 2033

Figure 145: East Asia Market Y-o-Y Growth (%) Projections by Distribution Channel, 2023 to 2033

Figure 146: East Asia Market Attractiveness by Type, 2023 to 2033

Figure 147: East Asia Market Attractiveness by Drug Class, 2023 to 2033

Figure 148: East Asia Market Attractiveness by Route of Administration , 2023 to 2033

Figure 149: East Asia Market Attractiveness by Distribution Channel, 2023 to 2033

Figure 150: East Asia Market Attractiveness by Country, 2023 to 2033

Figure 151: Oceania Market Value (US$ Million) by Type, 2023 to 2033

Figure 152: Oceania Market Value (US$ Million) by Drug Class, 2023 to 2033

Figure 153: Oceania Market Value (US$ Million) by Route of Administration , 2023 to 2033

Figure 154: Oceania Market Value (US$ Million) by Distribution Channel, 2023 to 2033

Figure 155: Oceania Market Value (US$ Million) by Country, 2023 to 2033

Figure 156: Oceania Market Value (US$ Million) Analysis by Country, 2018 to 2033

Figure 157: Oceania Market Value Share (%) and BPS Analysis by Country, 2023 to 2033

Figure 158: Oceania Market Y-o-Y Growth (%) Projections by Country, 2023 to 2033

Figure 159: Oceania Market Value (US$ Million) Analysis by Type, 2018 to 2033

Figure 160: Oceania Market Value Share (%) and BPS Analysis by Type, 2023 to 2033

Figure 161: Oceania Market Y-o-Y Growth (%) Projections by Type, 2023 to 2033

Figure 162: Oceania Market Value (US$ Million) Analysis by Drug Class, 2018 to 2033

Figure 163: Oceania Market Value Share (%) and BPS Analysis by Drug Class, 2023 to 2033

Figure 164: Oceania Market Y-o-Y Growth (%) Projections by Drug Class, 2023 to 2033

Figure 165: Oceania Market Value (US$ Million) Analysis by Route of Administration , 2018 to 2033

Figure 166: Oceania Market Value Share (%) and BPS Analysis by Route of Administration , 2023 to 2033

Figure 167: Oceania Market Y-o-Y Growth (%) Projections by Route of Administration , 2023 to 2033

Figure 168: Oceania Market Value (US$ Million) Analysis by Distribution Channel, 2018 to 2033

Figure 169: Oceania Market Value Share (%) and BPS Analysis by Distribution Channel, 2023 to 2033

Figure 170: Oceania Market Y-o-Y Growth (%) Projections by Distribution Channel, 2023 to 2033

Figure 171: Oceania Market Attractiveness by Type, 2023 to 2033

Figure 172: Oceania Market Attractiveness by Drug Class, 2023 to 2033

Figure 173: Oceania Market Attractiveness by Route of Administration , 2023 to 2033

Figure 174: Oceania Market Attractiveness by Distribution Channel, 2023 to 2033

Figure 175: Oceania Market Attractiveness by Country, 2023 to 2033

Figure 176: MEA Market Value (US$ Million) by Type, 2023 to 2033

Figure 177: MEA Market Value (US$ Million) by Drug Class, 2023 to 2033

Figure 178: MEA Market Value (US$ Million) by Route of Administration , 2023 to 2033

Figure 179: MEA Market Value (US$ Million) by Distribution Channel, 2023 to 2033

Figure 180: MEA Market Value (US$ Million) by Country, 2023 to 2033

Figure 181: MEA Market Value (US$ Million) Analysis by Country, 2018 to 2033

Figure 182: MEA Market Value Share (%) and BPS Analysis by Country, 2023 to 2033

Figure 183: MEA Market Y-o-Y Growth (%) Projections by Country, 2023 to 2033

Figure 184: MEA Market Value (US$ Million) Analysis by Type, 2018 to 2033

Figure 185: MEA Market Value Share (%) and BPS Analysis by Type, 2023 to 2033

Figure 186: MEA Market Y-o-Y Growth (%) Projections by Type, 2023 to 2033

Figure 187: MEA Market Value (US$ Million) Analysis by Drug Class, 2018 to 2033

Figure 188: MEA Market Value Share (%) and BPS Analysis by Drug Class, 2023 to 2033

Figure 189: MEA Market Y-o-Y Growth (%) Projections by Drug Class, 2023 to 2033

Figure 190: MEA Market Value (US$ Million) Analysis by Route of Administration , 2018 to 2033

Figure 191: MEA Market Value Share (%) and BPS Analysis by Route of Administration , 2023 to 2033

Figure 192: MEA Market Y-o-Y Growth (%) Projections by Route of Administration , 2023 to 2033

Figure 193: MEA Market Value (US$ Million) Analysis by Distribution Channel, 2018 to 2033

Figure 194: MEA Market Value Share (%) and BPS Analysis by Distribution Channel, 2023 to 2033

Figure 195: MEA Market Y-o-Y Growth (%) Projections by Distribution Channel, 2023 to 2033

Figure 196: MEA Market Attractiveness by Type, 2023 to 2033

Figure 197: MEA Market Attractiveness by Drug Class, 2023 to 2033

Figure 198: MEA Market Attractiveness by Route of Administration , 2023 to 2033

Figure 199: MEA Market Attractiveness by Distribution Channel, 2023 to 2033

Figure 200: MEA Market Attractiveness by Country, 2023 to 2033

Recommendations

Healthcare

Kidney Stone Extraction Balloon Market

Published : July 2022

Healthcare

Pancreatic Stone Protein Testing Market

Published : July 2022

Explore Healthcare Insights

View Reports

Primary Hyperoxaluria Treatment Market